Rochester Institute of Technology
RIT Scholar Works
Theses Thesis/Dissertation Collections
3-5-2014
Perception and Mitigation of Artifacts in a Flat
Panel Tiled Display System
Stephen Dolph
Follow this and additional works at:http://scholarworks.rit.edu/theses
This Thesis is brought to you for free and open access by the Thesis/Dissertation Collections at RIT Scholar Works. It has been accepted for inclusion in Theses by an authorized administrator of RIT Scholar Works. For more information, please [email protected].
Recommended Citation
RIT
RIT
Chester F. Carlson Center for Imaging Science Rochester Institute of Technology
College of Science
Certificate of Approval
MS Degree Thesis
The MS thesis of Stephen Dolph has been examined and approved by the thesis committee as satisfactory for the thesis requirement for the Master of
Science degree in Imaging Science
______________________________ Dr. James Ferwerda, Thesis Advisor
______________________________ Dr. Susan Farnand, Committee Member
_______________________________ Dr. Ellen M. Kosik Williams, Committee Member
A
BSTRACT
Flat panel displays continue to dominate the display market. Larger, higher
resolution flat panel displays are now in demand for scientific, business, and
entertainment purposes. Manufacturing such large displays is currently difficult and expensive. Alternatively, larger displays can be constructed by tiling smaller flat panel displays. While this approach may prove to be more cost effective, appropriate measures must be taken to achieve visual seamlessness and uniformity.
In this project we conducted a set of experiments to study the perception and mitigation of image artifacts in tiled display systems. In the first experiment we used a prototype tiled display to investigate its current viability and to understand what critical perceptible visual artifacts exist in this system. Based on word frequencies of the survey responses, the most disruptive artifacts perceived were ranked. On the basis of these findings, we conducted a second experiment to test the effectiveness of image processing algorithms designed to mitigate some of the most distracting artifacts without changing the physical properties of the display system. Still images were processed using several algorithms and evaluated by observers using magnitude scaling. Participants in the experiment noticed statistically significant improvement in image quality from one of the two algorithms. Similar testing should be conducted to evaluate the effectiveness of the algorithms on video content. While much work still needs to be done, the contributions of this project should enable the development of an image processing pipeline to mitigate perceived artifacts in flat panel display systems and provide the groundwork for
extending such a pipeline to realtime applications.
D
EDICATION
In loving memory of
Aunt Rose,
Grandma,
Grandpa,
and
Opa
T
ABLE OF
C
ONTENTS
ABSTRACT... i
ACKNOWLEDGEMENTS ... ii
DEDICATION... iii
TABLE OF CONTENTS ... iv
LIST OF FIGURES ... vi
LIST OF TABLES ... xi
1 INTRODUCTION... 1
1.1 MOTIVATION... 1
1.2 OBJECTIVES... 3
1.3 THESIS OVERVIEW... 3
2 BACKGROUND ... 5
2.1 TILED DISPLAY SYSTEMS... 5
2.1.1 TILED DISPLAY MIDDLEWARE... 5
2.1.1.1 INPUT AND INTERACTION... 6
2.1.1.2 VIDEO AND GRAPHICS... 8
2.1.2 PROJECTORBASED TILED DISPLAYS... 9
2.1.2.1 ACHIEVING COLOR UNIFORMITY... 10
2.1.2.2 ACHIEVING GEOMETRIC SEAMLESSNESS... 15
2.1.3 FLAT PANEL TILED DISPLAY SYSTEMS... 18
2.1.3.1 SINGLESCREEN FLATPANEL TILED DISPLAYS... 18
2.1.3.2 PANORAMIC FLATPANEL TILED DISPLAYS... 21
2.2 CHARACTERISTICS OF THE HUMAN VISUAL SYSTEM... 22
2.2.1 RELATIONS TO TILED DISPLAY SYSTEMS... 27
3 PANORAMA DISPLAY SURVEY... 29
3.1 OBJECTIVES... 29
3.2 PHYSICAL SETUP... 30
3.3 SURVEY DESIGN... 31
3.3.1 BIOGRAPHICAL INFORMATION... 32
3.3.2 DISPLAY EXPERIENCE... 33
3.3.3 ORIENTATION... 34
3.3.4 OVERALL IMPRESSIONS (FIRST PASS)... 36
3.3.4.1 STIMULI... 37
3.3.5 DETAILED QUALITY EVALUATION (SECOND PASS)... 42
3.3.6 WRAPUP... 43
3.4 RESULTS AND ANALYSIS... 44
3.4.1 BIOGRAPHICAL INFORMATION... 44
3.4.2 DISPLAY EXPERIENCE... 44
3.4.3 ORIENTATION... 44
3.4.4 OVERALL IMPRESSIONS (FIRST PASS)... 44
3.4.5 DETAILED QUALITY EVALUATION (SECOND PASS)... 50
3.4.6 WRAPUP... 52
4 ALGORITHMIC MITIGATION OF SEAMLESSNESS PROBLEMS ... 54
4.1 MEASURING DISTORTIONS AND DEVEOLPING ALGORITHMS TO MITIGATE THEM... 54
4.1.1 MEASURING AND MITIGATING GEOMETRIC DISTORITIONS... 56
4.1.2 MEASURING AND MITIGATING LUMINANCNE AND CONTRAST NON UNIFORMITY... 60
4.2 EXPERIMENT TO DETERMINE THE EFFECTIVEMESS OF THE ALGORITHMS... 67
4.2.1 OBJECTIVES... 67
4.2.2 METHODS... 68
4.2.3 STIMULI... 68
4.2.4 PROCEDURE... 76
4.2.4.1 USER INTERFACE... 76
4.2.4.2 TASK... 78
4.2.4.3 OBSERVERS... 81
4.2.5 RESULTS AND ANALYSIS... 81
4.3 SUMMARY... 92
5 CONCLUSIONS, PROJECT CONTRIBUTIONS, AND FUTURE WORK ... 94
5.1 CONCLUSIONS AND PROJECT CONTRIBUTIONS... 94
5.2 FUTURE WORK... 96
5.2.1 IMPLEMENTATION FOR REAL TIME APPLICATIONS... 96
5.2.2 PERCEPTUAL EXPERIMENTS FOR VIDEO... 97
5.2.3 INVESTIGATION OF VIEWING POSITION AND DISPALY GEOMETRY EFFECTS... 97
5.2.4 SIMULATOR FOR PERCEPTUAL EXPERIMENTS... 98
L
IST OF
F
IGURES
FIGURE 2.1
SUITABLE MODALITIES OF INTERACTION FOR FOUR MAJOR INTERACTION ZONES IN FRONT OF A SCALABLE RESOLUTION DISPLAY WALL. DIFFERENT INTERACTION DEVICES ARE MORE
INTUITIVE/USEFUL BASED ON THE DISTANCE THE USER IS FROM THE DISPLAY [FROM LEIGH ET AL.2013] ... 8
FIGURE 2.2
THE TOP ROW SHOWS IMAGES BEFORE CORRECTION AND THE BOTTOM ROW SHOWS THE IMAGES AFTER LUMINANCE MATCHING FOR A 2 X 2 ARRAY OF FOUR PROJECTORS [FROM
MAJUMDER AND STEVENS 2004] ... 12
FIGURE 2.3
RESULTS OF MAJUMDER AND STEVENS PERCEPTUAL PHOTOMETRIC CALIBRATION ALGORITHM ON A 3 X 5 ARRAY OF FIFTEEN PROJECTORS. THE DISPLAY SYSTEM BEFORE ANY CORRECTION
(TOP LEFT). THE RESULT OF APPLYING THE ALGORITHM WITH THE SMOOTHING PARAMETER SET TO 400 (BOTTOM LEFT). THE RESULT OF APPLYING THE ALGORITHM WITH THE
SMOOTHING PARAMETER SET TO 800 (TOP RIGHT). THE RESULT OF PHOTOMETRIC UNIFORMITY, I.E. APPLYING THE ALGORITHM WITH THE SMOOTHING PARAMETER SET TO INFINITY (BOTTOM RIGHT). THE PEAK LUMINANCE DROPS AS THE UNIFORMITY CONSTRAINT IS MADE MORE STRINGENT, I.E AS THE SMOOTHING PARAMETER INCREASES [FROM MAJUMDER AND STEVENS 2005]... 14
FIGURE 2.4
THE RESULT OF GEOMETRIC REGISTRATION ON A 3 X 3 ARRAY OF NINE PROJECTORS. THE GEOMETRIC REGISTRATION IS ACHIEVED USING BICUBIC RATIONAL BEZIER PATCHES WITH SPARSE CORRESPONDENCES. THE TOP ROW IS BEFORE REGISTRATION AND THE BOTTOM ROW IS AFTER REGISTRATION. BHASKER, JUANG, & MAJUMDER 2007 ... 17
FIGURE 2.5
THE DESIGN OF LCD FLAT PANEL TILING SYSTEM DEVELOPED BY FUKUHARA ET AL. 1995 IS COMPARED WITH A GENERAL FRESNEL LENS. THE TOP VIEW OF A FRESNEL LENS IS SHOWN IN A AND SEGMENTED SIDE VIEW IS SHOWN IN B. A PORTION OF THE SEGMENTED VIEW IS MAGNIFIED IN C. NOTICE THE SHARP APEX. ALSO, A LCD PANEL IS SHOWN AS A LIGHT SOURCE AND OPTICAL PATHS ARE ILLUSTRATED TO SHOW HOW GHOST IMAGES ARE FORMED BY A REGULAR FRESNEL LENS. THE OPTICAL PATH SHOWN IN BLUE PRODUCES A REGULAR IMAGE, R. THE PATHS SHOWN IN RED PRODUCE BOTH A REGULAR IMAGE, R, AND A GHOST IMAGE CAUSED BY REFLECTION WITHIN THE LENS, G. FINALLY, THE MODIFICATION OF THE LENS IS SHOWN IN D. THE APEX HAS BEEN PLANARIZED (FLATTENED). THE APPLIED BLACK MASK THEN BLOCKS THE OPTICAL PATH OF THE GHOST IMAGE... 20
FIGURE 2.6
FIGURE 2.7
TYPICAL SPATIAL CONTRAST SENSITIVITY FUNCTIONS FOR LUMINANCE AND CHROMATIC CONTRAST [FROM FAIRCHILD 2005] ... 23
FIGURE 2.8
TYPICAL TEMPORAL CONTRAST SENSITIVITY FUNCTIONS FOR LUMINANCE AND CHROMATIC CONTRAST [FROM FAIRCHILD 2005] ... 25
FIGURE 2.9
THE COMPARISON OF UNFILTERED TEXT (LEFT), TEXT AFTER STANDARD ANTIALIASING FILTERING, AND TEXT AFTER CLEARTYPE’S RGB DECIMATION (RIGHT) [FROM BETRISEY ET AL. 2000]. ... 27
FIGURE 3.1
SCHEMATIC OF THE PANORAMA DISPLAY SETUP... 31
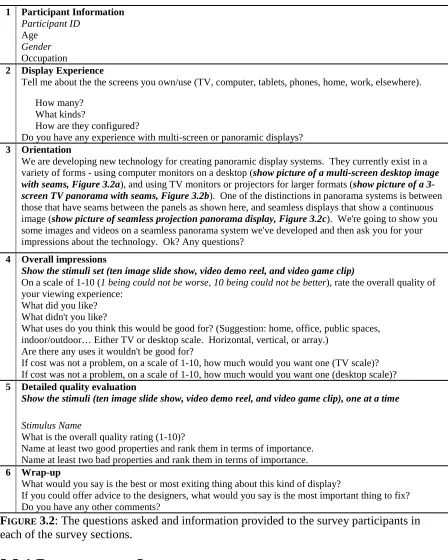
FIGURE 3.2
THE QUESTIONS ASKED AND INFORMATION PROVIDED TO THE SURVEY PARTICIPANTS IN EACH OF THE SURVEY SECTIONS... 32
FIGURE 3.3
THE THREE IMAGES WERE PRINTED. THE PRINTS WERE SHOWN TO HELP INTRODUCE
PARTICIPANTS TO THE SURVEY AND ITS GOALS. ... 35
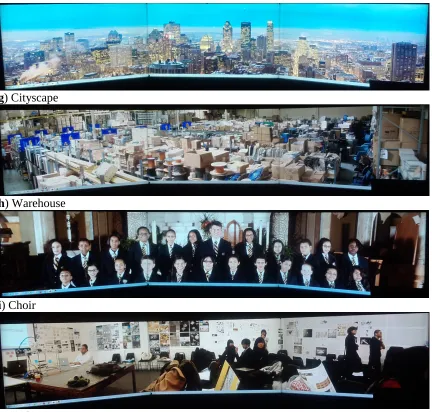
FIGURE 3.4
THE TEN STILL IMAGE STIMULI AS THEY WERE PRESENTED ON THE PROTOTYPE DISPLAY... 38
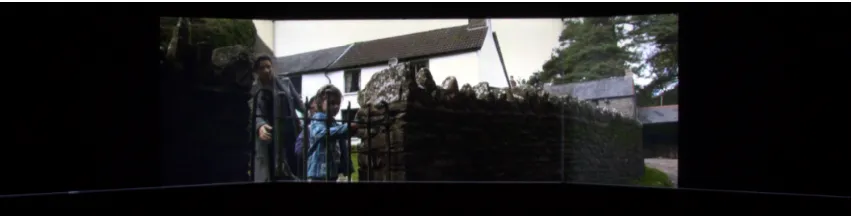
FIGURE 3.5
A FRAME OF THE VIDEO CLIP AS IT WAS PRESENTED ON THE DISPLAY IS SHOWN. THE VIDEO DID NOT FILL THE ENTIRE WIDTH OF THE DISPLAY SYSTEM, BUT IT MORE THAN COVERED THE AREA OF INTEREST NEAR THE SEAMS. ... 41
FIGURE 3.6
INDIVIDUAL NOVICES’ AND EXPERTS’ RANKINGS OF QUALITY ARE COMPARED. ... 46
FIGURE 3.7
INDIVIDUAL NOVICES’ AND EXPERTS’ RANKINGS OF DESIRE FOR A TELEVISION SIZE VERSION OF THE DISPLAY VERSION ARE COMPARED. ... 46
FIGURE 3.8
INDIVIDUAL NOVICES’ AND EXPERTS’ RANKINGS OF DESIRE FOR A DESKTOP SIZE VERSION OF THE DISPLAY ARE COMPARED. ... 47
FIGURE 3.9
MEAN RANKINGS OF QUALITY, DESIRE FOR A TV SIZE VERSION OF THE DISPLAY, AND DESIRE FOR A DESKTOP SIZE VERSION OF THE DISPLAY ARE COMPARED. THE ERROR BARS REPRESENT STANDARD DEVIATIONS. ... 47
FIGURE 3.10
THE WORD FREQUENCY ANALYSIS TECHNIQUE IS EXEMPLIFIED. ALL OBSERVER RESPONSES TO A SINGLE QUESTION ARE CONCATENATED INTO A SINGLE TEXT DOCUMENT. THEN THE
FREQUENCY OF EACH WORD IN THE DOCUMENT IS COUNTED AND TABULATED. THE TABLES FROM LEFT TO RIGHT SHOW (1) IDENTIFYING (IN YELLOW) CONJUNCTIONS, ARTICLES, PREPOSITIONS, AND OTHER WORDS UNRELATED TO THE APPEARANCE OF THE DISPLAY, (2) AFTER THE IDENTIFIED WORDS HAVE BEEN REMOVED, SYNONYM AND ANTONYMS ARE IDENTIFIED (IMAGES/SCENES IN YELLOW), (3) AFTER THE FIRST SET OF RELATED WORD AND THERE CORRESPONDING FREQUENCIES HAVE BEEN COMBINED, WORDS RELATED TO A
COMMON ISSUE ARE IDENTIFIED (RESOLUTION/DETAIL IN BLUE AND SIZE IN YELLOW), AND (4) THE GROUP OF WORD RELATING TO THE SAME ISSUE ARE COMBINED TO GIVE THE FINAL WORD FREQUENCY RANKINGS. ... 49
FIGURE 3.11
MEAN EXPERT AND NOVICE RANKINGS OF IMAGE QUALITY ARE COMPARED. THE ERROR BARS REPRESENT ON STANDARD DEVIATION. ... 51
FIGURE 4.1
MAPPING OF INPUT PIXEL HORIZONTAL LOCATION TO THE OUTPUT POSITION (NORMALIZED TO
600 PIXELS) CREATED BY THE DISPLAY OPTICS IS SHOWN ON THE LEFT. THIS MAPPING WAS ONLY USED FOR AREAS NEAR THE SEAMS WHERE DISTORTIONS ARE PRESENT. THE TOP RIGHT IS A CHECKERBOARD IMAGE. THE BOTTOM RIGHT IS THE SAME CHECKERBOARD MAPPED TO OUTPUT LOCATION, I.E. THE IMAGE THAT WOULD NEED TO BE DELIVERED TO THE DISPLAY TO APPEAR UNDISTORTED. ... 58
FIGURE 4.2
THE ALGORITHM USED TO CORRECT THE GEOMETRIC DISTORTION AND THE DISPLAY SEAMS IS OUTLINED. ... 59
FIGURE 4.3
THIS IS AN IMAGE OF THE SETUP USED TO CALIBRATE PIXEL RESPONSIVITY. LIGHT FROM A DIRECT CURRENT, TUNGSTEN SOURCE (STABILIZED) IS DIRECTED THOUGH A FIBER OPTIC CABLE INTO THE ENTRANCE PORT OF AN INTEGRATING SPHERE. THE CAMERA IS LOCATED AT THE EXIT PORT SUCH THAT EVERY PIXEL IN THE IMAGING SENSOR IS ENTIRELY COVERED BY THE UNIFORM FIELD CREATED BY THE LIGHT SOURCE AND SPHERE... 62
FIGURE 4.4
VISUALIZATION OF THE SPATIALLY VARYING CONTRAST WEIGHT IS SHOWN AS A PIXEL MAP.
THIS REPRESENTS HOW MUCH OF THE UNSHARP MASK AT A PARTICULAR PIXEL LOCATION SHOULD BE ADDED TO THE ORIGINAL IMAGE SUCH THAT THE RESULTANT IMAGE WILL APPEAR TO HAVE UNIFORM CONTRAST. LIGHTER AREAS THEREFORE CORRESPOND TO REGIONS OF THE DISPLAY WITH LOW CONTRAST (CONTRAST NEEDS TO BE ENHANCED) AND DARKER AREAS CORRESPOND TO DISPLAY REGIONS WITH HIGH CONTRAST. ... 62
FIGURE 4.5
THE ALGORITHM USED TO CORRECT LUMINANCE AND ENHANCE CONTRAST NEAR THE DISPLAY SEAMS IS OUTLINED. (LLC REFERS TO THE LINEAR LUMINANCE CORRECTED IMAGE.)... 66
FIGURE 4.6
THE TWO GRAPHS SHOW VISUALIZATIONS OF THE GAUSSIAN KERNEL USED TO BLUR AN IMAGE FOR THE UNSHARP MASKING PROCESS. ... 67
FIGURE 4.7
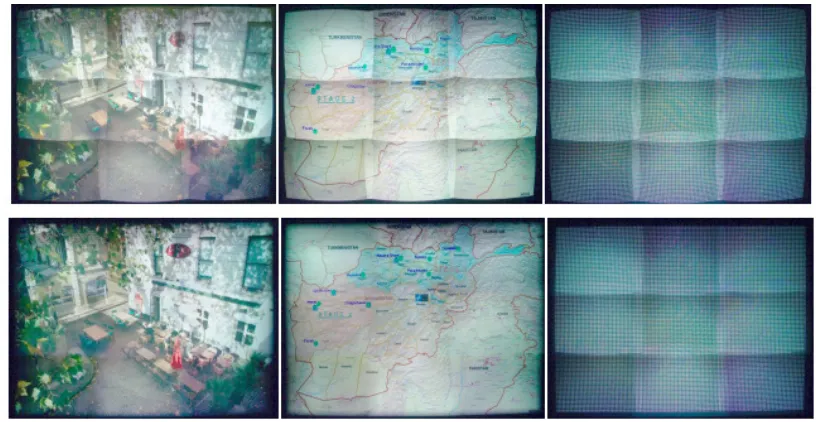
LUMINANCE/CONTRAST ENHANCEMENT – THE ORIGINAL AND ENHANCED VERSION OF THE IMAGE ARE COMPARED. THE IMAGES ARE SHOWN IN (A) AND (B), WHILE (C) AND (D) SHOW THE PANORAMIC DISPLAY SHOWING THESE IMAGES (AS CAPTURED BY THE DSLR). IN (E), A GRAY CHECKERBOARD PATTERN AS IT APPEARS ON A DISPLAY SEAM IS SHOWN ON THE LEFT AND THE ENHANCED VERSION OF THE PATTERN IS SHOWN ON THE RIGHT. ... 70
FIGURE 4.8
GEOMETRIC CORRECTION – THE ORIGINAL AND CORRECTED VERSION OF THE IMAGE ARE COMPARED. THE IMAGES ARE SHOWN IN (A) AND (B), WHILE (C) AND (D) SHOW THE
PANORAMIC DISPLAY SHOWING THESE IMAGES (AS CAPTURED BY THE DSLR). IN (E), A GRAY CHECKERBOARD PATTERN AS IT APPEARS ON A DISPLAY SEAM IS SHOWN ON THE LEFT AND THE CORRECTED VERSION OF THE PATTERN IS SHOWN ON THE RIGHT... 71
FIGURE 4.9
GEOMETRIC CORRECTION AND LUMINANCE/CONTRAST ENHANCEMENT – THE ORIGINAL AND ENHANCED/CORRECTED VERSION OF THE IMAGE ARE COMPARED. THE IMAGES ARE SHOWN IN
(A) AND (B), WHILE (C) AND (D) SHOW THE PANORAMIC DISPLAY SHOWING THESE IMAGES (AS CAPTURED BY THE DSLR). IN (E), A GRAY CHECKERBOARD PATTERN AS IT APPEARS ON A DISPLAY SEAM IS SHOWN ON THE LEFT AND THE ENHANCED/CORRECTED VERSION OF THE PATTERN IS SHOWN ON THE RIGHT. ... 72
FIGURE 4.10
SHARPENING USING COMMERCIAL SOFTWARE – THE ORIGINAL AND SHARPENED VERSION OF THE IMAGE ARE COMPARED. THE IMAGES ARE SHOWN IN (A) AND (B), WHILE (C) AND (D) SHOW THE PANORAMIC DISPLAY SHOWING THESE IMAGES (AS CAPTURED BY THE DSLR). .... 73
FIGURE 4.11
THE TEN ORIGINAL IMAGES USED IN THE EXPERIMENT AND THE IMAGE USED DURING THE TUTORIAL AND IN THE PRACTICE TRIAL ARE SHOWN. ... 74
FIGURE 4.12
AN OBSERVER INTERACTS WITH THE EXPERIMENTAL USER INTERFACE... 77
FIGURE 4.13
STIMULUS LAYOUT (CHARACTERS ARE NOT SHOWN TO SCALE.)... 78
FIGURE 4.14
A WIRELESS KEYBOARD WAS MODIFIED FOR USE IN THE DARK ROOM USED DURING THE EXPERIMENT. ... 78
FIGURE 4.15
THE MEAN PRICE AND 95% CONFIDENCE INTERVALS FOR THE TEN IMAGES... 84
FIGURE 4.16
FIGURE 4.17
THE MEAN PRICE AND 95% CONFIDENCE INTERVALS FOR THE 5 IMAGE PROCESSES... 85
FIGURE 4.18
THE MEAN PRICE AND 95% CONFIDENCE INTERVALS FOR THE FIFTY COMBINATIONS OF IMAGE AND IMAGE PROCESSING... 86
FIGURE 4.19
DETAILED EVALUATION OF THE INTERACTION OF IMAGE AND ALGORITHM... 88
FIGURE 5.1
SIMULATED MAGNIFICATION CHANGES ON A TEST IMAGE... 100
FIGURE 5.2
THE STRUCTURE OF A PIXEL IS SIMULATED USING 81 PIXELS (9 X 9 PIXELS)... 101
FIGURE 5.3
AN IMAGE WITH SIMULATED SUBPIXEL STRUCTURE APPEARS MUCH DARKER DUE TO THE SIMULATED BLACK MATRIX. A BRIGHTER BACKLIGHT WILL ACCOMMODATE FOR THE
DECREASED LUMINANCE. ... 101
L
IST OF
T
ABLES
TABLE 3.1
THE TOP RANKED WORDS AND GROUPS OF RELATED WORDS USED IN PARTICIPANTS’ RESPONSES TO WHAT THEY LIKED (LEFT) AND DISLIKED (RIGHT) ABOUT THEIR INITIAL INTRODUCTION TO THE DISPLAY ARE TABULATED ALONG WITH THEIR CORRESPONDING FREQUENCIES. ... 50
TABLE 3.2
THE TOP RANKED WORDS AND GROUPS OF RELATED WORDS USED IN PARTICIPANTS’ RESPONSES TO WHAT GOOD PROPERTIES (LEFT) AND WHAT BAD PROPERTIES (RIGHT) WERE PRESENT IN THEIR MORE CRITICAL EVALUATION OF THE DISPLAY ARE TABULATED ALONG WITH THEIR CORRESPONDING FREQUENCIES... 52
TABLE 3.3
THE TOP RANKED WORDS AND GROUPS OF RELATED WORDS USED IN PARTICIPANTS’ RESPONSES TO WHAT IS THE BEST PROPERTY OF THE DISPLAY (LEFT) AND WHAT THE DESIGNERS NEED TO IMPROVE THE MOST (RIGHT) ARE TABULATED ALONG WITH THEIR
CORRESPONDING FREQUENCIES. ... 53
TABLE 4.1
ANALYSIS OF VARIANCE FOR THE COST OF SECOND DISPLAY. THE LOW PROBABILITIES OF FOR THE F STATISTIC FOR ALGORITHM, EXPERTISE, AND THE INTERACTION OF IMAGE AND
EXPERTISE SUGGESTS AT LEAST ONE MEAN IN EACH OF THE SOURCES IS SIGNIFICANTLY DIFFERENT FROM THE REST, I.E. A MAIN EFFECT EXIST DUE TO THESE SOURCES... 82
1
I
NTRODUCTION
1.1 M
OTIVATION
Increasingly larger and higher resolution flat panel displays are now in demand
for scientific, business, and entertainment purposes. Investigators at research institutions
use such advanced displays to view scientific data such as medical images or satellite
imagery. These displays could also be used in businesses to view multiple graphs at the
same time, large amounts of data, or highly detailed graphical presentations. They could
also be used in conference rooms such that multiple participants can interact with the
display and each other. Consumers might even use these displays for simplified
computer multitasking or more immersive videogame experiences, once they become
more affordable.
Large area displays generally provide more information at a time to a larger
viewing audience; however, the production costs of larger displays do not scale linearly
with the increase in display size. Due to the high price of individual large area displays,
smaller displays have been tiled in order to construct a larger display. Such tiled displays
the two. The tiling process introduces seams between the individual displays that disrupt
visual continuity. Efforts have been made by many researchers in order to mitigate the
visibility of these discontinuities. Most of these efforts have addressed the seamlessness
issues present in projector systems. While projector systems have low initial cost, the cost
of maintenance can be far from viable.
Flat panel displays such as liquid crystal displays (LCD), plasma displays, and
electronic paper displays (e.g. E Ink Corporation’s electrophoretic displays) continue to
dominate the display market. The domination is partly due to the reliability of flat panel
displays, especially liquid crystal displays (LCD), for longer periods of time. These
displays also conveniently mount into tiled arrays. However, the resultant tiled display
systems are not seamless due to the bezels, bordering each display. The bezels disrupt
image content by either breaking the image into multiple pieces or by removing the
information that would be displayed on the bezels (similar to looking though a window).
Few efforts have been made to construct seamless tiled displays from flat panel, direct
view displays other than to reduce the bezel size or adding information onto the bezels
using projectors.
Corning Incorporated is developing a new approach to the seamlessness issues
caused by bezels. Rather than decrease the physical size of the bezel, they hide the bezels
by redirecting some of the image content from the displays over the bezels. This
approach is successful in masking the bezels, but image content is still not completely
seamless.
1.2 O
BJECTIVES
Corning Incorporated’s prototype seamless panorama display is a step toward a
cost effective and reliable method to create truly visually seamless tiled display systems.
The main goal of this work is to further develop the viability of this technology. To
accomplish this goal, two more focused objectives were developed: 1) to understand the
benefits and limitations of the technology, and 2) to preserve its benefits and increase its
appeal by overcoming its limitations.
The first objective was accomplished by conducting a carefully planned survey
where participants described their impressions of how well Corning Incorporated’s
prototype display represented various still image and video content. The results of this
survey were used to determine and rank the problems with the current technology. This
information provided the inspiration for developing algorithms to mitigate the top ranked
problems and accomplish the second goal. Finally, a psychophysical experiment was
used to determine whether the algorithms statistically improved the perceived visual
quality of the display.
1.3 T
HESIS
O
VERVIEW
Chapter 2 provides background information relevant to this thesis. This includes
an overview of tiled display systems, the efforts made to create visually seamless tiled
displays, and the aspects of the human visual system related to this research.
Chapters 3 and 4 cover the two projects conducted in this research. Chapter 3
covers the details of a survey conducted to determine the main strengths and weaknesses
of a prototype display as well as how this display might be best marketed. Chapter 4
the results of Chapter 3 and the methods used to evaluate the effectiveness of these
algorithms.
Lastly, Chapter 5 presents the conclusion, project contributions and future work.
2
B
ACKGROUND
For several decades, researchers developing tiled display systems have addressed
issues ranging from user interaction, display middleware, and synchronization to
geometric and colorimetric discontinuities near the display borders. This chapter begins
with a general overview of tiled display research and is followed by a more detailed
review of research addressing visual seamlessness in tiled display systems. Finally, some
of the characteristics of the human visual system relevant to this research are reviewed.
2.1 T
ILED
D
ISPLAY
S
YSTEMS
Tiled display systems are large, high resolution displays composed of smaller,
lower resolution displays and the computer hardware, software, and peripherals used to
control them as a single display. Leigh et al. describe many of the approaches and trends
used in middleware architecture, userinteraction design, and display hardware
construction of tiled display systems [Leigh et al. 2013].
2.1.1 T
ILEDD
ISPLAYM
IDDLEWARE
Middleware is the hardware or software used to interface between the graphics
display. This task has been approached differently by several different display
middleware packages, including Distributed Multihead X (DMX), scalable adaptive
graphics environment (SAGE), Chromium, Equalizer, CrossPlatform Cluster Graphics
Library (CGLX), and Deep Computing Visualization (DCV). Some packages are
window managers that allow users to run and interact with multiple applications
simultaneously, while others are parallel graphics rendering frameworks that allow an
application to maximize the use of the display system’s resolution. Some of these
middleware packages are limited to using OpenGL or X11 applications. Some packages
are also limited to use of a single server which limits scalability. Other differences
include how many users the middleware package allows to interact with display at a
single time and how much application code must be modified to be used by the package.
These major differences between these middleware packages are discussed in more detail
in [Leigh et al. 2013]
2.1.1.1 I
NPUT ANDI
NTERACTIONConventional input control systems become more cumbersome as display size
increases. Different interface peripherals are used to improve users’ interaction
experiences with the display system by providing more intuitive control. For example, a
mouse works well for a user when a display encompasses the user’s central vision and the
user is familiar with the graphical user interface (GUI) of the application, but displays
encompassing more and more of the user’s field of view become difficult to navigate
with a mouse, especially if the GUI is new to the user. Instead, middleware such as
SAGE have incorporated alternative interaction devices (e.g. Nintendo’s Wii Remote)
display navigation [http://www.sagecommons.org 2013]. To further avoid the frustration
of learning a new GUI, natural language queries might be used for voice control of the
display, similar to the Articulate’s methods used to translate natural language queries into
meaningful visualization [Sun et al. 2010]
Also, the scale of tiled displays lends itself well to collaboration and is by nature
less personal (the size of the display eliminates privacy). For these reasons, providing
desktop layout control system alternatives to conventional window managers enhances
the tiled display system experience. SAGE and other middleware solutions include
systems to partition tiled display systems for multiple user interaction (both vertical and
horizontal). Some middleware solutions, such as SAGE, also allow multiple device
interaction such that different users can use different input devices
[http://www.sagecommons.org 2013].
Tiled display systems generally perform better by incorporating different user
input peripherals for different interaction zones (see Figure 2.1), because drawbacks and
strengths exist for each pointing device. For example, a wireless mouse works well when
the user is seated at a desk located a reasonable distance from a display but becomes
extremely cumbersome when the user is standing a few feet away from the display
without access to a flat surface. Alternately, a pointing device such a the Nintendo Wii
FIGURE 2.1: Suitable modalities of interaction for four major interaction zones in front of
a scalable resolution display wall. Different interaction devices are more intuitive/useful based on the distance the user is from the display [from Leigh et al.2013]
2.1.1.2 V
IDEO ANDG
RAPHICSHardware for tiled display systems includes computer hardware, the constituent
displays, and any additional user interface peripherals and optical and imaging
components. The evolution of computer hardware, specifically advances in networking,
central processing units (CPU) and graphics processing units (GPU), has been essential in
the development of tiled display systems. Parallel rendering for realtime display of very
large, highresolution images over multiple displays required three major challenges to be
overcome: 1) coordination of CPUs and GPUs to consistently produce images in real
time, 2) communication among multiple CPUs and their GPUs, and 3) allocation of
[image:22.612.97.499.68.361.2]networking speeds and the advancements in parallelized processing in both CPUs and
GPUs have resulted in standalone computers that can control tiled display systems better
than the large supercomputers of the 1990s used to drive early tiled displays. The smaller
displays used to construct tiled displays could be various types of projectors (e.g. cathode
ray tube (CRT), liquid crystal displays (LCD), digital light projectors (DLP)) or flat panel
displays (e.g. flat panel LCDs, plasma displays, and electronic paper). Additional optics
and/or imaging components might be used to improve visual seamlessness. For example,
many tiled projector systems (like those discussed shortly) use cameras to measure the
distortions in a tiled display such that they can algorithmically correct the display output.
When selecting displays to construct a tiled display, some considerations include
1) the resolution of the displays, 2) the form factor, 3) initial cost, 4) maintenance cost, 5)
user interaction, 6) program scalability, 7) the ability to blend seams for image continuity
and text legibility. The next few sections will focus on several display systems designed
to be high total resolution, simple to setup, low cost, simple and inexpensive to maintain,
scalable, and visually seamless.
2.1.2 P
ROJECTORB
ASEDT
ILEDD
ISPLAYS
The early tiled displays developed in the 1990s were constructed from CRT
projectors, e.g. the CAVE [CruzNeira et al. 1993] and the Immersa Desk and Infinity
Wall [Czernuszenko et al. 1997, Kindratenko 2000]. Despite their relatively high
resolution and configurability, these projectors were eventually replaced by liquid crystal
display (LCD) and digital light processing (DLP) projectors because of their lower cost
and smaller size [Hereld et al. 2000]. Also, edgematched alignment of CRT projectors
difficult areas to converge [Schikore et al. 2000]. LCD and DLP projectors presented
other challenges such as color accuracy, color and geometric uniformity, highcontrast,
and frequent and expensive maintenance to name a few [Hereld et al. 2000, Leigh et al.
2013]. Various efforts have been made to address these issues. Stone identifies primary
color and brightness appearance problems with tiled displays, their causes, and possible
solutions [Stone 2001]. Such problems include seams, color balancing, and spatial
variation due to nonuniform illuminations, view dependent variation, and polarization
artifacts. A few examples of how some of these issues have been addressed are given
next.
2.1.2.1 A
CHIEVINGC
OLORU
NIFORMITYColor nonuniformity for display calibration is typically divided into luminance
(or brightness) and chrominance components (characterizing both the hue and chroma).
Brightness can vary spatially due to nonuniform illumination and nonuniform scattering
(caused by the directional optical properties of the projectors (e.g. vignetting) and
projection screen (e.g. screen gain). Additionally, bright seams form where adjacent
projectors overlap on the screen. Chrominance nonuniformity is usually the
consequence of gamut variation between projectors. Projectors can have different color
gamuts due to variations (such as age, manufacturing lot, component materials, etc) in
their light sources (bulbs), their color filters, and/or their digital processing schemes. For
example, the age of a tungsten bulb changes its spectral power distribution and color
filters composed of different materials generally have different spectral transmittance.
Often luminance nonuniformity is much more objectionable than chrominance
nonuniformities. Color nonuniformity can be measured both within a single display
and between constituent displays of a tiled display system, e.g. using an imaging
colorimeter, spot measuring with a colorimeter or spectrophotometer, or using a
calibrated camera as an imaging colorimeter. Photometric calibration can be used to
create color uniform displays by algorithmically restricting the output of display pixels to
the common gamut of all the display pixels (i.e. the maximum output of all pixels is
restricted to the maximum output of the dimmest pixel set to white and the minimum
output of all pixels is restricted to minimum output of the brightest pixel set to black);
however, perceived color uniformity can be achieved without complete photometric
uniformity and offers some benefits over absolute photometric seamlessness, e.g. the
overall display brightness can be significantly higher than what is required for absolute
photometric seamlessness. Examples of photometric calibration, both complete and
relaxed (to retain brightness and contrast) are described in more detail next.
Majumder and Stevens [2004] found that luminance varies significantly within
individual projectors and across multiple projectors while chrominance is relatively
uniform, especially between projectors of the same model. As a result, they developed a
luminance matching method to create photometrically uniform displays. Specifically,
their method used a camera to measure and map the luminance response (for each color
channel) of a multiprojector display system. The luminance output can be made uniform
by weighting each pixel such that the luminance response of each pixel is scaled to the
pixel with the most limited luminance response. The first step is to perform a one time
luminance output with input signal at a given pixel location) using a luminance calibrated
camera. The measured response is then used to determine the common achievable
response and to ultimately generate an attenuation map to transform the measured
response to the common achievable response. The second step is to determine what part
of an image is to be displayed at a given pixel location and multiply it by the attenuation
map. This technique can be used for both individual and tiled display systems. The
algorithm performs two tasks: 1) it sets the maximum output of every pixel to the
luminance of the dimmest pixel when all pixels are set to white and 2) it sets the
minimum output of every pixel to the luminance of the brightest pixel when all pixels are
set to black. The results of their algorithm are shown in Figure 2.2 for three images
projected by a 2 x 2 array of four projectors. The top row shows the images before image
correction while the bottom row shows the images after implementing their luminance
matching algorithm. Color uniformity is improved but at the cost of overall brightness,
dynamic range, and therefore contrast.
FIGURE 2.2: The top row shows images before correction and the bottom row shows the
[image:26.612.92.519.458.652.2]Unsatisfied with the drastic reduction of contrast and dynamic range of their initial algorithm, Majumder and Stevens [2005] developed a new algorithm inspired by the perceptual uniformity of individual displays. Normal projectors and flat panel LCDs are not typically photometrically uniform, yet they appear visually uniform. This concept led to an algorithm designed to smooth photometric discontinuities enough to be perceptually seamless while minimizing the reduction in dynamic range and contrast. They developed a gradient based smoothing algorithm with a smoothing parameter, λ. This smoothing parameter is derived from the human contrast sensitivity function. The number of display pixels subtended per degree of the eye is given by 180 r dπ
, where d is
the perpendicular distance between the display and the eye, and r is the resolution in
pixels per distance. For the maximum contrast sensitivity, at about 5 cycles per degree of angle subtended on the eye, the number of display pixels per sinusoidal period is 5 180× r dπ . The smoothing parameter is the number of display pixel per period divided by the
contrast threshold, τ, that humans can tolerate per degree of visual angle (1% at peak
sensitivity): τ π τ π λ 900 5 180 r d r d = × ×
= (Eq. 2.1)
Again, the luminance response is measured, but the attenuation map alone does not
constrain pixels to the common achievable response. Instead the optimized display
luminance function is constrained three ways: 1) the output at a pixel location cannot
exceed the maximum achievable luminance, 2) maximize the dynamic range by
quotient of the display luminance function and the smoothing parameter, λ, to be greater
than the derivative of the display luminance function (the parameter is used to create
smooth variation imperceptible to humans). The smoothing parameter is adjusted to find
the best tradeoff in perceptual uniformity and brightness/dynamic range. As the
smoothing parameter increases, the photometric uniformity increases while the contrast
and dynamic range decreases. When this parameter is set to infinity, the special case of
total photometric uniformity is achieved. An example of the application of the algorithm
using different values of the smoothing parameter is shown in Figure 2.3.
FIGURE 2.3: Results of Majumder and Stevens perceptual photometric calibration
algorithm on a 3 x 5 array of fifteen projectors. The display system before any correction (top left). The result of applying the algorithm with the smoothing parameter set to 400 (bottom left). The result of applying the algorithm with the smoothing parameter set to 800 (top right). The result of photometric uniformity, i.e. applying the algorithm with the smoothing parameter set to infinity (bottom right). The peak luminance drops as the uniformity constraint is made more stringent, i.e as the smoothing parameter increases [from Majumder and Stevens 2005]
A major disadvantage of both the photometric and perceptually photometric
seamlessness algorithms is the requirement of a photometrically calibrated camera which
[image:28.612.92.508.293.494.2]Majumder [2007] addressed this problem by developing a photometric selfcalibration
technique for a projectorcamera pair. They used an uncalibrated camera (unknown
intensity transfer function) to both extract the projector photometric parameters and
recover the camera’s intensity transfer function. The camera captured images of the
projector/screen system at multiple exposure times and projector intensity levels. Then
the captured images, along with the corresponding known exposure times and projector
intensity levels, are used to construct a linear set of equations. The solution to the
equations yields the projector’s transfer function, the camera’s transfer function, and the
spatially dependent attenuation factor due to the projector lens and the display screen.
2.1.2.2 A
CHIEVINGG
EOMETRICS
EAMLESSNESSIn addition to the color issues, tiled projector systems also require geometric
alignment. Images produced from a projector would ideally form a perfect rectangle with
uniformly distributed pixels and therefore no geometric distortion. In this case, the only
requirement to produce a geometrically seamless display would be to position the
projector vertically and horizontally such that the images produced from adjacent
projectors just meet and are aligned. This assumes the projector’s optical axis is
perpendicular to the planar screen. If this is not the case, an oblique projection occurs
instead of an orthogonal projection. Areas of the screen closer to the projector will have
smaller pixels than areas of the screen farther from the projector. The resultant
trapezoidal image (resembling the keystone of an arch) is characterized by parallel lines
appearing skewed [Raskar 2000].
Real projectors not only suffer from projective distortions, but also from radial
magnification with increasing distance from the optical axis (radial distortion), resulting
in images exhibiting barrel distortion (decreasing magnification with distance from the
optical axis) or pincushion distortion (increasing magnification with distance from the
optical axis) [Pedrotti el al. 2007]. Tangential distortion, or image decentering, occurs
when the optical lens centers are not in the same line [RicolfeViala and Sanchez
Salmeron 2010].
Without tedious physical alignment of the projectors, geometric distortions occur,
e.g. keystoning and magnification differences. Still, no amount of physical alignment can
correct for the radial and tangential distortions, such as pincushion, caused by the lenses
in a projector system.
Raskar et al. [1999] and Raskar [2000] present methods to achieve geometric
calibration of projectorbased displays constructed from a collection of casuallyarranged
projectors and display surfaces. The techniques presented use cameras to recover the
display surface and the geometries of the projectors instead of requiring geometric
constraints to the display setup. The display surface and the projector geometries are
used for geometric registration to create seamless imagery for a variety of geometric
configuration. The techniques also include support for irregular display surfaces and
headtracked moving viewers. Additionally, they contributed improved rendering
efficiencies for special cases such as a static user or planar display surfaces and methods
to selfconfigure display and projector geometries.
Geometric alignment was also addressed by [Bhasker, Juang, and Majumder
2007]. They present a technique to achieve geometric alignment in the presence of
patches, the technique applies a closedform model that relates the projectors in a planar
multiprojector display to cameras. The projector lens distortion is modeled by an affine
invariant nonrational Bezier patch. Then the projector, camera, and screen are related
linearly via a homography. A perspectiveinvariant rational Bezier patch models the
combination of these nonlinear and linear functions such that the different distortions
(keystoning, radial, and tangential distortions) are contained within a single closedform
function. They estimate a function that maps the projector coordinates to the camera
coordinates using a rational Bezier patch. Then a second function maps the camera
coordinates to the normalized screen coordinates. A homography can be used because
they use a planar screen. The resultant Bezier function is sparsely sampled to estimate
the function parameters which are used to warp the input image to the projector such that
[image:31.612.104.512.429.640.2]image on the screen is geometrically aligned. The results of the algorithm are shown in
Figure 2.4.
FIGURE 2.4: The result of geometric registration on a 3 x 3 array of nine projectors. The
2.1.3 F
LATP
ANELT
ILEDD
ISPLAYS
YSTEMSDespite the low initial cost and the development of effective geometric and
photometric calibration techniques for LCD and DLP projectors, the high maintenance
costs (especially frequent bulb replacement) and their large footprint made them
impractical for longterm use. As a result, flat panel displays have become more popular
for tiled display systems, especially LCDs. LCDs not only perform well for tens of
thousands of hours, they are easily mounted into tiled arrays and are also generally easily
aligned geometrically and photometrically (for a single viewing position).
The main disadvantages of LCDs and other flat panel displays are the bezels that
frame each panel and directionality of the displays. LCDs not only change in luminance
with viewing angle, but also chromaticity [Cheng 2007]. This poses a problem for large
displays where the viewing angle is large near the edges of the display or for displays
viewed simultaneously by several people from different positions. Bezels in tiled flat
panel display systems break up image content and can be especially disruptive to image
content like text, lines, or familiar shapes that span multiple displays. Several examples
of flat panel display tiling are described next.
2.1.3.1 S
INGLES
CREENF
LATP
ANELT
ILEDD
ISPLAYSDuring the early development of LCDs, manufacturing techniques limited LCD
production to relatively small displays by today’s standards. Several techniques were
developed to create large area displays using seamless tiling of smaller panels. For
optics to magnify each panel into the imaging plane. The design used modified Fresnel
lenses; the apex of the Fresnel lens was planarized (the peaks were flattened) such that a
black mask could be applied to prevent ghosting. The design modification is shown
below in Figure 2.5. Figure 2.5ab shows the top view and a segmented side view of a
Fresnel lens (not to scale). A portion of the segmented side view is magnified and shows
the optical path from the LCD source to the image plane in Figure 2.5c. Notice the sharp
apex. The path of light used to produce a regular image is shown in blue. Due to
reflections within the lens, some light will reach the intended position on the image plane
while some of the light will produce a ghost image at another position. This is illustrated
by the two light paths shown in red. The paths that end with a letter ‘R’ are optical paths
producing regular images, while the path ending with the letter ‘G’ is an optical path
producing a ghost image. Finally, the modification of the Fresnel lens is shown in Figure
2.5d. Instead of the normal apex shown Figure 2.5c, the apex has been removed/
planarized and a mask has been applied. This mask blocks the path of light that would
produce the ghost image. Other techniques for seamless tiling of smaller flat panels
using mechanical processes are described in [Greene et al. 2000, Krusius et al. 2002,
Raman et al. 2004, and Terada et al. 2003]. All of these techniques are for tiling small
panels into a single display, i.e. the constituent panels are not standalone displays and the
manufacturing processes require a very small gap between panels to eliminate visibility
a) Top view of a Fresnel lens
b) Segmented side view of a Fresnel Lens
LCD Panel
Image Plane Fresnel Lens
R
G R
Normal Apex
LCD Panel
Image Plane Modified Fresnel Lens
R
Black Mask Planarized Apex
c) Detail views of a Fresnel lens and the modified Fresnel lens used by Fukuhara et al.
FIGURE 2.5: The design of LCD flat panel tiling system developed by Fukuhara et al.
1995 is compared with a general Fresnel lens. The top view of a Fresnel lens is shown in a and segmented side view is shown in b. A portion of the segmented view is magnified in c. Notice the sharp apex. Also, a LCD panel is shown as a light source and optical paths are illustrated to show how ghost images are formed by a regular Fresnel lens. The optical path shown in blue produces a regular image, R. The paths shown in red produce both a regular image, R, and a ghost image caused by reflection within the lens, G. Finally, the modification of the lens is shown in d. The apex has been planarized (flattened). The applied black mask then blocks the optical path of the ghost image.
2.1.3.2 P
ANORAMICF
LATP
ANELT
ILEDD
ISPLAYSA number of flat panel tiled display systems have been created, but few have
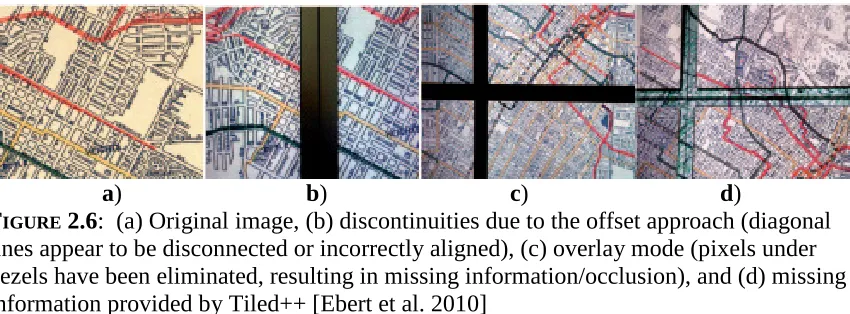
addressed the occlusions, breaks, or other discontinues caused by bezels. Ebert et al.
[2010] propose one solution called Tiled++. Tiled++ uses a system of flat panel displays
and projectors. A tiled display wall is first constructed of flat panel LCDs and then the
missing information that is occluded by the bezels is projected onto the bezels. The result
of this technique and comparisons to the original content, an offset approach, and an
overlay approach are given in Figure 2.6. While information is recovered in Tiled++, the
color is not uniform between the displays and the bezels and the projectors cast the
shadows of the bezels onto the LCDs.
a) b) c) d)
FIGURE 2.6: (a) Original image, (b) discontinuities due to the offset approach (diagonal
lines appear to be disconnected or incorrectly aligned), (c) overlay mode (pixels under bezels have been eliminated, resulting in missing information/occlusion), and (d) missing information provided by Tiled++ [Ebert et al. 2010]
Display manufacturers have approached the bezel problem by creating ultrathin
display bezels. In 2009, manufacturers such as NEC, Sharp, and Samsung introduced
LCD panels with bezel widths of about 2.53 mm per side. These displays permit less
objectionable disruptions in image content between displays at a significant increase in
display cost. While the bezels are less distracting, they still break up the image content
[image:35.612.96.521.351.508.2]2.2 C
HARACTERISTICS OF THE
H
UMAN
V
ISUAL
S
YSTEM
The human visual system (HVS) has characteristics which are utilized extensively
in visual media processing, encoding, and display design. This section discusses some of
these characteristics and examples of how they have been practically incorporated into
designs.
Display resolution is one of the major selling points of new televisions, computer
monitors, and other consumer displays. Standards resolutions only give the number of
active pixels the display contains and whether the signal is interlaced or not, e.g. 1080I
means that a monitor has a resolution of 1920 pixels wide by 1080 pixels tall, but the
images are interlaced. Resolution alone does not determine whether an image will appear
smooth or pixilated. A more useful quantity is dots per inch (DPI). This can be
calculated from the resolution and screen size. DPI and viewing distance can then be
used to calculate the number of pixels per visual angle (the number of pixels per degree
on the retina). This rate can be used to determine whether individual pixels in a display
can be resolved by the human eye. The number of pixels per visual angle is needed
because the limiting factor of visual resolution is generally the photoreceptor (cone)
spacing on the retina. Williams 1988 estimated typical cone spacing in the retina to range
from a peak of about 0.535 minutes of arc at the center of the fovea to about 1.233
minutes of arc at 1.75 degrees from the center of the fovea. This corresponds to about
112 cones per degree as the minimum cone spacing and suggests that the maximum
visual resolution is Nyquist limited to about 56 cycles per degree. Therefore this
suggests displays with more than about 120 pixels per degree will not appear blurred or
The visual resolution Nyquist limit only estimates the cutoff frequency that can be
detected by the fovea. Psychophysical studies have been used to determine the range of
frequencies to which the HVS is sensitive and how much contrast is necessary to detect
these frequencies. Spatial contrast sensitivity is the inverse of the contrast threshold
required for the HVS to detect a frequency. Typical luminance and chromatic contrast
sensitivity functions are shown in Figure 2.7. For luminance, the human contrast
sensitivity function (CSF) increases with spatial frequency until about 5 cycles per
degree. Then contrast sensitivity decreases until about 60 cycles per degree; this closely
agrees with the estimated limit predicted from the measured fovea cone spacing. Because
the sensitivity is low at higher frequencies, the number of pixels per visual angle needed
to create a smooth image can be reduced. This idea can be applied to lower contrast
displays and prints.
FIGURE 2.7: Typical spatial contrast sensitivity functions for luminance and chromatic
[image:37.612.89.522.402.643.2]The decreasing sensitivity of the luminance CSF at low frequencies supports the
concept that the HVS has retinal and cortical mechanisms that are well adapted to
detecting sharp luminance discontinuities but not more gradual transitions [Palmer 1999,
Chapter 4]. This concept is used in the perceptually seamless tiled display of Majumder
and Stevens [2005] previously described. The edges created by sudden changes in
luminance are mitigated by smoothing these edges into gradual luminance changes. This
allowed their tiled projector system to display perceptually seamless images without
reducing the dynamic range as significantly as when complete photometric display
calibration is performed.
Additionally, the chromatic CSFs show a much lower cutoff in spatial frequency
(see Figure 2.7) [Murching and Woods 1994]. This property of the color contrast
sensitivity functions is often used in image compression and coding in order to reduce file
size and data transfer rates. For example, image and video compression standards such as
JPEG and MPEG utilize a luminancechrominance domain. Because the human visual
system is less sensitive to chromatic contrast, the chrominance channels are sampled at a
lower frequency than the luminance channel. Murching and Woods go a step further by
proposing an adaptive method of subsampling the chrominance channels based on local
high frequency energy content.
Contrast sensitivity is also affected temporally. Figure 2.8 shows typical temporal
CSF for luminance and chromatic contrast. Similar to the spatial CSF, the temporal
luminance CSF has a higher cutoff frequency and a generally higher sensitivity than the
chromatic temporal CSF. Also, the bandpass nature of the temporal luminance CSF
FIGURE 2.8: Typical temporal contrast sensitivity functions for luminance and chromatic
contrast [from Fairchild 2005]
Daly expanded a spatiovelocity CSF model to include eyemovements
(specifically natural drift, smooth pursuit, and saccadic) [Daly 1998]. This investigation
was used to compare different television TV formats (interlace and progressive scan
formats of different resolutions and refresh rates). The model helped to understand the
tradeoff between blur and flicker at different viewing distances. For example, a 780I TV
at 60 fields/sec will perform better than a 1080P TV at 30 frames/sec when viewed at
farther distances (six times the height), while the 1080P will outperform the 780I TV at
closer distances (three time the height).
Contrast sensitivity measurements are obtained from observers viewing sinusoidal
targets; however, the HVS can perceive misalignments at higher angular frequencies than
modeled by the luminance CSF via the phenomenon of hyperacuity. Hyperacuity is the
human visual system’s ability to resolve spatial distinctions at a finer scale than the limits
[Westheimer 1975]. Theory suggests that complex parallel processing of photoreceptors
allow this phenomenon to occur. Westheimer and McKee [1977] determined the limit of
visual hyperacuity in terms of both spacing on the fovea and the conditions of the stimuli.
They concluded that the HVS is capable of spatial discrimination of only a few seconds
of arc and this is the lower limit of the relative localization of two feature components.
This suggests that very small misalignments between two features (e.g. lines, dots, and
other separate and individual features) can be detected via hyperacuity and therefore
hyperacuity places a stipulation on how well displays must align for visual seamlessness
for certain image content, especially text. Westheimer and McKee also measured the
maximum retinal velocities (deg/s) of the Landolt C and vernier targets that still permit
the same visual acuity as stationary targets for vertical, horizontal, and oblique
movement. They concluded that stationary objects are not prerequisite for good acuity.
Text on a LCD display can appear jagged when the offset between pixels is
greater than the hyperacuity threshold. To mitigate the appearance of the jagged edges,
researchers at Microsoft developed ClearType™. ClearType improves the readability of
fonts on displays containing a repeating pattern of addressable colored subpixels, i.e.
subpixels are manipulated to effectively increase the resolution of the display. This is
accomplished by their RGB decimation filtering method [Platt 2000, Betrisey et al.
2000]. The method starts by prefiltering each color channel of the multicolor input
image. For each color channel, the filtered color image is then sampled at the spatial
positions of the subpixels with the corresponding color. This strategy avoids the phase
error of standard antialiasing methods that blur the image. Figure 2.9 illustrates the
ClearType’s filtering. Each rectangle represents the luminance of a red, green, or blue
subpixel. The unfiltered image exhibits jaggies while the antialiased filtered image sets
all three subpixels within a pixel to the same luminance, resulting in a blocky and
smeared appearance. Finally, the text after RGB decimation appears much smoother.
FIGURE 2.9: The comparison of unfiltered text (left), text after standard antialiasing
filtering, and text after ClearType’s RGB decimation (right) [from Betrisey et al. 2000].
Deshpande and Daly [2010] also studied hyperacuity in order to determine
synchronization threshold for ultra high resolution tiled displays presenting moving
images. An experiment was designed to obtain the synchronization mismatch acuity
threshold as a function of both object velocity and occlusion width (separation due the
bezel width). This threshold relates to distributed synchronization algorithms used to
display parts of an overall image on constituent panels of tiled display systems. They
found that perception of synchronization mismatch decreased with increasing bezel width
and increasing object velocity. They also developed a method for perceptual evaluation
of visual quality of natural video when synchronization mismatch is present in tiled
display systems with and without bezel separation. This experiment also showed that
more lax synchronization can be used in tiled display systems with bezels than systems
without bezels.
2.2.1 R
ELATIONS TOT
ILEDD
ISPLAYS
YSTEMS
Tiling displays creates larger, higher resolution displays but also introduces visual
Researchers have created displays that address these issues by considering the
performance of the HVS. By understanding some of the basic properties of the HVS and
utilizing opinions from human observers, imaging systems (including displays) can and
have been significantly improved. For this reason, we designed and conducted a visual
survey utilizing a prototype panoramic tiled display system to understand its current
strengths and weaknesses via human observations. The results were then used to develop
strategies to improve the display system with limited impact to its current strengths. This
survey and its results are described in the next chapter.
3
P
ANORAMA
D
ISPLAY
S
URVEY
3.1
O
BJECTIVES
The goal of the work described in this thesis is to further develop the viability of
Corning Incorporated’s seamless display tiling system by 1) understanding the benefits
and limitations of the technology, and 2) preserving its benefits and increasing its appeal
by overcoming its limitations. To understand the benefits and limitations, a survey was
designed and conducted with two objectives in mind. The primary objective was to
determine and rank the perceived strengths and weaknesses of a prototype panoramic
display. Ranked results were then used to identify the most important problems to
mitigate. A secondary goal was to determine both the size and the arrangement that this
seamless tiled display technology would best be marketed, e.g. whether a desktop sized
or a TV sized display is more desirable. Participants’ judgments of the seamless display
tiling system were formed after viewing stimuli on the physical setup described next.
3.2 P
HYSICAL
S
ETUP
A prototype panorama display was constructed from three 46 inch, 1080p displays
each fitted with a custom optical cover glass developed by Corning Incorporated. The
optical properties of the cover glass were designed to hide the display’s bezels by
projecting image content over them. The displays were mounted to a custom stand that
allowed viewing angle as well as the vertical and horizontal position of the displays to be
adjusted. The left and right displays were angled inward about 30 degrees. After the
panels were roughly aligned angularly and horizontally on the stand, the displays were
then aligned vertically to each other by adjusting the height of each display such that
horizontal lines appear continuous from the viewing position. The viewing position was
determined to be the intersection of the normal vectors of the center of each panel.
Finally, the optical hardware was finely adjusted mechanically such that image content
appeared as continuous as possible while minimizing the number of distorted or missing
pixels at the seams.
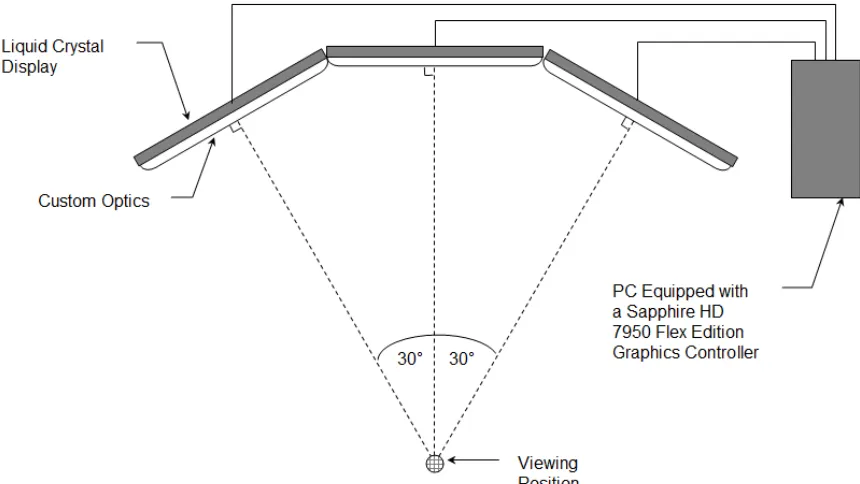
A schematic is shown in Figure 3.1. The system was controlled using a computer
1) equipped with a Sapphire HD 7950 flex edition graphics controller, and 2) running
AMD EyeFinity 2.0 and Window 7. EyeFinity is middleware that allows the individual
displays to be grouped as a single display rather than as three separate displays
FIGURE 3.1: Schematic of the panorama display setup.
3.3 S
URVEY
D
ESIGN
The verbal survey was divided into six sections. The information provided to the�
![FIGUREa scalable resolution display wall. Different interaction devices are more intuitive/useful 2.1: Suitable modalities of interaction for four major interaction zones in front of based on the distance the user is from the display [from Leigh et al.2013]](https://thumb-us.123doks.com/thumbv2/123dok_us/42045.3636/22.612.97.499.68.361/resolution-different-interaction-intuitive-suitable-modalities-interaction-interaction.webp)
![FIGURE 2.2: The top row shows images before correction and the bottom row shows the images after luminance matching for a 2 x 2 array of four projectors [from Majumder and Stevens 2004]](https://thumb-us.123doks.com/thumbv2/123dok_us/42045.3636/26.612.92.519.458.652/figure-correction-images-luminance-matching-projectors-majumder-stevens.webp)
![FIGURE 2.3: Results of Majumder and Stevens perceptual photometric calibration algorithm on a 3 x 5 array of fifteen projectors. The display system before any correction (top left). The result of applying the algorithm with the smoothing parameter set to 400 (bottom left). The result of applying the algorithm with the smoothing parameter set to 800 (top right). The result of photometric uniformity, i.e. applying the algorithm with the smoothing parameter set to infinity (bottom right). The peak luminance drops as the uniformity constraint is made more stringent, i.e as the smoothing parameter increases [from Majumder and Stevens 2005]](https://thumb-us.123doks.com/thumbv2/123dok_us/42045.3636/28.612.92.508.293.494/perceptual-photometric-calibration-projectors-correction-photometric-uniformity-constraint.webp)
![FIGURE 2.7: Typical spatial contrast sensitivity functions for luminance and chromatic contrast [from Fairchild 2005]](https://thumb-us.123doks.com/thumbv2/123dok_us/42045.3636/37.612.89.522.402.643/typical-contrast-sensitivity-functions-luminance-chromatic-contrast-fairchild.webp)