City, University of London Institutional Repository
Citation
:
Nadimi, S. and Fonseca, J. ORCID: 0000-0002-7654-6005 (2019). Image based
simulation of one-dimensional compression tests on carbonate sand. Meccanica, 54(4-5),
pp. 697-706. doi: 10.1007/s11012-018-0923-2
This is the published version of the paper.
This version of the publication may differ from the final published
version.
Permanent repository link:
http://openaccess.city.ac.uk/id/eprint/21038/
Link to published version
:
https://doi.org/10.1007/s11012-018-0923-2
Copyright and reuse:
City Research Online aims to make research
outputs of City, University of London available to a wider audience.
Copyright and Moral Rights remain with the author(s) and/or copyright
holders. URLs from City Research Online may be freely distributed and
linked to.
P R O G R E S S I N M E C H A N I C S O F S O I L S A N D G E N E R A L G R A N U L A R F L O W S
Image based simulation of one-dimensional compression
tests on carbonate sand
Sadegh Nadimi .Joana Fonseca
Received: 17 May 2018 / Accepted: 16 November 2018
ÓThe Author(s) 2018
Abstract High factors of safety and conservative methods are commonly used on foundation design on shelly carbonate soils. A better understanding of the behavior of this material is, thus, critical for more sustainable approaches for the design of a number of offshore structures and submarine pipelines. In par-ticular, understanding the physical phenomena taking place at the microscale has the potential to spur the development of robust computational methods. In this study, a one-dimensional compression test was per-formed inside an X-ray scanner to obtain 3D images of the evolving internal structure of a shelly carbonate sand. A preliminary inspection of the images through five loading increments has shown that the grains rearrange under loading and in some cases cracks develop at the contacts. In order to replicate of the experiments in the numerical domain, the 3D image of the soil prior to loading was imported into a micro Finite Element (lFE) framework. This image-based modelling tool enables measurements of the contact force and stress map inside the grains while making use of the real microstructure of the soil. The potential
of the lFE model to contribute insights into yield initiation within the grain is demonstrated here. This is of particular interest to better understand the breakage of shelly grains underpinning their highly compressive behavior.
Keywords Micro finite elementCarbonate sands
Numerical modellingX-ray tomography
1 Introduction
Carbonate soils cover over 40% of the world’s seabed, where offshore structures, pipelines, artificial islands and other marine structures are founded. For the most part, carbonate soils are of biogenic origin comprising skeleton bodies and shells of small organisms, the shelly carbonate sands [1–3]. These soils are a complex and poorly understood material, in particular the high compressibility of the material is not well predicted using current modelling techniques. As a consequence, shelly sands have been placed into a niche classification of ‘‘problematic soils’’ in most design guides [4,5]. While failures are now relatively rare, conservative methods and high factors of safety are commonly used. Understanding the behavior of shelly carbonate sand is critical for the design of foundations for offshore structures. In particular, understanding the physical phenomena taking place
S. Nadimi (&)
School of Mechanical Engineering, University of Leeds, Leeds LS2 9JT, UK
e-mail: [email protected] J. Fonseca
Department of Civil Engineering, City, University of London, London EC1V 0HB, UK
e-mail: [email protected] Meccanica
at the microscale has the potential to spur the development of robust computational methods.
Shelly carbonate sands differ considerably from more commonly studied silica sands. An important distinction is the composition; carbonate soils are rich in calcium carbonate which has a much lower hardness value when compared to quartz. But composition plays only a part in explaining the less conventional behavior of shelly sands. A significant characteristic of shelly sands is the shape of the constituent grains, comprising a mixture of plate-like and hollow bulky shaped grains both characterized by high angularity values. Despite the variety of grain morphologies found in carbonate sands, typical shapes can often be associated to a finite number of species in a given sediment [6].
The significance of grain shape dependent behavior is widely reported in the literature. Santamarina and Cho in [7] have shown that while smooth grains are prone to contact slippage, angular shapes tend to intensify particle deformation at contacts. The shape contribution to the macro response derives from the arrangement of the grains and the grains interaction. Earlier studies have used thin sections to quantify the shape of shelly grains [8]. More recent work using X-ray micro computed tomography (lCT) images and advanced image processing tools [9] has enabled the quantification of the morphology of shelly carbonate sands in three-dimensions (3D) and paved the way to discrete modelling of the material.
This study makes use of a recent developed micro Finite Element (lFE) model [10,11]. The model takes as input the geometrical grain-scale data obtained from lCT to model the individual grains and their interactions in the framework of combined discrete-finite-element method [12, 13]. The soil fabric is therefore virtualized by meshing the constituent grains and allowing them to interact and deform according to appropriate constitutive model and frictional contact conditions. The contact response results from the deformation of contacting bodies, which accounts for the specificities of each contact surface. The rational is that using a true representation of the internal structure of the material and deformable grains will enable a more realistic representation of the physics of granular behavior.
A small sample of a shelly sand imaged during oedometer compression is used in this study to (1) obtain the microstructure to be translated into a
numerical sample and (2) validate the numerical simulation by comparison against the experimental macroscopic behavior. The present paper comprises a brief description of the material and the experiments, followed by the numerical framework used, including the formulations for body motion, body deformation and contact algorithm. Particular emphasis is given to the numerical meshing of the shelly grains. The analysis and discussion of the results from the simulation are presented together with future direc-tions of research.
2 Material and experiments
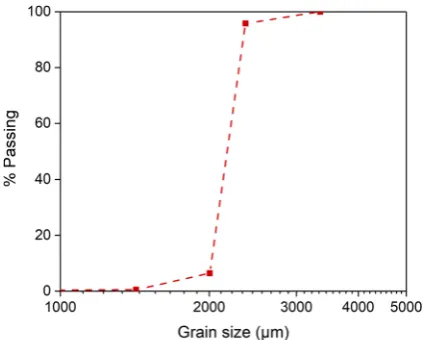
The material investigated was a shelly carbonate sand from the Persian Gulf with a median grain size of approximately 2.2 mm, the particle size distribution is presented in Fig.1. This sand comprises a mixture of plate-like and hollow bulk shapes with high angularity features [9]. The enclosed voids within the grains were quantified using the intra-granular void ratio param-eter (ratio between the volume of the internal void and the volume of solid) and a value of 0.095 was obtained. This corresponds to an intra-granular porosity of 8.67%. The tensile strength of these shelly grains was investigated by means of single compression tests [14] and it has been observed a wide range of normal force:displacement responses, which was attributed to the large variety of grain shape associated with biogenic origin of the constituent grains.
Fig. 1 Particle size distribution of the shelly sand investigated
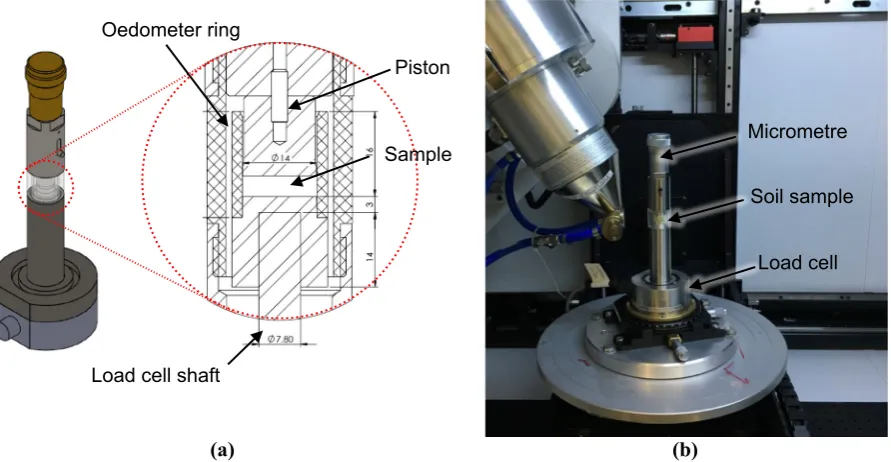
[image:3.547.286.498.466.636.2]The one-dimensional compression tests were per-formed under dry conditions inside an X-ray scanner. The system used was a Nikon XTH 225 ST located at the Research Centre at Harwell (RCaH), Oxfordshire (UK). The experimental set-up consisted of a load cell, a vertical piston a micrometer and a small oedometer, as shown in Fig.2. The set-up was designed for this particular scanner and was mounted on the rotating table of the scanner. The size of the specimen was 13.5 mm in diameter with an aspect ratio (height/di-ameter) between 1.0 and 1.1. The force was exerted by a micrometer with 450 N axial loading capacity [15]. The sample container was made of Perspex with 2 mm thickness for which a value of less than 3lm deflection under the maximum applied force was measured. The lateral friction has been minimized by considering a 1 mm gap between the container and the X-ray window. The exerted force was monitored by a low profile ‘pancake type’ load cell with a 500 N capacity. The X-ray tomography data was acquired at an accelerating voltage of 90 keV. A total of 3142 projec-tions were collected per scan, with an exposure of 500 ms per projection. The 3D images acquired had a resolution of 9.5lm (length of voxel edge). In an X-ray scanning, the objects within the sample attenuate different levels of X-ray beam energy, depending on the material composition and density. Denser materials
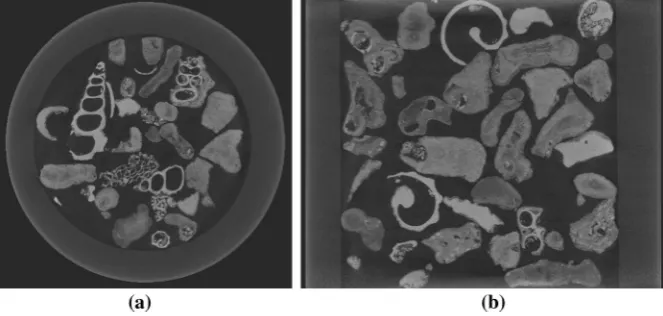
attenuate more than less dense materials and this difference in attenuation is represented by the intensity values of the voxels (3D pixels). The contrast of intensity level allows for differentiation of the features within the image. The scanned images have the dimensions of 15369153691600 voxels. The large variety of sizes and shapes and the contrasting colors defining different grains can be seen in the top and side views cut through the experimental sample, shown in Fig.3.
The experimental test was performed at five loading stages up to a maximum 10% axial strain. In-house imaging processing codes were employed to segment the images in order to identify the individual grains. This includes firstly to binaries the images using Otsu’s thresholding and subsequently apply an itera-tive watershed algorithm to overcome the challenges posed by the large diversity and complexity of the shapes associated with the biogenic nature of shelly sands. The codes are fully described by Kong and Fonseca [9].
3 The numerical framework
In the framework of combined finite-discrete-element method, grain deformability can be described by a finite-element method formulation, whereas the
(a) (b)
Load cell shaft
Sample Piston Oedometer ring
Micrometre
Soil sample
[image:4.547.53.499.415.646.2]Load cell
Fig. 2 aSchematic of the apparatus used to perform one-dimension compression tests andbview of the sample inside thelCT scanner
motion of the individual grains and contact detection are presented using DEM principles. The numerical model is implemented with an explicit algorithm. The governing equations for body motion, body deforma-tion and contact detecdeforma-tion are summarized as follows.
3.1 Body motion
The explicit dynamic analysis is established on the implementation of explicit integration and the use of diagonal mass matrices. The acceleration (u€) is calculated based on Newton’s second law. The equations of motion are integrated throughout time (t) using an explicit central difference integration rule:
_
uðiþ1=2Þ¼u_ði1=2ÞþDt
iþ1
ð ÞþDtð Þi
2 u€
i
ð Þ ð1Þ
uðiþ1Þ¼uð Þi þDtðiþ1Þu_ðiþ1=2Þ ð2Þ
whereu_is velocity,uis displacement andirefers to increment number.
An advantage of using explicit time integration is the possibility of utilizing the diagonal lumped mass matrix. Computational efficiency can be improved by using the inversion of the mass matrix, for which the computation for the accelerations at the beginning of the increment can be reduced to a simple operation:
€
uð Þi ¼M1:Fð Þi Fð ÞIi ð3Þ
where M is the diagonal lumped mass matrix, F is the applied load vector, and FIis the internal force vector.
The explicit procedure requires no iterations and no tangent stiffness matrix.
In the explicit scheme, the time step must be small enough to ensure the stability of the integration. Abaqus finite-element software [16] used here auto-matically adjusts the time increment during the analysis based on a global estimation method. The advantages of using a global time increment estima-tion is the constant update of the maximum frequency of the algorithm leading to a better and more stable simulation. The trial stable time increment is calculated for each element in the mesh as follows:
Dt¼ 2
xelement max
ð4Þ
where xelement
max is the maximum eigenvalue of the
element. A conservative estimation of the stable time increment is given by the minimum value taken over all elements.
3.2 Body deformation
Deformability results from the external strains that the particulate material is experiencing. If there is no strain, the particle flows like a rigid body. The motion of the element nodes is governed by internal forces acting on them. The nodal forces include the contribution of the force transmitted through contact interaction, defor-mation of a discrete element and the external loads, as described in the following formulation:
Mo
2x
ot2 þFintFextFc¼0 ð5Þ
where x is the nodal displacement vector, Fintis the
internal resisting force vector, Fext is the applied
external load vector andFcis the contact force vector.
[image:5.547.107.439.60.218.2]3.3 Contact algorithm
The computational contact algorithm requires speci-fying the geometry and the constitutive relations for the contact interactions. A general contact algorithm from Abaqus/Explicit is used. This relies on a robust, yet computationally efficient search tools for tracking the motion of the grains. These sophisticated algo-rithms enable fully automated contact detection between all grains at each time steps. Grain-to-grain interaction during grain rearrangement is optimised by allowing for the entire surface of the deformable body to become a potential contact. This presents a clear improvement when compared with previous studies on single grain simulations, for which the contact area is specified to be limited to a small region. The general contact algorithm generates contact forces to resist grain penetration and uses a finite-sliding formulation that allows for arbitrary separation, sliding, and rotation of the surfaces in contact. The finite-sliding formulation assumes that the incremental relative tangential motion between surfaces does not signifi-cantly exceed the dimensions of the master surface facets, but there is no limit to the overall relative motion between surfaces (more details can be found in section 5.1.2 of Abaqus manual).
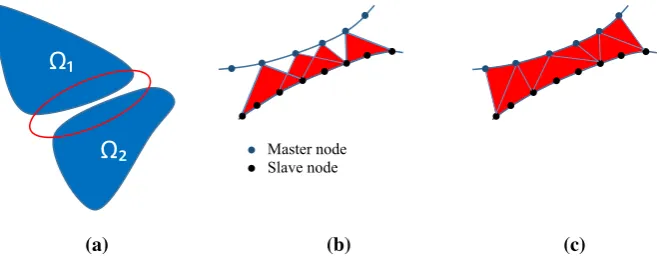
A surface-to-surface contact discretisation is used. In this discretisation each contact constraint is formu-lated based on an integral over the region surrounding the contact node (Fig.4a). In contrast with the commonly used node-to-surface approach (Fig. 4b), for the surface-to-surface discretization (Fig.4c), the continuity constraints are not enforced only at the discrete nodal points but along the entire boundary. Using a surface-to-surface formulation, the shape of
both the slave and master surfaces in the region of the contact constraint is considered, and this is critical for grains with irregular shape such as real sand grains. For these reasons, surface-to-surface approaches provide, generally, more accurate stress measurement when compared to node-to surface approaches.
The contacts are modelled with properties of hard contact in the normal direction and Coulomb friction in the tangential direction. In hard contact, when two particles are in contact, i.e. the overclosure value equals zero, all the pressure is transmitted from master to slave surface. This is shown in the following expressions:
p¼0 for h\0 ðopenÞ
h¼0 for p[0 ðclosedÞ ð6Þ
where p is pressure and h is overlap. The contact constraint is enforced with a Lagrange multiplier representing the contact pressure. The virtual work contribution is:
dP¼dphþpdh ð7Þ
4 Numerical meshing
An important requirement of the meshing process is to obtain a good finite-element representation of the irregular shaped grains, which for shelly grains can be challenging. The accurate representation of the grain’s boundary is particularly relevant to simulate contact interactions. The surface mesh extraction technique used here was a refinement of the constrained Delau-nay triangulation implemented using a developed
(a) (b) (c)
Ω₁
[image:6.547.112.442.57.187.2]Ω₂
Master node Slave nodeFig. 4 aSchematics of the contact domain between two contacting bodiesX1andX2;bnode-to-surface approach,csurface-to-surface
Matlab [17] script to generate the image-based mesh. [10]. Triangular iso-surfaces were extracted from the 3D image with pre-set values for density, which controls the size and number of triangles representing the surface of each grain.
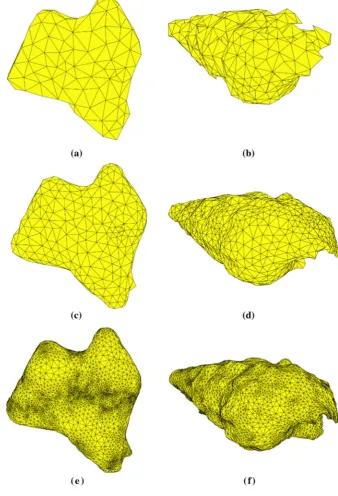
Figure5 shows two grains represented using different mesh sizes. The mesh size and quality is controlled by four parameters, which includes the
minimum angle of the triangles, the maximum volume of an element, the maximum surface element size and the maximum distance between the center of surface bounding circle and the center of the element bound-ing sphere. Figure5a and b show a coarse mesh with parameter values of 40°, 30°, 30° and 10°, respec-tively. It can be observed that this mesh size cannot capture well the irregular features of the shelly grain.
Fig. 5 Two shelly grains
represented using different mesh sizesa,bcoarse mesh,
c,dintermediate size mesh,
[image:7.547.160.499.175.672.2]The mesh was progressively refined in the other two examples presented and a minimum angle of 40°was used in all cases due to efficiency issues. The four parameters used in the two other cases were: 40°, 20°, 30°and 5°(intermediate mesh, Fig.5c, d), 40°, 30°, 30°and 1°(fine mesh, Fig.5e, f). It was found that the fine mesh is able to capture well the grain outline while avoiding the more expensive computation cost of using a more refined mesh and was then chosen for the simulation. It can be seen that for computational efficiency larger triangles are used to represent flat areas in the grain surface whereas more angular features are described with smaller triangles. The key advantage of this meshing technique is its ability to preserve the original boundary of the grain with no restrictions for complex topologies or intragranular voids. Figure6 shows the meshed full sample, the element mesh size that is, on average, five times the voxel size of the original image.
5 Simulations
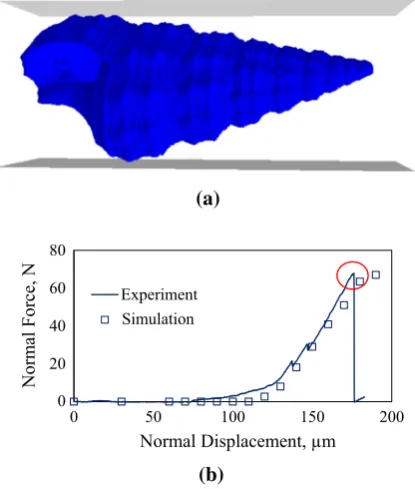
The numerical mesh was imported into thelFE model that was implemented in Abaqus with an explicit algorithm that uses a dynamic framework. The sample was confined laterally using a rigid cylinder and the displacement was applied at the top of the sample. Elastic behavior was assigned to the model. Average values of 25 GPa for Young’s modulus, 0.3 for Poisson’s ratio and 0.3 for the coefficient of friction were used. These parameters were calibrated using experimental data from single grain compression tests and curve fitting the force–displacement numerical results (Fig.7). The experimental single grain tests were carried out using the Instron 5969 strain-controlled machine (Instron, Norwood, Mas-sachusetts). The instrumentation accuracy was mea-sured to be\1 lm for displacement and\0.1 N for load. The numerical grain was compressed between two rigid plates to reproduce the experimental condi-tions. Another input parameter required for the numerical simulations was the density of the material, for which a value of 2.5 tonne/m3 was used. The analysis of the full sample took approximately 3 days (running on DELL Precision T7610 with 12 dual cores 3.2 GHz CPUs).
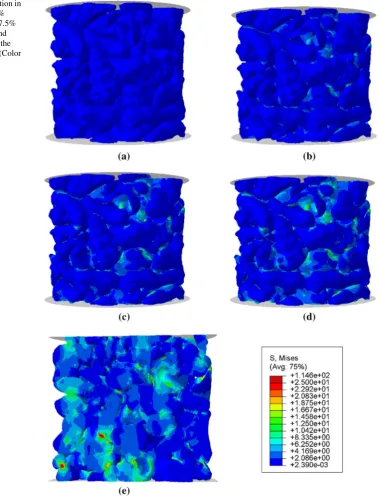
Figure8 shows the stress distribution, computed using the von Mises criterion, in the full assembly at
five different strain values. It can be seen that at the initial stage (ea= 0%), since the sample is not loaded
yet, all grains have a stress field constant and equal to zero (Fig.8a). At ea= 5%, the stress concentration
Fig. 6 Numerical mesh generated for the full assembly
(a)
(b) 0
20 40 60 80
0 50 100 150 200
Norm
al Force,
N
Normal Displacement, µm Experiment
Simulation
Fig. 7 aNumerical grain used in the simulation of the single
grain compression tests and b Force–displacement measure-ments from the experiment and the simulation
[image:8.547.305.479.58.280.2] [image:8.547.289.497.315.560.2]starts at the grain contacts and propagates through the grains before being transmitted to other neighboring grains, again by way of their contacts (Fig. 8b). At
ea= 7.5% and ea= 10% (Fig.8c, d), the assembly
becomes more heavily loaded and this is shown by the larger internal stress values exhibited at the grains.
The stress at the contacts can be better visualized in the vertical cut through the sample presented in Fig. 8e. These data enable the identification of the stress-transmitting particles and the investigation of the micro-mechanisms that lead to the breakage initiation within the grain
Fig. 8 Stress distribution in
the full sample ata0% strain,b5% strain,c7.5% strain,d10% strain and
[image:9.547.122.503.59.558.2]6 Results and discussion
The stress:strain curves obtained from both experi-ments and numerical simulation are shown in Fig.9. Overall, we can say that there is a good agreement between the two curves. The numerical samples shows a slightly softer response in the initial part of the test (up to 3% strain), which seems to suggest stronger grain rearrangement of the numerical grains when compared with the experiment. Although it is impor-tant to note that given the large size of the grains, even small rearrangements can have a significant effect on the overall settlement of the sample, the difference in the responses may also suggest that the coefficient of friction needs to be adjusted. In fact, because shelly carbonate sands are formed of different organisms/ species the numerical parameters to be used will have
to come from tests on representative species and assign to the numerical grains according to their grain type instead of using a global value.
To investigate the reliability of the numerical model in predicting the stress distribution within the individual grains, the data from the single grain compression simulations were used. In this case, it is known that the stress will start increasing at the two contacts with the top and bottom platens and propagate from there. This can be confirmed by observation of the grains shown in Fig.10.
7 Conclusions
This paper presents a preliminary investigation into the numerical simulation of shelly carbonate sands that takes into account the detailed representation of grain shape and intragranular voids. The capability of the model to measure the stress concentration at the contacts and its propagation throughout the grain skeleton for materials with complex grain morphology is demonstrated. The macro response of the simulation shows generally a good agreement and gives confi-dence on the robustness of the methodology to simulate complex morphologies numerically. The results presented here appear to suggest that for the case of sands of biogenic origin with a diversity of species forming the granular system, more accuracy can be obtained by assigning the model parameters according to the grain type instead of using a global value.
Future work will include a more in-depth physical and mechanical characterization of the grains to refine the numerical representation of the material and carry out a micro-scale comparison between the experi-ments and the simulation. Finally, the enhancement of
0
0.02
0.04
0.06
0.08
0.1
1 10 100 1000
Strain (
-)
Stress (kPa)
Experiment Simulation
Fig. 9 Comparison of the stress: strain response from the
[image:10.547.68.243.60.254.2]experimental test and simulation
Fig. 10 Stress concentration at the contact between the grain and the top and bottom platens (red region) and its propagation
[image:10.547.55.499.536.638.2]the lFE model to include simulation of breakage, taking advantage of the yield initiation within the grains, will constitute a step change for the numerical modelling of shelly carbonate sands.
Acknowledgements The authors gratefully acknowledge the
financial support by the UK Engineering and Physical Sciences Research Council (EPSRC) under the Grant Number EP/ N018168/1.
Open Access This article is distributed under the terms of the
Creative Commons Attribution 4.0 International License (http:// creativecommons.org/licenses/by/4.0/), which permits unre-stricted use, distribution, and reproduction in any medium, provided you give appropriate credit to the original author(s) and the source, provide a link to the Creative Com-mons license, and indicate if changes were made.
References
1. Coop MR (1990) The mechanics of uncemented carbonate sands. Ge´otechnique 40(4):607–626
2. Semple RM (1988) The mechanical properties of carbonate soils. In: Jewell RJ, Andrews DC (eds) Engineering for calcareous sediments. Balkema, Rotterdam, pp 807–836 3. Fonseca J, Reyes-Aldasoro CC, Wils L (2015)
Three-di-mensional quantification of the morphology and intragran-ular void ratio of a shelly carbonate sand. In: VA Rinaldi, ME Zeballos, JJ Claria´ (eds) Deformation characteristics of geomaterials: proceedings of the 6th international sympo-sium on deformation characteristics of geomaterials, Bue-nos Aires, Argentina. IOS Press, Amsterdam, pp 551–558 4. API (American Petroleum Institute) (2007) Recommended
practice for offshore platforms. API, Washington
5. Jardine R, Chow F, Overy R, Standing J (2005) ICP design methods for driven piles in sands and clays. Thomas Telford Ltd, London
6. Beemer RD, Bandini-Maeder AN, Shaw J, Lebrec U, Cas-sidy MJ (2018) The granular structure of two marine car-bonate sediments. In: ASME 37th international conference on Ocean, Offshore and Arctic engineering OMAE2018, Madrid, Spain, 17th–22nd June
7. Santamarina JC, Cho GC (2004) Soil behaviour: the role of particle shape. In: Advances in geotechnical engineering: the skempton conference, vol 1. Thomas Telford, London, pp 604–617
8. Golightly CR (1988) Engineering properties of Carbonate sand. Ph.D. thesis
9. Kong D, Fonseca J (2018) Quantification of the morphology of shelly carbonate sands using 3D images. Ge´otechnique 68(3):249–261
10. Nadimi S, Fonseca J (2018) A micro finite-element model for soil behaviour. Ge´otechnique 68(4):290–302
11. Nadimi S, Fonseca J (2018) A micro finite-element model for soil behaviour: numerical validation. Ge´otechnique 68(4):364–369
12. Munjiza A (2004) The combined finite-discrete element method. Wiley, Chichester
13. Harthong B, Je´rier J, Richefeua V, Chareyre B, Dore´mus P, Imbault D, Donze´ F (2012) Contact impingement in pack-ings of elastic–plastic spheres, application to powder com-paction. Int J Mech Sci 61(1):32–43
14. Nadimi S, Fonseca J (2017) On the tensile strength of soil grains in Hertzian response. In: EPJ Web of conferences, vol 140. EDP Sciences, p 07001
15. Nadimi S, Kong D, Fonseca J (2017) From imaging to prediction of carbonate sand behaviour. Paper presented at the ICTMS 2017, 26–30 Jun 2017, Lund, Sweden 16. Dassault Syste`mes (2014) ABAQUS user’s manual 2014
version 6.14. Dassault Syste`mes, Providence