1
Mitigation of Sub-synchronous Control Interaction of a Power System with
DFIG-based Wind Farm under Multi-operating points
X.Y. Bian
1, Yang Ding
1, Qingyu Jia
1*, Lei Shi
2, Xiao-Ping Zhang
3, Kwok L Lo,
41 Electric Engineering College, Shanghai University of Electric Power, Shanghai, China
2 State Grid Shanghai Municipal Electric Power Company, Shanghai, China
3 University of Birmingham, Birmingham, U.K.
4 University of Strathclyde, Glasgow, U.K.
*
[email protected]
Abstract:This paper presents a probabilistic design of a power system stabilizer (PSS) for doubly-fed induction generator (DFIG) converter and investigates its potential capability in mitigating the sub-synchronous control interaction (SSCI) under multi-operating points of. The aim is to improve the probabilistic sub-synchronous stability of the system with wind farm penetration. In this paper, Participation Factors (PFs) are obtained to identify the SSCI strong-related state variables and major control loops, which are used for the preliminary siting of the DFIG-PSS. Probabilistic sensitivity indices (PSIs) are then employed for accurate positioning of the PSS, selecting the input control signal and optimizing the PSS parameters. The effectiveness of the proposed approach is verified on a modified two-area power system.
Keyword: Doubly-fed induction generator (DFIG), sub-synchronous control interaction (SSCI), multi-operating points, probabilistic sensitivity index (PSI), power system stabilizer (PSS).
1. Introduction
As an effective means of power production, wind power has rapidly expanded under environmental pressures in recent years. Since places with abundant wind resources are generally remote from load centers, series compensated line provides an effective and economic solution for improving power transfer capability.
However, sub-synchronous control interaction (SSCI), a newly experienced oscillation phenomenon, has been introduced by wind farm interconnected with the series compensated electrical network [1][2]. With the increasing employment of DFIG wind turbines, the SSCI issues will put tremendous challenges to the reliable operation of wind farms. Therefore, SSCI analysis and its mitigation have been and will continue to be interested topics in the power system dynamic field which have gained significant attention in recent years.
At present, a great deal of efforts have been devoted to the SSCI. In [3] and [4] based on small-signal eigenvalue analysis, several selected scenarios with fixed wind speed in the range of 7m/s to 12m/s are taken into account to analyze the impact of wind turbine output on the oscillation modes. Their work verifies that the variations of the wind farm output, i.e. system operating conditions, are able to exert an impact on the sub-synchronous modes. In [5], frequency
scan method is combined with small signal eigenvalue analysis to analyze the impact of the converter PI parameters on sub-synchronous modes. However, no effective measures are proposed in [3]-[5] to mitigate the SSCI.
Various countermeasures in SSI mitigation are reported in [6]-[18] which can be summarized into two categories: one is employing Flexible AC Transmission Systems (FACTS), such as static var compensator (SVC) and static synchronous compensator (STATCOM), whose capability have been explored in [7]-[8]. The other one is based on the modification of wind turbine control system, including adjusting converter parameters [9] or installing a supplementary damping controller [14]. The latter solution is more suitable from an economic point of view for avoiding considerable installation costs.
2 grid-side converter (GSC) of DFIG has a similar topological
structure to STATCOM and it is expected to be able to provide better sufficient damping capability through installing a supplementary damping controller to the converter [6][10].
All the damping controllers mentioned in [6], [10]-[13] are designed at the pertinence of a certain condition so that there is a potential possibility that the damping controllers may fail to be applicable for other operating points. It is worth noting here that the varying of the system operating conditions is expected to exert an influence on the analysis and mitigation of the SSCI Error! Reference source not found.[4]. The ability of power converter of DFIG when random factors are taken into account has scarcely been investigated up to now. What’s more, for damping controller’s location, its input control signal and parameter setting, the existing practices are generally time-consuming and lack of a definite quantity index. In [16], three types of RSC with different input signals are compared with respect to the SSCI performance, based on impedance methods. And the best of three turns out to be the final choice of input signals. In [6], different locations and input signals are compared using the residue-based analysis and root locus diagrams to determine the best selection. Apparently, this is time-consuming even under a single operating condition and lacks a definite quantity index. Once multi-operating points are taken into consideration, the computing will become tremendously cumbersome. Moreover, very few studies have been done in terms of the optimization of damping controller parameters up to now.
The major contributions or innovations of this paper are summarized as follows. Taking into account the stochastic fluctuation of the wind farm output, the synchronous generators output and load, SSCI issues are investigated by probabilistic approach. That is to say, the influence of multi-operating points of a power system on SSCI is involved in this paper [4]. The damping controller in this paper, i.e., the PSS supplemented to the DFIG converter (DFIG-PSS) is designed in probabilistic environment to achieve the purpose of suppressing SSCI at different operating points of the system. What is different from the existing methods is that quantitative indices are used as a reference in this paper to make the design process more efficient in a directed effort [6][16]. Probabilistic sensitivity index (PSI) is utilized to select the site and the input control signal as well as to optimize PSS parameters for better probabilistic sub-synchronous stability.
The organization of this paper is as follows. In section 2, different SSI types that may occur in wind farms are briefly described, SSCI mechanism related to the DFIG converter is explained in detail. The probabilistic eigenvalue and its probability distribution function expression and PSIs of the eigenvalues are formulated in Section 3. The whole process of SSCI mode identification and its mitigation with DFIG-PSS is presented in Section 4 and 5. The SSCI mode is identified and analyzed based on a modified five-machine two-area power system in Section 4. In Section 5, a DFIG-PSS is designed and validated under multi-operating points in five steps: a) selecting the optimum placement, b)
choosing the optimal input signal, c) determining the parameter settings, and d) optimizing the parameters for probabilistic sub-synchronous stability enhancement, e) comparing the proposed probabilistic controller and a controller designed with the general small signal method. Finally, conclusions are drawn in Section 6.
2. Sub-Synchronous control interaction
2.1. SSI with Wind Farm integrated
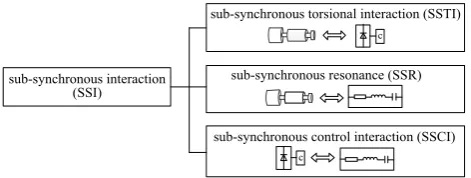
SSI is a generally umbrella term that defines energy exchanges between two power system elements at one or more natural frequencies below the power frequency, which can be divided into three categories shown in Fig.1 according to the different elements of the wind turbines involved [17], namely, Sub-Synchronous Torsional Interaction (SSTI), Sub-Synchronous Resonance (SSR), and SSCI.
sub-synchronous interaction (SSI)
sub-synchronous control interaction (SSCI) sub-synchronous resonance (SSR) sub-synchronous torsional interaction (SSTI)
c
[image:2.595.313.549.314.403.2]c
Fig. 1. Classification of SSI with wind turbine integrated. SSR is a resonant phenomenon related to energy exchanges which result from an interaction between the mechanical system of a turbine generator and an electrical resonance transmission system formed by series capacitor and effective impedance [17][18]. SSTI is a condition where an interaction occurs between the wind turbine drive-train and the power electronic controller which would be found in the HVDC transmission system, FACTS devices and mechanical mass system of a generator [19]. Low shaft stiffness of wind turbine drive-train leads to a low torsional natural frequency in the range of 1-3 Hz [6], but SSTI rarely occurs because it requires a very high level of series compensation to excite [20].
2.2. Sub-Synchronous control interaction with DFIG
SSCI takes place as a result of an interaction between the series-compensated electrical network and power electronic devices [1], such as the DFIG-based wind turbine controllers.
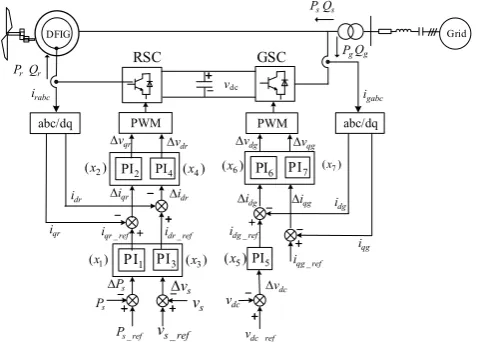
The block diagram of DFIG converter controllers and cascaded control loops are shown in Fig.2.
3 reactive power, voltage and current respectively. vdc
represents dc-link capacitor voltage.
GSC vdc PWM abc/dq RSC abc/dq PWM _ s ref P s P qr i dr i
vdr
DFIG _ s ref v rabc i
idr
iqr
Ps vs vdc
idg iqg dg
v
_ qr ref
i idr ref_
s v dg i qg i _ qg ref i dc v _ dc ref v _ dg ref i
vqr vqg
gabc
i
r
P
s
PQs
r Q g Q g P Grid 1
PI PI3 2
PI PI4 PI6 PI7
5
PI
2
( )x ( )x4 ( )x6 ( )x7
5
( )x
3
( )x 1
( )x
Fig. 2. The control structure of the DFIG-based wind farm
integrated to the grid.
The principle of DFIG-based wind turbine controllers participating in SSCI is depicted as follows.
As shown in Fig.2, RSC operated in the stator flux reference frame is responsible for regulating the active and reactive power of DFIG stator independently. When series compensated line has current disturbances at frequency of
n, sub-synchronous components of dq axis of stator currents iqs sub and ids sub at the complementary frequency s-n will be induced, s is the electric
fundamental frequency. iqs sub and ids sub cause the fluctuation of the active power Ps and voltage
v
s respectively. Ps and vs are inputs of the converter controlloops into the RSC control system. Rotor currents variation of dq axis iqr and idrare produced through PI control
loops and cause the voltage variation vqr and vdr as is
shown in Eqs. (1) and (2) respectively. GSC adopted voltage oriented vector control strategy aims to regulate the dc-link voltage and reactive power of the DFIG GSC [13][21]. Instantaneous power collected by the GSC is bound to be changed when sub-synchronous currents flow through the stator side, GSC voltage and current of dq axis vqg, vdg,
qg
i
, and idg are also changed as shown in Eqs. (3) and (4)
respectively. Rotating magnetic field formed by sub-synchronous current components of stator side cuts the rotor windings,sub-synchronous currents at a frequency r-n will be induced in the rotor windings, which makes further impact on the RSC control system. In Eqs. (1) to (4), RSC and GSC contain seven sets of proportional and integral coefficients Kp and Ki, x1~x7 are defined as the state variables in the converters, which represent the outputs of the integrator.
2
1 2 1 2 1 2 1 2
* 2
2 2
* *
( )
(s)
( ) (s)
p p p i i p i i
qr
p i
s qr
K K s K K K K s K K
s
sK K
P s I
s
V
(1)
2
3 4 3 4 3 4 3 4
* 2
4 4
* *
( )
(s)
( ) (s)
p p p i i p i i
dr
p i
s dr
K K s K K K K s K K
V
s
sK K
V s I
s (2) 2
5 6 5 6 5 6 5 6
* 2 6 6 * * ( ) (s) (s) (s)
p p p i i p i i
dg
p i
dc dg
K K s K K K K s K K
V s sK K V I s (3) (4)
[image:3.595.336.556.58.194.2]The mutual excitation between DFIG converters and series compensation circuits produces the SSCI, as shown in Fig.3. Impacts on the RSC came from two sides are able to jointly react on the rotor windings. After Park transformation, the sub-synchronous voltage components of
d axis and q axis vdr sub and vqr sub are then imposed on the rotor windings, as a result, new rotor current components will be exerted and further induced to the stator side, which help to increase the positive feedback of the initial disturbance currents under sub-synchronous frequency.
sub i s P s v dr sub i qr sub i dr sub v qr sub v n
( s n)
( r n)
( s n)
dr sub i
qr sub i
( s n) ds sub
i
qs sub
i
( s n)
control system
[image:3.595.47.286.88.259.2]of RSC
Fig. 3. Schematic diagram of the SSCI.
3. Probabilistic method for SSCI
Noting that SSCI is not related to the intrinsic frequency of the drive-train [19], yet it depends not only on the controller parameters of the DFIG converters but also on the system operating points [17].
In order to analyze and mitigate the SSCI under muti-operating points. A probabilistic method is utilized to deal with the changes of nodal power injections caused by various kinds of random factors such as loads, output of wind farm and synchronous generators. Based on authors’ former work [22]-[24], the probabilistic methods are applied to load flow and eigenvalue calculation.
The objective of this section is to determine the probability distribution of system eigenvalues and the probabilistic sensitivities of eigenvalues on DFIG converter parameters, which would be used for identifying SSCI modes and designing the damping controller.
3.1. Probabilistic eigenvalue expression and its distribution
7
*(s) ( 7 i ) *(s)
qg p qg
K
V K I
s
[image:3.595.313.541.339.405.2]4 A pair of particular complex eigenvalues k=kjk in
the system represents an oscillation mode, the real part k is the damping constant, and the imaginary part k indicates the oscillation frequency, which can be applied for identifying the SSCI modes.
An eigenvalue k of the state matrix A of the linearized power system’s dynamic equations can be expressed as the nonlinear function Z of the nodal voltage vector V.
( )
k Z Vk
(5) where nodal voltages are defined in rectangular coordinates. In an N-node system, V contains 2N components as
T
1 2 2
[ , , ... ,
N]
V
V V
V
when real and imaginary parts are described separately.Eq. (5) can be expanded using the approximate Taylor series at the vicinity of the expected value of voltage with up to third-order and higher order terms are neglected,
2 1
2 2 2
1 1
( ) ( Δ )
1
( Δ Δ ) 2
N k
k k i
i i V V
N N
k
i j
i j i j V V
Z V V
V V V V V
(6)The excepted value of the eigenvalue is,
2 2 2 , 1 1 1 ( ) ( )
2 i j
N N
k
k k v v
i j i j V V
Z V C
V V
(7)where CV Vi, j V Vi j is covariance between the nodal voltages, the expectation operator is denoted by(.).
The covariance between the eigenvalue can be obtained by CV Vi, jaccording to Eq. (8).
2
, ,
1 1
( )
k k i j
N
k k
V V
i i j
j C C V V
(8)(
k,
k) is indicative of any one of the combinations of kand k, i.e., (k, k), (k, k), (k, k), (k, k).
Standard deviation of the real part
kis square root of the variance.,
k C k k
(9)The damping ratio
k can be calculated by Eq. (10).2 2 k k k k
(10)
Standard deviation of
k is derived by using Eqs. (11) and (12).2 2
, , , 2 ,
k Ck k m Ck k n Ck k mnCk k
(11)
2 3 k k m , 3 k k k
n
(12)
'
k
and 'k
are defined separately as the extended damping coefficient and damping ratio respectively. candc
are the corresponding acceptable thresholds. The upper limit c is selected as 0 to guarantee the eigenvalue distribution located on the left half-plane of the complex plane, and the lower limit
c is chosen as 0.1 to ensure the dynamic performances of the system [23][24].' 4
k
k k c
(13a)' 4
k k k c
(13b)A hybrid algorithm combining central moments and cumulants with Gram-Charlier series expansion is applied to obtain the probability density function (PDF) as expressed in Eq. (14) [25]. The probability of damping constant less than 0 and the probability of damping ratio more than 0.1 can be obtained by integral of PDF according to Eq. (15), which are treated as two performance indices for the assessment of probabilistic characteristics of the power system.
3 3 3 4 2 4 4 5 3 5 5 ( ) ( ) ( )[1 ( 3 )
6 ( )
( 6 3) 24
( )
( 10 15 )] 120 k k k k k k k
f N x x x
x x
x x x
(14)
c
2 3
c 3 c
3 4 c c 4 4 2 5 c c 5
( ) ( )d ( )
( )[ ( 1) 6
( ) ( 3 ) 24
( )
( 6 3)] 120
c xc
k k k
k k k k k k
P f d N x x
N x x
x x x x (15)
where f (μk )is PDF of the μk, N(x) is PDF for the standard
normal distribution, γj (μk) (j = 3, 4, 5) is a j-order cumulant, k
is the standard deviation of the μk, and x is the variable
standardized by Eq. (16).
,
k k c k
c
k k
x x (16)
when μk equals αk and ξk respectively, the probability of
damping constant and damping ratio can be obtained by Eq. (15).
5 The effect of a parameter К on both '
k
and ' k
are defined as probabilistic sensitivity indices (PSIs) [24], which can be used to design the DFIG-PSS under multi-operating conditions. PSI indicates the impact of converter parameter on the eigenvalue when К is chosen as PI parameter of the converter, giving guidance to the selection of site and input signal of the PSS. When К is the PSS parameters, PSI can provide effective information for the adjustment and optimization of the parameter for improving the probabilistic stability of the system [26][27].' '
4 k
k
k k
S
(17a)
' '
4 k
k
k k
S
(17b)
3.3. The whole process of SSCI analysis and mitigation
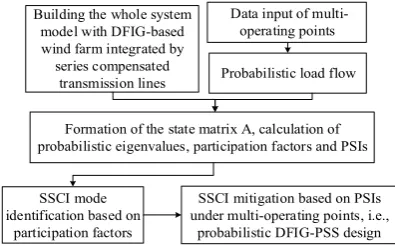
By applying the proposed probabilistic method, the whole process of SSCI identification and mitigation is illustrated as follows.
Building the whole system model with DFIG-based wind farm integrated by series compensated
transmission lines Probabilistic load flow
Formation of the state matrix A, calculation of probabilistic eigenvalues, participation factors and PSIs
SSCI mode identification based on
participation factors
SSCI mitigation based on PSIs under multi-operating points, i.e.,
probabilistic DFIG-PSS design Data input of
[image:5.595.323.541.56.320.2]multi-operating points
Fig.4. The process of probabilistic SSCI mitigation.
4. SSCI identification and analysis using probabilistic method
4.1. Test system
The five-machine two-area test system in Fig.5(a) is modified from a typical two-area system integrated with a DFIG-based wind farm [28]. The collective behavior of a group of wind turbines in the wind farm is represented by an equivalent lumped wind turbine G5, which represents the aggregation of 80 DFIGs, each one has a power rating of 1.5MW [6].
Load2 G4 Load1
12 G1
G2
G3
13 14
15
1 2 3 4 5 6 7
Area 1 G5
Series compensated line
Area 2 8
10 9 11
(a)
(b)
Fig.5. (a) A five-machine two-area system with wind farm
integrated. (b) The standardized daily operating curves of the generators and loads.
G5 is connected to the power system via the equivalent outlet transformers and 55% series compensated transmission lines. The parameters of DFIG and controllers are given in the Appendix.
All synchronous generators are represented by a 6-order model [28]. The standardized daily operating curves of G1~G5 and load1, load2 are given in [23]. Fig.5(b) shows the standardized daily operating curves, which are used to produce 480 sets of operating points.
4.2. Probabilistic analysis of the SSCI with the DFIG-Based Wind Farm connected
Plug-in Modeling Technique (PMT) [23][24] is adopted to form the state matrix A of the whole system. Probabilistic characteristics of eigenvalues are obtained by utilizing the probabilistic eigenvalue method proposed in Section 3. The original system without wind farm integrated has a total of 27 eigenvalues, which are all located in the left side of the complex plane.
Table 1 Probability of the new oscillation modes with Wind Farm integration (no DFIG-PSS)
mode
Eigenvalues j
Damping ratio
P{α<0} (%)
P{ξ>0.1} (%) 1 15.0098±j106.1040 0.141 47.11 45.62
0 2 4 6 8 10 12 14 16 18 20 22 24 0.4
0.6 0.8 1 1.2 1.4 1.6
1.8 G1
G2 G3 G4
G5 Load1 Load2
hour p.u
a
ct
iv
e
po
w
er
o
f
th
e
ge
ne
ra
to
rs
a
nd
l
oa
ds
time
0 2 4 6 8 10 12 14 16 18 20 22 24 0.4
0.6 0.8 1 1.2 1.4 1.6
1.8 G1
G2 G3 G4
G5 Load1 Load2
hour p.u
a
ct
iv
e
po
w
er
o
f
th
e
ge
ne
ra
to
rs
a
nd
l
oa
ds
[image:5.595.77.275.384.507.2] [image:5.595.315.550.695.755.2]6 2 -11.2386±j14.3926 0.565 65.49 55.55
3 -1.8312±j2.8679 0.538 100 100 4 -1.0556±j5.4197 0.191 100 100
Table 1 gives the probability statistics of new oscillation modes which are induced by the integration of wind farm. According to the computational formula f=ω/(2π), the imaginary parts give the oscillation frequency of the modes. The oscillation frequency of mode 1 is 16.89 HZ, which belongs to the frequency range of sub-synchronous oscillation. It can be observed from Table 1 that the expectation of damping ratio is 0.141, and the sub-synchronous mode is poorly damped. The probability of damping constant less than 0 (P{
<0}) and the probability of damping ratio more than 0.1 (P{ >0.1}) are 47.11% and 45.62% respectively. There is a lack of assurance of adequate stability.4.3. Identification of the SSCI mode
Participation factor (PF) can be computed as shown in Eq. (18). It is utilized to denote the relative participation degree of the lth state variable on the kth mode.
1
lk kl
lk n
ik ki
i
u v
p
u v
(18)where u and v are right and left eigenvectors of A, respectively.
[image:6.595.308.551.320.613.2]PFs of sub-synchronous mode (mode 1) are calculated to identify the state variables which are associated with the mode, corresponding PFs of four synchronous generators are all zero. There are 14 state variables in the DFIG, representative values are listed in Table 2, where the dominant PFs are printed in bold. Results show that sub-synchronous mode is closely relevant to the DFIG other than the four synchronous generators.
Table 2 Participation factors of mode 1
Δvdc Δx1 Δx2 Δx5
0.53∠22° 0.11∠-71° 0.02∠-136° 0.023∠-74°
Δx7 Δs Δωt Δθt
0.52∠-15° 0.59×10⁻²∠120° 0.83×10⁻⁶∠-102° 0.52×10⁻⁵∠82°
It can be observed that the participation of rotating speed deviation of wind wheel Δωt and torsional angle deviation Δθt are relatively low, and are almost close to zero, which verifies that state variables associated with the wind turbine drive-train do not participate. Since the state variables of
voltage deviation across the dc-link Δvdc and
x
7 in the current control loop of GSC in Fig.2 have the largest PF, mode 1 is strongly relevant to the converter, and so it is identified as the SSCI mode. PF can be used as a preliminary location index to narrow down the range of adding DFIG-PSS. The focus is on GSC of the wind turbine, rather than RSC.4.4. PSI of the SSCI mode
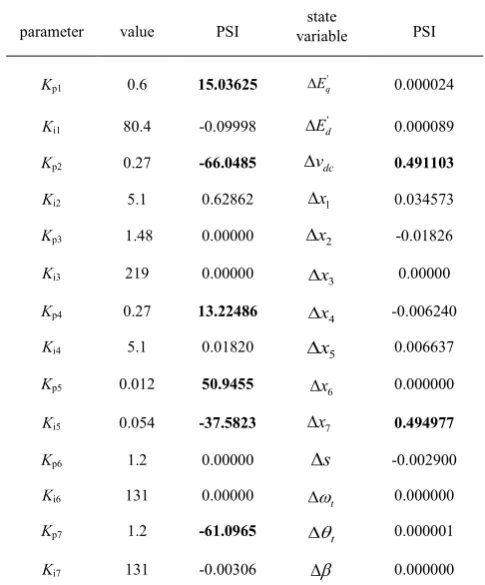
PSIs have been calculated in Table 3 to represent the sensitivity degree of PI parameters or state variables on the SSCI mode, and indicate how much substantial influence of the parameters or state variables on the SSCI mode and to lay the foundation for designing the DFIG-PSS.
Table 3 PSI corresponding to the PI converter parameters/ state variables
parameter value PSI variable state PSI
Kp1 0.6 15.03625 0.000024
Ki1 80.4 -0.09998 0.000089 Kp2 0.27 -66.0485 0.491103 Ki2 5.1 0.62862 0.034573 Kp3 1.48 0.00000 -0.01826 Ki3 219 0.00000 x3 0.00000 Kp4 0.27 13.22486 x4 -0.006240 Ki4 5.1 0.01820 x5 0.006637 Kp5 0.012 50.9455 x6 0.000000 Ki5 0.054 -37.5823 0.494977 Kp6 1.2 0.00000 s -0.002900 Ki6 131 0.00000 t 0.000000 Kp7 1.2 -61.0965 t 0.000001 Ki7 131 -0.00306 0.000000
The dominant PSIs (bold print) show that Kp has a greater contribution than Ki. The SSCI mode is susceptible to Kp2 of the RSC and Kp7 of the GSC respectively. Negative symbol of PSI illustrates that probabilistic stability of the SSCI mode will be improved when Kp2 or Kp7 is decreased. The PSIs of the state variables show that Δvdc and
x
7 with high degree of participation in the SSCI mode also have large values of PSIs.' q
E
'
d
E
1 x
2 x
7 x
dc
v
[image:6.595.43.285.597.678.2]7 SSCI mitigation by optimizing the PI parameters of the
converter control system can avoid sub-synchronous instability. However, the mitigation effect depends on the specific tuned controller from the manufacturers. In addition this method may deteriorate the DFIG control bandwidth and make it more difficult to fulfill the fault-ride-through requirements [17]. It is important to consider both the original control performances and the effect of the SSCI damping. Consequently, an additional DFIG-PSS is an efficient approach to provide sufficient damping for mitigating SSCI.
5. Probabilistic method based DFIG-PSS design Compared with mechanical oscillations, those SSCI oscillations that belong to purely electrical interactions build up quickly. And the system will suffer instability in the absence of any effective controls. DFIG-PSS can be utilized to offer sufficient additional damping for the SSCI. DFIG-PSS selection is considered in the aspects of optimal location, proper input signal and optimum parameters by the probabilistic indices obtained in section 4.
5.1. Selection of DFIG-PSS location
The main objective of this section is to utilize PFs and PSIs obtained in Table 2 and 3 for location selection of the DFIG-PSS. The value of and PSI of x7 and Kp7 andPF of
7
x
in the GSC current loop is large, and hence DFIG-PSS supplemented in this loop has the optimal control performances when compared to other places. The output of the DFIG-PSS is injected to the summing junction before the PI regulator of the inner control loop, and as such the potential of DFIG converter is used for SSCI mitigation. The model is shown in Fig.6(a).5 5 i
p K K
s
-_
dg ref
i
+-+
dg i
_ qg ref
i
-i
qg 77 i
p K K
s
dg
v
qg
v
_
dc ref
v
dc
v
PSS
v
6 6
i p
K K
s
DFIG
DFIG PSS
5
( )x ( )x6
7
( )x
(a)
1
2 1 1
sT sT
PSS
K
1
w
w sT
sT
output
dc
v
(b)
Fig. 6. (a) GSC controller with DFIG-PSS injected. (b)
Module of DFIG-PSS.
5.2. Input control signal selection of the DFIG-PSS
[image:7.595.310.550.228.264.2]In this section, four electrical quantities associated with the oscillations are employed respectively as the input control signal including active power deviation ΔPs, line current deviation ΔIl, rotor angular speed deviation Δω, and dc-link voltage deviation Δvdc [18][29]. PSIs corresponding to the above feedback signals are listed in Table 4. As evident from Table 4, Δvdc has the highest value of PSI as compared to other three signals and is selected as the most applicable stabilizing signal of the DFIG-PSS.
Table 4 PSI corresponding to the input control signal
input signal
ΔPs ΔIl Δvdc Δω
PSI 0.19602 0.11645 0.49110 0.21556
5.3. DFIG-PSS initial parameter settings
The structure of the DFIG-PSS is shown in Fig.6(b), which is made up of a gain block, a signal washout block and a phase compensation block, s denotes the differential operator.
DFIG-PSS parameters cover the gain KPSS, the washout time constant Tw, and the lead/lag time constants T1/T2. Initial parameters settings are of paramount importance. The DFIG-PSS may not produce the expected performance if the values are inappropriate. PSS’s gain is determined by PSI of residue index (RI) [24]. For the washout, Tw is equivalent to 10s so as to allow oscillatory signals in the input to pass through without changing [30]. The initial time settings are estimated by phase compensation principle [27]. With the initial parameters listed in (19), homologous probabilistic characteristics are shown in Table 5.
[image:7.595.45.285.518.711.2]KPSS=10.4, Tw=10s, T1=0.360s, T2=0.100s (19)
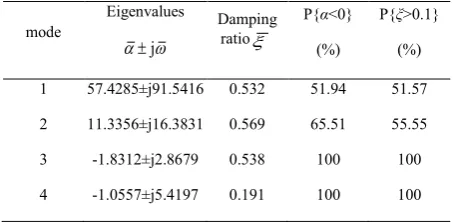
Table 5 Oscillation modes with Δvdc as input signal
mode
Eigenvalues j
Damping ratio
P{α<0} (%)
P{ξ>0.1} (%) 1 57.4285±j91.5416 0.532 51.94 51.57 2 11.3356±j16.3831 0.569 65.51 55.55 3 -1.8312±j2.8679 0.538 100 100 4 -1.0557±j5.4197 0.191 100 100
5.4. Parameters optimization of the DFIG-PSS
[image:7.595.317.544.565.676.2]8 constants repeatedly. The optimization procedure discussed
in this section can reduce the computational effort.
The relation between the concerned eigenvalues and adjustable parameters of the PSS is represented.
' k
D J P
(20)
where real vector D collects all the damping constants, and parameter vector P consists of KPSS, T1 and T2. J is a probabilistic sensitivity matrix formed from associated PSIs computed by (17), providing a guidance for the elements of
P that endeavor to improve the damping. Parameters are adjusted repeatedly starting with the initial values listed in (19) to improve the corresponding eigenvalues in D by (20), until all the damping constants satisfy the requirements in (13).
The final parameters settings are:
KPSS=12.5, Tw=10s, T1=0.217s, T2=0.106s (21)
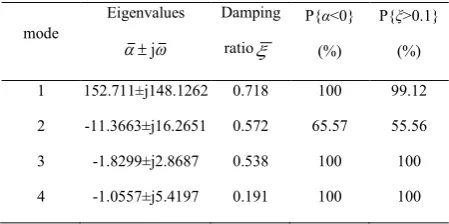
[image:8.595.313.548.59.188.2]The corresponding probability statistics of oscillation modes with optimized PSS are obtained and are shown in Table 6. Compared with Table I without DFIG-PSS, the system probabilistic stability is much improved. From the results it is clear that the expectation of damping ratio of the SSCI mode is significantly improved, and the probability of it more than 0.1 achieves a large increase. The stability probability of real part less than zero reaches 100%.
Table 6 Oscillation modes with Δvdc as input signal with optimized DFIG-PSS parameters
mode
Eigenvalues j
Damping ratio
P{α<0} (%)
P{ξ>0.1} (%) 1 152.711±j148.1262 0.718 100 99.12 2 -11.3663±j16.2651 0.572 65.57 55.56 3 -1.8299±j2.8687 0.538 100 100 4 -1.0557±j5.4197 0.191 100 100
Low frequency oscillation modes are insensitive to the supplementary DFIG-PSS. The variation tendency of the SSCI mode with and without the DFIG-PSS is described in Fig.7. It is observed that the expectation of the real parts of SSCI mode with proposed DFIG-PSS move further away from the imaginary axis to the left which demonstrated the enhancement of the probabilistic sub-synchronous stability of the SSCI mode.
Fig. 7. Probability distribution of the oscillation modes.
(a)
(b)
Fig. 8. Probability density curves of the SSCI mode. (a)
Real parts (b) Damping ratio
Probability density function can be drawn by using Eq. (14), and Fig.8(a) depicts the PDF of the real parts of the SSCI mode with and without the DFIG-PSS, and the PDF curve becomes scattered with the wind farm. The real parts of the SSCI mode without PSS have more than half of the probability in the right hand side, where the mode is unstable. When well designed DFIG-PSS is implemented, the PDF curve moves to the left and the probability becomes more concentrated, probabilistic stability of SSCI mode is prominently enhanced.
-200 -120 -40 40 120 200
-160 -140 -120 -100 -80 -60 -40 -20 0 20
SSCI mode wothout DFIG-PSS low frequency mode without DFIG-PSS SSCI mode with DFIG-PSS
imag
real
-0.001 0.001 0.003 0.005 0.007
-2000 -1500 -1000 -500 0 500 1000 1500 2000
without DFIG-PSS with DFIG-PSS
Real parts
p
rob
ab
il
ity
d
en
si
ty
-0.5 0 0.5 1 1.5 2 2.5
-3 -2 -1 0 1 2 3 4
without DFIG-PSS with DFIG-PSS damping ratio
p
rob
ab
il
ity
d
en
si
[image:8.595.313.546.230.563.2] [image:8.595.52.277.438.550.2]9 Fig.8(b) describes the PDF of the damping ratio of the
SSCI mode with and without the DFIG-PSS, nearly the half probability of the damping ratio for the system with wind farm without DFIG-PSS has a negative value, which is indicative of positive real parts of the eigenvalues that would lead to system instability. The probability of damping ratio with DFIG-PSS concentrates upon the range from 0 to 1. The superior performance of the proposed DFIG-PSS and the SSCI suppression effect are verified.
5.5. Comparison with small signal method
The biggest difference between the mitigation method proposed in this paper and current methods lies in the fact that muti-operating points of the system are taken into account. The damping controller is designed based on the probabilistic method so as to satisfy the mitigation requirements under multi-operating conditions of the system.
To validate the proposed method, a comparison is made between the proposed probabilistic damping controller and the controller designed with the general small signal method. For the convenience of comparison, the proposed probabilistic sub-synchronous damping controller (i.e., the DFIG-PSS) is named as PSSDC and the damping controller designed with the general small signal method is named as GSSDC. In the general small signal method, residue-based analysis and root locus diagrams are applied for designing the GSSDC, of which the detailed model is presented in [6]. GSSDC is designed based on the operating point A listed in Table 7, while PSSDC is based on multi-operating points including the point A and B of Table 7.
[image:9.595.313.540.57.130.2]The system is tested with PSSDC and GSSDC installed, separately. A 55% series compensation is put into operation at 0.1s in both cases. SSCI performance is observed through the curve of DFIG electromagnetic power. The time domain simulation under the two different operating conditions, i.e., the operating point A and B, is presented as follows.
Table 7 Different operating conditions of the test system
Operating
Point A B
DFIG Output 0.8 0.5
Synchronous Generator Output (area 1)
G1: 1.15, G2: 1.0 G1: 0.95, G2: 0.85
Synchronous Generator Output (area 2)
G3: 1.02, G4: 0.98 G3: 0.95, G4: 0.89
Load Load1: 1.2, Load2: 0.8 Load1:1.0, Load2: 0.8
Series
Compensation 55% 55%
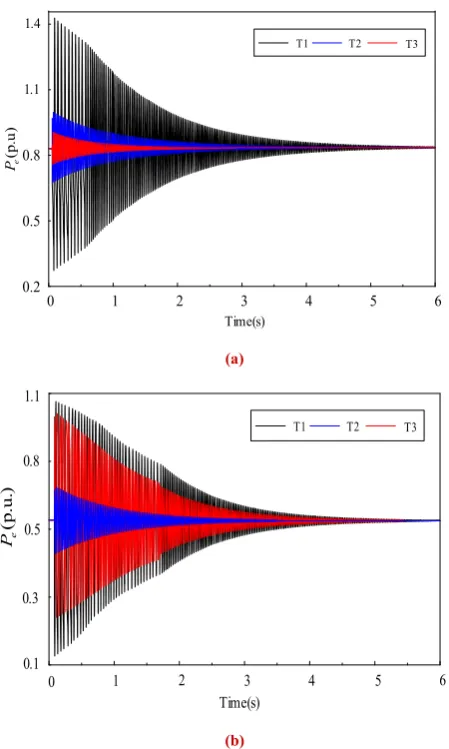
Fig.9(a) presents the curve of DFIG electromagnetic power at the operating point A. Taking the original state without sub-synchronous damping controller (SSDC) as a reference, the performance of PSSDC is compared with that of GSSDC on the oscillation amplitude and the speed of attenuation. It can be seen that a 17Hz sub-synchronous oscillation occurs when no SSDC is installed into the system.
0 1 2 3 4 5 6
0.2 0.5 0.8
1.1 1.4
Time(s)
T1 T2 T3
(p
.u
)
e
P
(a)
6 5 4 3 2 1 0 1.1
0.8
0.5
0.3
0.1
Time(s)
(p
.u
.)
e
P
T1 T2 T3
(b)
Fig. 9. Comparison of PSSDC and GSSDC on the curve of DFIG electromagnetic power at different operating points. (a) Operating point A, (b) Operating point B.
At the operating point A, as Fig.9(a) shows, both PSSDC and GSSDC have played an active role in suppression of SSCI. Although GSSDC has a better performance than PSSDC, there exists no great difference.
[image:9.595.313.538.255.630.2] [image:9.595.42.290.603.748.2]10 shows a poor performance while PSSDC still works well.
GSSDC exhibits a larger oscillation amplitude and slower convergence. This means that the GSSDC designed with the general small signal method at point A is not applicable to point B, and the PSSDC based on multi-operating points is effective in mitigating oscillations in both cases. The above simulation results indicate that operating conditions have a great influence on system oscillation characteristics and the damping controller designed in view of a single operating point has its own limitations unavoidably.
Based on the comparison between PSSDC designed with the proposed probabilistic method and GSSDC designed with the general small signal method, the effectiveness of PSSDC in mitigating SSCI at multi-operating points has been verified. The design procedure which combines the participation factor analysis and probability sensitivity indices is able to produce a versatile damping controller.
6. Conclusions
Probabilistic method based on numerical analysis is used to design a damping controller added to the DFIG converter to facilitate SSCI mitigation over a large and pre-specified set of operating points. A wide range of operating conditions have been considered including the random fluctuations of the load, the synchronous output and the wind farm output. The simulation results based on a modified two-area system have shown that the SSCI issues may occur while DFIG-based wind farm are connected to the power system through series compensation line. The sub-synchronous modes are identified and analyzed through modal analysis method. Two quantitative indices, (i.e., the participation factor and the probabilistic sensitivity index) have been investigated for designing the DFIG-PSS in the aspects of input signal, location and optimized parameters. To validate the proposed method, a comparison is made between the proposed probabilistic controller and the controller designed with the general small signal method. Probabilistic small signal sub-synchronous stability of the system has been much improved with the proposed DFIG-PSS without destabilizing other system oscillation modes.
7. Acknowledgments
This work was financially supported in part by "Electrical Engineering" Shanghai Class II Plateau Displine, in part by Shanghai Science and Technology Commission Project unde r grant (16020501000), and in part by Shanghai Engineering Technology Center of Green Energy Integrate Grid under gr ant 13DZ2251900.
8. References
[1] Y., B., Cheng, M., Sahni, D., Muthumuni.: ‘Reactance Scan Crossover-Based Approach for Investigating SSCI Concerns for DFIG-Based Wind Turbines’, IEEE Trans. Power Del., 2013, 28(2), pp. 742-751.
[2] R., Nath, and C., Grande-Moran, ‘Study of Sub-Synchronous Control Interaction due to the interconnection of wind farms to a series compensated transmission system’, in Proc. IEEE Trans. Distrib. Conf. Expo., 2012, pp. 1-6.
[3] L., Fan, R., Kavasseri, Z., L., Miao.: ‘Modeling of DFIG-Based Wind Farms for SSR Analysis’, IEEE Trans. Power Del., 2010, 25(4), pp.
2073 – 2082.
[4] L., Fan, C., Zhu, Z., Miao, and M., Hu.: ‘Modal analysis of a DFIG-based wind farm interfaced with a series compensated network’, IEEE Trans. Energy Convers, 2011, 26(4), pp. 1010-1020.
[5] D., H., R., Suriyaarachchi, U., D., Annakkage and C., Karawita.: ‘A Procedure to Study Sub-Synchronous Interactions in Wind Integrated Power Systems’, IEEE Trans. Power Syst., 2013, 28(1), pp. 377-384.
[6] L., Fan, and Z., Miao.: ‘Mitigating SSR using DFIG-based wind generation’, IEEE Trans.Sustain Energy, 2012, 3(3), pp. 349-358. [7] R., K., Varma, S., Auddy, and Y., Semsedini, ‘Mitigation of
sub-synchronous resonance in a series-compensated wind farm using FACTS controllers,’ IEEE Trans. Power Del., 2008, 23(3), pp. 1445-1454.
[8] B., Bak-Jensen, M., S., El-Moursi, and M., H., Abdel-Rahman.: ‘Novel STATCOM Controller for Mitigating SSR and Damping Power System Oscillations in a Series Compensated Wind Parks’,
IEEE Trans. Power Electr., 2010, 25(2), pp. 429-441.
[9] J., L., Su, L., B., Shi, L., Z., Yao, Y., X., Ni, S., Y., Qin, R., M., Wang, J., P., Zhang.: ‘Sub-synchronous resonance analysis of grid-connected DFIG-based wind farms’, in Proc.IEEE Power System Technology, 2014, pp. 2812-2818.
[10] C., Zhu, L., Fan, M., Hu.: ‘Control and analysis of DFIG-based wind turbines in a series compensated network for SSR damping’, in Proc. IEEE Power and Energy Society General Meeting, 2010, pp. 1-6.
[11] B., Zhao, H., Li, M., Y., Wang, Y., J., Chen, S., Q., Liu, D., Yang, C., Yang, Y., G., Hu and Z., Chen.: ‘An active power control strategy for a DFIG-based wind farm to depress the subsynchronous resonance of a power system’, Int. J. Electr Power. Energy Syst., 2015, 69, pp. 327-334.
[12] H., A., Mohammadpour, E., Santi.: ‘SSR Damping Controller Design and Optimal Placement in Rotor-Side and Grid-Side Converters of Series-Compensated DFIG-Based Wind Farm’, IEEE Trans. Sustain Energy., 2015, 6 (2), pp. 388-399.
[13] M., Mokhtari, J., Khazaei, D., Nazarpour.: ‘Sub-Synchronous Resonance damping via Doubly Fed Induction Generator’, Int. J. Electr Power. Energy Syst, vol. 53, no. 4, pp. 876-883, Dec. 2013. [14] Ulas, Ka., She., O., Far., Jean, Mah., Abdel-Aty, Edris.: ‘Coordinated
control of wind energy conversion systems for mitigating subsynchronous interaction in DFIG-based wind farms’, IEEE Tran. on Smart Grid., 2014, 5(5), pp. 2440-2449.
[15] Amir, Ostadi, Amirnaser, Yazdani, Rajiv, K., Varma.: ‘Modeling and Stability Analysis of a DFIG-Based Wind-Power Generator Interfaced With a Series-Compensated Line’, IEEE Trans. on Power Del., 2009, 24(3), pp. 1504-1514.
[16] Liang, Wang, Jing, yu, Peng, Yu, yang, You, Hong, wei, Ma.: ‘SSCI performance of DFIG with direct controller’, IET Generation, Transmission & Distribution., 2017, 11(10), pp. 2697-2702.
[17] A., E., Leon and J., Solsona.: ‘Sub-Synchronous Interaction Damping Control for DFIG Wind Turbines’, IEEE Trans. Power Systems., 2-015, 30(1), pp. 419-428.
[18] H., A., Mohammadpour, A., Ghaderi, H., Mohammadpour and E., Santi.: ‘damping in wind farms using observed-state feedback control of DFIG converters’, ectr Power Syst. Res., 2015, 123, pp. 57–66.
[19] G., D., Irwin, A., K., Jindal, and A., L., Isaacs.: ‘Sub-Synchronous Control Interactions Between Type 3 Wind Turbines And Series Compensated Ac Transmission Systems’, in Proc.IEEE Power and Energy Society General Meeting, 2011, pp. 1-6.
[20] Fan, L., Kavasseri, R., Miao, Z., L., et al.: ‘Modeling of DFIG-Based Wind Farms for SSR Analysis’, Power Delivery IEEE Transactions on, 2010, 25(4),pp.2073 - 2082.
[21] S., O., Faried, I., Unal, and D., Rai.: ‘Utilizing DFIG-Based Wind Farms for Damping Subsynchronous Resonance in Nearby Turbine-Generators’, IEEE Trans. Power Syst., 2013, 28(1), pp. 452-459.
11
power system with large-scale wind farm integration’, Int. J. Electr. Power Energy Syst., 2014, 61, pp. 482-488.
[23] X., Y., Bian.: ‘Probabilistic robust damping controller designs for FACTS devices and PSS’, Ph.D. dissertation, The Hong Kong Polytechnic University, 2006.
[24] X., Y., Bian, Yan Geng, Kwok L., Lo, Yang Fu.: ‘Coordination of PSSs and SVC Damping Controller to Improve Probabilistic Small-Signal Stability of Power System with Wind Farm Integration’, IEEE Trans. Power Syst, 2016, 31(3), pp. 2371-2382.
[25] M., G, Kendall and A., Stuart.: ‘The advanced theory of statistics’, vol. I. New York: Hafner, 1977, pp. 84-88.
[26] C., Y., Chung, K., W., Wang, C., T., Tse, and R., Niu.: ‘Power-system stabilizer (PSS) design by probabilistic sensitivity indexes (PSIs)’,
IEEE Trans. Power Syst., 2002, 17(3), pp. 688-693.
[27] C., Y., Chung, K., W., Wang, C., T., Tse, X., Y., Bian and A., K., David.: ‘Probabilistic eigenvalue sensitivity analysis and PSS design in multi-machine systems’, IEEE Trans. Power Syst., 2003, 18(4), pp. 1439-1445.
[28] P., Kundur.: ‘Power system stability and control’, New York: McGraw-Hill, 1994, pp. 130-157.
[29] N., Magaji, M., W. Mustafa.: ‘Optimal location and signal selection of UPFC device for damping oscillation’, Int. J. Electr Power. Energy Syst., 2011, 33(4), pp. 1031-1042.
[30] H., A., Mohammadpour, M., Islam, E., Santi, Y., J., Shin.: ‘SSR Damping in Fixed-Speed Wind Farms using Series FACTS Controllers’, IEEE Trans. Power Del., 2015, 31(1), pp. 76-86.
9. Appendix
[image:11.595.301.561.55.134.2]In the test system, G5 is a doubly-fed wind turbine generator. The block diagram of the DFIG converter controllers and cascaded control loops adopted in this paper are shown in Fig.2. The detailed parameters of G5 and the controllers are given in Table 8.
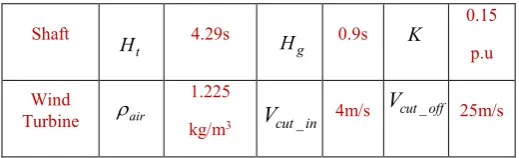
Table 8 Parameter setting of DFIG and controllers
Types
Para-meter Value
Para-meter Value
Para-meter Value
Wind Generator
r
P 1.5 MW Vr 690 V
s
R 0.0086
p.u Ls
2.2141
p.u Lm
9.6044
p.u
r
R 0.008
p.u Lr
1.9483
p.u tg
X 0.65
p.u
Converter C 0.001F VDC 1200V
Converter
Controller
0.6 80.4 0.27 5.1
1.48 219 0.27 5.1
0.012 0.054 1.2 131
1.2 131
Shaft 4.29s 0.9s K 0.15
p.u
Wind
Turbine air
1.225
kg/m3 4m/s 25m/s
Where Pr and Vr are the rated power and the rated voltage of DFIG, respectively; the subscripts ‘s’ and ‘r’ denote stator and rotor, respectively; Lmis the mutual inductance of stator and rotor; Xtg is the transformer reactance connecting the converters and the grid; Ht and Hg are half of the inertial time constant of the wind turbine and the generator, respectively;
K
is the shaft stiffness; Kp andKi refer to the parameters of the PI links of converters.
1 p
K Ki1
3
i K
7 p
K
5 p
K Ki5 Kp6 Ki6
2 p
K
3 p
K
2 i
K
4 p
K Ki4
7 i
K
t
H Hg
_
cut in