On using simulation to model the installation process logistics for
an offshore wind farm
Abstract
The development of offshore wind farms (OWFs) in Europe is progressing to sites which are character-istically further from shore, in deeper waters, and of larger scale than previous sites. A consequence of moving further offshore is that installation operations are subject to harsher weather conditions, re-sulting in increased uncertainty in relation to the cost and duration of any operations. Assessing the comparative risks associated with different installation scenarios and identifying the best course of action is therefore a crucial problem for decision makers. Motivated by collaboration with industry partners, we present a detailed definition of the OWF installation process logistics problem, where aspects of fleet sizing, composition, and vessel scheduling are present. This article illustrates the use of simulation models to improve the understanding of the risks associated with logistical installation decisions. The developed tool employs a realistic model of the installation operations and enables the effect of any logis-tical decision to be investigated. A case study of an offshore wind farm installation project is presented in order to explore the impact of key logistical decisions on the cost and duration of the installation, and demonstrates that savings of up to 50% can be achieved through vessel optimization.
Keywords: simulation, scheduling and logistics, renewable energy, maritime industry
1
Introduction
1.1 Problem context and background
The installed capacity of offshore wind energy has steadily increased in Europe over the last
five to ten years and is predicted to continue increasing over the coming years [16]. To meet
current targets OWF developments are progressing to larger sites located further from shore in
deeper waters [16], which gives rise to new challenges. These sites are exposed to more severe
weather conditions than more coastal sites, increasing the complexity of offshore operations
and the uncertainty around planning and managing these operations. In particular, the process
of installing an OWF is susceptible to these challenges, and installation and logistics have
been identified as areas where substantial cost-reductions can be achieved through innovation
[29, 1]. In this setting, two possible mechanisms for supporting innovation are: an improved
installation strategies and concepts, and an improved understanding of the economic impact
of vessel capabilities on a particular installation schedule, enabling novel vessel designs to be
validated and developments in vessel capability to be directed such that profits are maximised
for both OWF developers and installation contractors. The offshore wind industry is under
increased pressure to reduce costs in order to improve competitiveness with other energy sources
[31], and recent estimates give the installation costs as 19% of the total capital expenditure,
or approximately £0.7M/MW [1]. Enabling these innovation mechanisms therefore has the potential to develop the competitiveness of the industry.
1.2 General framework of a maritime logistics problem for an offshore wind
farm installation project
OWF installation projects will typically consider various asset-types, with a large number of
each type of asset to be installed. The most recognisable assets are the wind turbine generators
(WTGs), which are built on top of subsea foundation structures. Offshore substation platforms
(OSPs) may be included to collect and/or convert the generated power for transmission to the
onshore grid. The most viable option currently available for foundations are pile-driven jackets,
which are large metal lattice structures secured to the seabed with metal piles. The WTGs are
connected to the OSPs via inter-array cables, and the OSPs are connected to the onshore grid
via export cables. A detailed description of each type of asset and an overview of the different
stages of the OWF installation process can be found in [15].
Each asset-type is associated with a specific set of installation operations that are typically
repeated many times. Additionally, there are a number of support operations associated with
each asset-type, which prepare or complete the asset installation process. Together, these give
a large set of distinct repeated operations which must be completed. Each individual operation
has specific operational limits including daylight and weather restrictions, which are dependent
on the operation and the particular vessel used. Multiple vessels and multiple installation
techniques may be used to install each type of asset, with each vessel having unique operational
capabilities and capacities. The expected duration of each task is dependent on the particular
installation vessel used for the task, and the task duration realised in practice is subject to
uncertain weather conditions. Installation vessels may be used for the installation of multiple
asset-types and some asset installations may be supported by supply barges. Further to vessel
operational capabilities and capacities. Assessing the comparative benefits of different logistical
decisions – in terms of the impact on the length of the installation process and the net costs
– over an entire OWF installation project is therefore challenging, and the large scale of these
developments amplifies the impact of any operational decisions as these are carried-out many
times across the OWF site.
The OWF installation process problem presented here contains aspects of various existing
maritime logistics problems (see Christiansen et al.[8] for a recent review). Decisions on fleet size and composition will define how many installation vessels are employed for each category
of asset installation as well as the specific vessels utilised, where each vessel will have unique
operating characteristics. Decisions on vessel scheduling will determine how each vessel is used
in terms of the order of assets installed, start-dates for use, and any periods of unavailability.
Decisions on the ports used for loading each asset will influence the installation operations
through loading times, loading unavailability and transit times between the port and the OWF
site. The impact of each of these decisions is modelled over the installation-horizon subject
to uncertain weather conditions. Additionally, this problem is uniquely characterised by the
complexity of modelling a large number of operations which are subject to unique operational
limits with stochastic weather conditions.
The challenges in modelling this problem are largely driven by the requirement of
prac-titioners to have sufficient accuracy and usability to support decision making on these vast
installation projects, with costs spanning to hundreds of millions of GBP. Each stage of the
installation process must therefore be modelled with sufficient accuracy to be sensitive to the
potential differences related to the various aspects of the problem outlined above. In addition
to accurately representing the logical relationships between the different vessels and supporting
operations (which could typically number over 50), particular challenges include accurate
mod-elling of: (i) the uncertain weather conditions, (ii) the uncertain task durations given favourable
weather conditions, (iii) vessel failures and maintenance, (iv) operations which can be completed
in stages, (v) operations which may require weather windows longer than the expected duration
for safety reasons, (vi) the installation of different asset-types using a single port with limited
loading capacity (which prohibits the installation of the different asset-types from being
mod-elled compartmentally), (vii) groups of operations which may require installation within the
same weather window, and (viii) the various ways in which a vessel can be supported by supply
1.3 Existing literature
There are relatively few studies on the logistics of installing an OWF, and existing studies
typically consider subproblems of the problem framework outlined in Section 1.2. These studies
can be categorised as simulation approaches and optimisation approaches.
1.3.1 Simulation-based OWF installation logistics studies
In Lutjen and Karimi [24], a two-level discrete event simulation which couples a port inventory
control system with a reactive scheduling component is used to determine the effect that
differ-ent levels of invdiffer-entory have on the progress of the installation process. A relatively simplistic
model of the installation process is used, considering only a single vessel for the installation
of the turbines and their foundations, and with six operations used to entirely describe these
activities. Langeet al.[22] present a simulation tool which models the construction of an OWF from the manufacturing of components through to final installation, providing a high-level view
of the entire installation process which can identify key stages in the manufacture and supply
network that could lead to potential bottlenecks. The tool has some flexibility regarding
high-level installation process decisions, such as alternative installation strategies and the optional
use of supply barges; however, the focus of their tool is to support decisions related directly
to the supply chain, and as such the presented modelling of offshore operations is relatively
simplistic. Stempinski et al.[37] consider the scheduling of installation operations for tripod turbine foundations. The main focus of their paper is a detailed engineering investigation of
this operation, in order to accurately parameterise the limiting weather conditions which are
used to simulate the installation. The installation schedule is limited to the pre-determined
schedule of a single installation task (installing tripod foundations) with a single installation
vessel. Recently, Muhabie et al.[27] present a high-level discrete-event simulation model for OWF installation, with only 10 different operations used to entirely model the installation of
turbines and foundations. The model appears to consider three installation vessels (each
in-stalling one type of asset), supported by a supply barge which has transits modelled as having
no duration or weather limits. Morandeauet al.[26] present a general purpose simulation-based tool to model the progress of offshore operations to install marine energy sites. Their tool,
referred to as Mermaid, is demonstrated for the installation of 10 tidal energy arrays using a
single installation vessel in four phases of sequential operations (related to piles, foundations,
infor-mation is provided, however, on the modelling approach to these operations, and the flexibility
and accuracy with which this tool could be expected to model a large-scale OWF installation
project as presented in Section 1.2. It should be noted that since publication of their paper,
the Mermaid tool has been released commercially [25].
Various approaches are taken to model the uncertain weather conditions in these studies. A
deterministic approach is presented in [24] which assigns appropriate vessel loads and operations
using forecast weather conditions, with five categorical weather states considered; however, this
is reliant on accurate forecasts, and five weather states would not be sufficient to model the
full range of weather restrictions which would be required. In [22] successive weather states in
time are modelled using Markov chains; however, this approach would potentially increase the
uncertainty of the model. For example, generating realistic weather conditions which accurately
capture aspects such as seasonality, correlation between wind and wave conditions, and the
fluctuation of conditions throughout a day would require the specification of various probabilities
which would be difficult to define, and as a result accurately modelling the sequential completion
of a series of offshore tasks with different weather limits would be challenging. A probabilistic
assessment of weather downtime is used in [37] to scale the expected duration of each task
and generate the total schedule duration, which is recognised by the authors to provide an
optimistic duration due to the capability of this approach at handling the sequential completion
of a series of offshore tasks with different weather limits. This deficiency is addressed in [27]
by incorporating conditional probabilities to model the completion rate of successive tasks with
greater accuracy; however, in practice every vessel operates by completing extended sequences
of successive tasks, and developing accurate conditional probabilities to model this behaviour
would be challenging. Several of these studies also model the uncertain weather conditions using
a time-series model based on historical weather data (see [37, 27, 26]). Whilst conceptually
similar to our approach, this method is limited to the number of years of recorded weather data
available, and as such would be unlikely to represent the true probabilistic range of weather
conditions which could realistically be expected in a given year.
Based on the information available in these studies, it is our opinion that neither the level of
fidelity available with these methods to model the installation process, nor the robustness with
which the uncertain weather conditions can be modelled, would be capable of providing the
level of accuracy which would be required by developers to support the high-cost installation of
1.3.2 Optimisation-based OWF installation logistics studies
Optimisation-based approaches focus specifically on the scheduling of installation vessels. The
most recent and detailed study is of Irawan et al.[19], where a bi-objective optimisation model minimises the cost and duration of the installation process with three types of asset
(substruc-ture, turbine topside, and inter-array cables). The authors propose an exact solution approach
with compromise programming and a metaheuristic approach, and computationally test these
on problems with up to 120 turbines and 10 installation vessels, a realistic size for the problem
outlined in Section 1.2. However, substantial simplifications of the installation process are used
in the paper, including but not limited to assuming sequential operations for all vessels,
deter-ministically handling daily weather forecasts, and allowing on-demand hires of vessels (when in
practice most vessel contracts are agreed far in advance). In earlier studies, Scholz-Reiter et al.[33] and Ait-Alla et al.[2] propose mixed-integer programming models for short-term vessel scheduling, considering small-scale problems with up to 10 installation operations, 30 turbines,
3 installation vessels, and 3 scenarios. In comparison, the scheduling aspects of the problem
outlined in Section 1.2 are substantially more complex, and hence it is unlikely that these
ap-proaches would scale effectively to real-world problems. All three papers represent weather data
in categorical states, supplied to the models as deterministic inputs.
1.3.3 Positioning the OWF installation logistics problem within wider literature
In a more general context, two areas of maritime logistics research which have some degree
of similarity with the OWF installation logistics problem outlined in Section 1.2, are problems
related to OWF operations and maintenance (O&M) logistics, and problems concerning offshore
support vessels (OSVs) for the oil and gas (O&G) industry.
In comparison with the OWF installation logistics problem, O&M logistics problems for
OWFs have received considerably more attention in the literature. As with the installation
problem, both simulation and optimisation approaches have been proposed to tackle the O&M
problem, and Shafiee [34] provides a recent overview of the O&M logistics problems for OWFs
and the approaches which have been considered to-date. There are similarities between the
OWF logistics problems for installation and O&M, particularly with respect to fleet-sizing and
fleet-composition considerations, as in each case a number of tasks with different operating
restrictions must be completed subject to uncertain weather conditions, and these tasks may
that the required tasks are determined by asset failures which occur randomly throughout an
OWF site, that the number of different maintenance tasks which may be required is relatively
small (particularly from a vessel scheduling perspective), and that there is unlikely to be any
precedence relationships between a given pair of O&M tasks, so that each task could potentially
be completed independently from the other. As a result, the nature of the O&M scheduling
problem is very different to the scheduling aspects of the OWF installation logistics problem.
In their latest review of the ship routing and scheduling literature, Christiansen et al.[8] include a review of the small number of studies concerning OSVs for the O&G industry. More
traditional maritime routing and scheduling problems typically require that one or more vessels
transit between locations, where each transit is completed subject to specific weather
restric-tions, and weather conditions are stochastic in nature. The O&G OSV problems increase the
modelling complexity by considering different kinds of task (typically a transit task and an
off-shore operation) which must be completed subject to uncertain weather conditions, and where
each type of task may have different operating restrictions. As with the O&M logistics
prob-lems for OWFs, the O&G OSV probprob-lems are therefore similar to the OWF installation logistics
problem in that each problem requires that a sequence involving different tasks is completed at
various locations subject to strict operational restrictions specific to each task, and different in
that the O&G OSV problems typically consider a small number of different tasks and different
operating restrictions, in comparison to the large number of different tasks which may comprise
the OWF installation process.
1.4 Outline of this paper
The objective of this study is to design and develop a discrete-event simulation model of the
OWF installation process as outlined in Section 1.4, in order to provide decision support to
OWF developers at the planning or bidding phase of an installation project. This simulation
model is purposefully designed to provide an accurate representation of the installation process,
enabling alternative logistical installation decisions to be assessed and compared in terms of the
expected duration of each phase of the installation process and the resulting impact on costs,
such that the high-cost decisions related to the installation process can be supported. This
tool has been fully developed and implemented in Matlab and is currently being used by our
industry partners (see Section 5 for further information).
of the uncertainties related to the cost and duration. This enables evaluation of a given
instal-lation scenario modelled over the entire planning-horizon, in addition to factors such as: the
impact of changes to fleet size, fleet composition, vessel schedules, port selection and changes
to installation costs including vessel, port and crew rates.
Simulation is widely used in practice as a methodological approach to operational research
problems where the complexity of the problem structure, the input variables, the output
vari-ables, or the demands of the client are such that an analytic approach would be difficult to
achieve (see for example [28, 38, 41]). In the OWF installation problem considered here, the
number of operations which must be completed, the diversity of the operations considered, and
the necessity to gain a realistic understanding of the impact of uncertain weather conditions,
task durations and vessel failures each contribute to the complexity of the problem.
Further-more, the intention of this study is to provide a means to evaluate and compare the numerous
logistical decisions considered during the planning of an OWF installation campaign. These
decisions will represent the viable alternatives available for a given stage of the installation and
the experience of the OWF developers. Given these considerations, a simulation approach is
employed here.
The remainder of this paper is structured as follows: Section 2 outlines the OWF installation
process model and Section 3 describes the simulation and weather models; these are employed
to investigate the impact of logistical decisions for a case study OWF in Section 4, and
discus-sion of a real-world application is provided in Section 5, with concludiscus-sions and areas for future
development provided in Section 6.
2
Problem description and modelling considerations
2.1 Industrial setting
The installation process model used here was developed through close collaboration with experts
from three companies with direct experience of the European OWF industry: SSE Renewables,
Scottish Power Renewables and Technip Offshore Wind Limited. Each company provided at
least two experts, whose job titles included, for example, Head of Installation and Logistics,
and Head of Offshore Marine and Construction Engineering. The installation process model
presented here is focused on the next phase of OWF developments, which will be located further
are to be developed in the near future the focus was on proven installation methods which would
realistically be considered by a developer today, rather than immature techniques and technology
which represent a higher risk. As such the model presented in detail below is representative of
the current industry practices and experiences.
A series of workshops with the industrial collaborators were held to iteratively develop the
installation process model. The development process largely followed the facilitated simulation
modelling approach presented by Robinsonet al.[32]. Developments to the model were proposed by the industry collaborators, and accepted or rejected following detailed discussions on the
impact of these with respect to model accuracy and fidelity, coding implementation time, and
computational run time. This iterative process defined all aspects of the model, including the
model-scope, the level of detail required to model the various installation operations, and the
number of weather parameters which would be considered in the model. The resulting model is
therefore designed for and by practitioners to support the key decisions during an installation
project.
2.2 Model scope
The installation model developed here is intended to cover all operations specifically related
to the process of installing an OWF and is centred on the key assets identified in Section 1.2.
For each asset the scope of the installation process model is focused on installation operations,
and consideration is given to the natural, practical and contractual bounds to the installation
which have been identified by industry experts and are outlined below. It is assumed that
the manufacturer and model of each asset has been decided prior to the start of installation,
and that the locations of each OSP and WT, the paths of all cables, and the location of
onshore substations are all known prior to installation. Management of the asset supply-chains
is considered to be outside the scope of this project; however, the supply rate of some assets
is identified as an important consideration in modelling the installation. Each category of
asset is therefore assigned a fixed arrival rate which takes all aspects of the supply chain into
consideration and assets can only be installed or assembled after arrival.
Each asset installation is considered from the arrival of assets at port prior to final transit
to the OWF site. Installation vessels are considered from mobilisation at the vessel base port
through to demobilisation. The installation operations are defined to cover all operations until
when the WTGs and OSPs go online.
Assumptions of the installation model include: the minimum time-step of the analysis is
one hour, the distance between any two locations site is equal, the water depth at each
on-site location is equal, and that perfect weather forecasting is possible such that a given weather
window can be fully exploited as appropriate. Additional assumptions related to the installation
operations, vessel and barge use, maintenance and costing are provided in Sections 2.3-2.5.
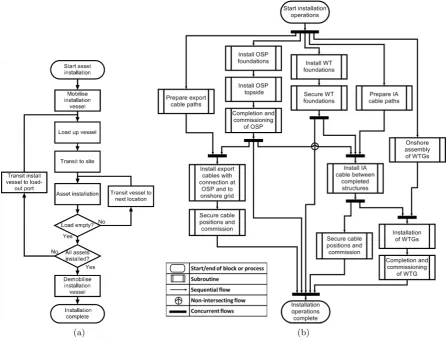
(a) (b)
Figure 1: (a) Flowchart for a standard OWF asset installation process, and (b) High-level schematic of relationship between the different OWF asset category installation processes
2.3 Installation operations
The OWF installation process is partitioned into a number of installation operations, with each
operation potentially comprising a number of smaller tasks. An installation operation is defined
as a key stage of the installation process, and subsequent operations should be characterised by
different operational limits or considerations.
[image:10.595.72.519.216.556.2]in-stallation of each of the key assets follows a similar approach. Each inin-stallation operation is
defined in terms of duration, weather and daylight restrictions, and in cases where the operation
can be completed in stages the minimum weather window required for each stage is included.
Even under perfect weather conditions there will be some natural variation in the duration of
each installation operation. The triangle distribution has been recognised for many years as an
appropriate probability distribution to model uncertain activity durations in project
schedul-ing problems [40], and remains one of the standard methods used for this purpose in the OR
literature (see for example [17, 18, 35]). This is the approach taken here, as only the minimum,
mode and maximum durations are required, which are relatively straightforward to elicit from
experts.
Installation operations must be completed in the required order at each location, and
in-stallation of each category of asset proceeds from an activation date, subject to the completion
of preceding operations. Where multiple vessels install the same type of asset, each vessel may
be designated a unique set of operations for installation. To reflect operations which may be
closed down over winter months there is the option to define seasonal downtime.
An OWF installation process will adhere to a series of precedence relationships between the
various categories of asset and within each category. Many of these relationships are standard
for OWF installation projects and represent the logical order in which each asset is practically
installed; these are displayed in Figure 1b. Each subroutine shown in Figure 1b represents
several installation operations, as defined previously, and in several cases installation subroutines
cover installation operations for multiple assets. The flow portrayed in Figure 1b defines the
order in which operations must be completed for a single structure (WT, OSP or cable), and
in reality all subroutines will be performed in parallel whilst preserving this order on each
structure.
2.4 Installation vessels and support vessel spread
The model enables the installation process of each category of asset to be performed by one
or two installation vessels. This is representative of the realistic choices available to a decision
maker, with the use of three installation vessels considered to be impractical in a real-world
in-stallation project. Each inin-stallation vessel is uniquely defined in terms of operational capability
– the time required to complete each task and the weather and daylight restrictions which would
vessel is activated through its mobilisation date and will proceed to install all required assets
subject to preceding operations, with transit between locations and reloading as presented in
Figure 1a. Upon installation of the final asset, a vessel will transit back to port before beginning
demobilisation operations. Installation vessels are assumed to be capable of remaining offshore
indefinitely, with factors such as the replenishment of water and fuel assumed to be addressed
opportunistically as required, without impacting on the installation schedule.
The installation of some assets can optionally be supported by supply barges, with any
number of supply barges potentially utilised. For practical and safety considerations, supply
barges can only be used for the installation of a specific subset of asset categories. Day-rates
for supply barges include vessel and crew costs as well as the use of tugs. Supply barges can be
used for the installation of multiple categories of asset if desired.
Unexpected vessel and equipment breakdowns can either be included explicitly through the
probability of failure for each asset installation vessel and each supporting operation subroutine,
or implicitly by defining a percentage increase to the expected duration of each installation
operation. Additionally, pre-scheduled maintenance operations can be included by defining
periods of vessel unavailability at the outset of the installation.
2.5 Modelling of cost and revenue
The installation costs are derived from a combination of the day-rates and mobilisation rates
of all installation and support spread vessels used, all port costs and the costs of all installation
technicians and vessel crews. All costs can be calculated directly from the installation durations.
Vessel day-rates are highly volatile in practice; however, long-term vessel charters will typically
agree fixed prices for the duration of the contract. As the model presented here is intended to
support planning decisions, the uncertainty in vessel day-rates is not captured explicitly, and
costs for each vessel are assumed to remain constant throughout the installation project. The
capital expenditure on installation operations is offset by the rate at which WTs come online
and begin to generate energy and produce revenue. It is imperative for an OWF developer to
understand and exploit the expected relationship between expenditure and production over the
2.6 Model validation
The structure of the installation process model presented in Sections 2.2-2.5 was extensively
validated through a series of workshops held after each stage of model development. Each
industrial partner confirmed the logical structure and its applicability to existing and future
OWF sites, and the varied experience of the collaborators ensures that the capability of the
model supports the decision making requirements during an OWF installation project. Note
that verification of the simulation model outputs is discussed in Section 3.2.2.
3
Methodology
3.1 Weather time-series modelling
As highlighted in Section 1.2, the diversity of installation operations included in the model of
Section 2 requires a comprehensive representation of the weather uncertainties and their impact
on the installation. Synthetic weather series are time series of weather conditions generated
from statistical analysis of historical weather data sets. Weather data is routinely collected on
an OWF site over several years prior to installation, as understanding the expected weather
conditions is of fundamental importance in estimating the generating capability of a site. The
method used here to generate synthetic weather time-series is a correlated autoregression model,
which follows the approach taken by Dinwoodie and McMillan [11] for the simulation of OWF
maintenance operations. The weather conditions taken into consideration here are significant
wave height and wind speed, which were identified by the industry partners as the most
influ-ential factors on offshore operations. Additional factors such as wave period and current speed
will only impact specific operations, and to maintain tractable computation times these are
not currently modelled. Autoregression identifies the underlying trends as a data-set changes
over time, and exploits these trends to predict future behaviour of the data-set. The existing
historical data-set is analysed to define the extent of the dependency on previous data-points
such that the closest fit to the existing data-set is produced. Future data-points are then
gen-erated iteratively using the same dependency relationships. Employing synthetic weather series
requires more computational effort prior to running the simulation than would be required with
a categorical weather model; however, these time-series provide a realistic assessment of the
ability to meet operational limits for the required durations in a sequence of installation tasks.
in complex systems, where the uncertainty in output parameters cannot be expressed in terms
of analytical functions of the input parameter uncertainty (see [13] for a recent text on Monte
Carlo methods and their applications). In particular, Monte Carlo simulations have been at the
heart of numerical weather prediction since the 1950s, and remain a fundamental component of
modern weather forecasting [5] and modelling of systems subject to uncertain weather conditions
[3, 30, 39]. Monte Carlo simulation of the weather model is used to generate many realisations of
synthetic weather time-series, each of which are statistically representative of the characteristic
properties of the historical data set.
3.2 Simulation of the installation scenario
3.2.1 Discrete-event simulation model
The simulation model combines the logical model discussed in Section 2 with the synthetic
weather time-series model discussed in Section 3.1. Discrete-event simulation is a natural
ap-proach to model the OWF installation process and is the method used here; see [6] for a recent
text on discrete-event simulation, and [10, 14, 20] for recent applications to model engineering
systems.
A multi-threaded discrete-event simulation model is developed to represent the OWF
instal-lation process. Each instalinstal-lation vessel, supply barge, and support operation is represented by
a separate thread, and each thread of the simulation therefore models the progress of a unique
sequence of operations. Threads may progress in parallel subject to various logical constraints
defined through the installation model of Section 2; these logical constraints represent factors
such as the practical order assets are installed in and the synchronisation of installation vessels
and supply barges, where appropriate. Each thread maintains a clock which records the time
transpired since the global start of the installation project. The state of the model represents
the current clock for each thread, the current progress of the installation for each WTG, OSP,
and cable location, the location of each vessel and barge, and the current number of assets
carried by each vessel and barge.
The OWF installation is simulated through a series of distinct events, where each event
represents a particular sequence of operations which are carried out by the same thread(s).
Events are characterised as pre-installation operations, in-port installation vessel or barge
op-erations, on-site installation vessel or barge opop-erations, and post-installation opop-erations, and
The first stage of the simulation completes the pre-installation operations for all assets, as these
can be grouped according to asset-type and each group is then completed independently. The
remainder of the simulation iteratively selects a thread associated with an installation vessel or
barge and completes the relevant operations. Selection is determined through a priority queue,
where the level of priority is determined from the time of the thread clock and the
satisfac-tion of various constraints to ensure the logical structure of the installasatisfac-tion model is adhered
to. Furthermore, priority is given to earlier operations in the sequence displayed in Figure 1b
and installation vessels are prioritised over supply barges, in order to reduce the computational
burden of processing constraint violations. The particular sequence of operations completed in
each iteration is dependent on the selected vessel or barge, its current location, current cargo,
and the associated type of asset. Each port may be utilised by multiple vessels and barges
installing multiple types of asset, and as each port has a maximum capacity of vessels or barges
which can simultaneously be loaded, the available capacity of a port must be updated following
each set of in-port operations. The priority queue selection process for threads is necessary as
a result of this factor, as otherwise each thread could be progressed independently.
Installa-tion vessels supported by supply barges are removed from the global priority queue once they
are on-site, and supply barges arriving on-site are synchronised with an installation vessel
se-lected from a local priority queue consisting only of the installation vessels for the appropriate
asset-type. Upon the completion of events characterised as on-site operations, a sequence of
post-installation operations are triggered, dependent on the type of asset in question.
A particular installation scenario for an OWF generates a unique set of installation
oper-ations and the precedence reloper-ationships between these, in addition to the defined duroper-ations,
operational limits and sequencing of the required installation operations. The rate of progress
of each thread in the simulation model is then calculated for each synthetic weather series
gener-ated through the Monte Carlo simulations, subject to random vessel failures and uncertain task
durations, with the minimum time-step of the analysis defined as one hour. A contingency-time
factor can be included which increases the required duration of the weather window to complete
a particular operation. The detailed breakdown of operations expressed through the model
de-livers an accurate assessment of the progress of each thread of the simulation, and taken over a
large number of weather series the simulation tool is therefore capable of providing an accurate
3.2.2 Inputs and outputs of the simulation model
As the model presented in Section 2 provides a detailed representation of an OWF installation
process it is necessary to populate the simulation model with a detailed description of the
entire installation process. Inputs to the model should define expected durations, minimum
operational durations and weather and daylight operational restrictions for each installation
operation, with distinction between multiple installation vessel use and supply barge use as
appropriate. Additional information required includes average day rates for vessels and staff,
average increase in durations due to maintenance, carrying capacity of each installation vessel
and barge, arrival rates for each category of asset and activation dates for installation operations
related to each asset category.
The nature of the simulation tool enables a wide variety of outputs to be produced, with
detailed analysis of many aspects of the installation process possible. The outputs will generally
originate from probabilistic measures which are calculated from the data generated across all
simulations.
Probabilistic performance measures which can be used to evaluate an installation scenario
include the mean and maximum cost and duration of installation and corresponding magnitudes
of any delays experienced during installation. Each of these measures can be calculated for the
entire installation process or calculated for a single asset category. Additionally, these could
be calculated for a specific category of asset installation operations, such as the operations
performed by a particular installation vessel, to provide a detailed breakdown of operations.
Delays are recorded as any time-periods where a particular category of asset installation
opera-tions cannot proceed due to an incomplete preceding operation, or due to inoperable weather or
daylight conditions, or insufficient weather window length. Following the recommendations of
the industry partners, additional outputs of the OWF installation scenario simulation include
details on installation milestones such as first OSP activation, first WT activation and 10% of
WTs activated, and the progress of each asset installation. These outputs are an important
consideration to an OWF developer for two reasons: firstly, an active wind farm produces
prof-its through electricity generation, and so the quicker a site is partially or completely online
the more profitable the lifetime costs of the site will be; secondly, a given OWF may have
pre-defined obligations which are designated by government as part of the planning-approval
process. Targets such as the first date of exported power or the date of site completion must be
of whether these obligations will be met.
Due to commercial sensitivity it has not been possible to publicly verify the outputs of the
simulation tool. The tool has been tested internally by the industry partners, however, with
positive feedback on the accuracy of the outputs. Additionally, the outputs of the model have
been independently validated against an industry standard tool.
4
Illustrative case study
A fictional OWF installation campaign case-study has been developed through close
collabo-ration with the industry partners, and is designed to be representative of the next phase of
European OWFs. This case study was developed with the dual purpose of demonstrating the
capability of the tool, and of evaluating the performance of the tool on a realistic problem.
The input parameter values were provided by the industry partners based on their combined
experience from previous OWF installation projects; however, these inputs are entirely generic
and do not correspond to any specific OWF. The site is located in the North Sea 80 Nautical
Miles (NM) off the East coast of the UK with an average water depth of 50 m. The site has
84 6 MW turbines giving a total of 504 MW generating capacity, one OSP with two export
cables, and 89 inter-array cables. An OWF of this size can require in the region of 5000 input
parameters to be specified.
To demonstrate the potential decision support provided by the simulation tool, three
dif-ferent decision analysis problems are investigated. In Section 4.1 the entire installation process
is modelled for a given installation scenario to obtain an understanding of the expected costs
and durations of installation. In Sections 4.2 and 4.3 fleet sizing and vessel scheduling are
respectively explored in the context of the WTG jacket installation vessels.
The fleet sizing investigations consider the use of either one or two installation vessels. The
number of supply barges used in each case is investigated to enable the best performance in
terms of cost and duration. For the vessel scheduling investigations, the start-dates for the
jacket installation vessels and barges are varied with respect to the start-date of the preceding
operations – in this case the pile installation process. Each set of input parameter values defines
a unique installation scenario, and varying the selected parameters – the number of vessels or
barges used, or the start-date of operations – gives rise to a set of installation scenarios in
which minimises capital expenditure and maximises the installation rate so that revenue from
generation can be obtained. Installation scenarios are therefore compared in terms of installation
costs and duration and progress of installation. Data from the FINO1 weather station [7] is
used to generate the synthetic weather series.
Each installation scenario considered is investigated over N simulation runs, where N is
taken to be sufficiently large to provide a robust assessment of the scenario subject to the
modelled uncertainties whilst providing a tractable computation time. The total duration of
working days is representative of all aspects of installation, and the robustness of the simulation
output can therefore be assessed according to performance measures of the total duration found
across all N simulations. A test installation scenario of the case study OWF was simulated;
running 1000 simulations was found to identify both the mean and median total durations with
at most 1% error at a confidence level of over 99.99%, following the approach given in [23] with
the confidence interval for the median found as in [9]. Furthermore, it can be shown [9] with
99.99% confidence that 98.83% of all potential simulated total durations lie within the range
of durations obtained after 1000 simulations. The simulation tool is implemented in Matlab
R2014a, with inputs and outputs provided through a Microsoft Excel user interface used by our
industrial partners. Performing 1000 simulation runs for the chosen installation scenario takes
3.5 hours on a 3.4 GHz dual-core processor with 8 GB RAM on a 64-bit Windows operating
system, which is deemed to be tractable for the anticipated application of this method in
practice. In the results presented in Sections 4.1-4.3 the number of simulations, N, is therefore
set to 1000.
4.1 Analysis of an installation scenario over the entire installation process
horizon
The entire installation process is modelled for a specific installation scenario to provide an
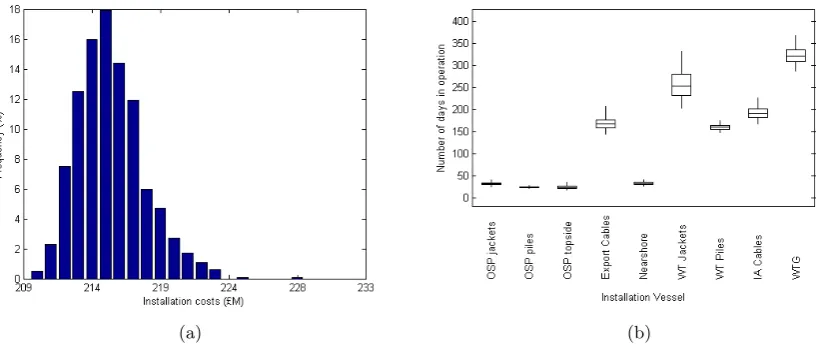
understanding of the variation in costs and duration. Figure 2a shows the frequency
distri-bution of the costs of the installation process and demonstrates the potential variance which
can be expected. The median total cost of installation is £233.89M with a standard devia-tion of £11.80M (approximately 5%), and 95% of costs found are contained within the range (£216.28M,£262.19M), or (−7.53%,+12.10%). In Figure 2b the durations for each asset instal-lation vessel are shown as box plots, with the range covering 95% of each distribution. Both
the median values are less likely than substantial increases. The 95% ranges found in each case
are relatively tight around the medians; however, there is reasonable probability for deviations
in the order of tens of millions of GBP. This indicates that a developer would be justified in
attempting to reduce any uncertainties in the input parameters, where possible, in order to
reduce the risk of substantial deviations from the predicted median values. The duration of the
WT jacket installation operations is shown to have a comparatively high level of uncertainty,
which motivates further investigation of these tasks in the following sections.
(a) (b)
Figure 2: (a) Frequency distribution for the total cost of installation, and (b) box plots of the duration of each installation vessel, for the selected scenario
4.2 Fleet sizing for the turbine jacket installation vessels
With the WT foundations installed through a pre-piling approach, installation of a WT jacket
at a given location is dependent on the pile installation process being completed beforehand.
In this investigation, the jacket installation process is therefore started one year after the pile
installation process to avoid any delays from the piles, so that comparisons between the different
fleet sizes are equitable and performance is based purely on the number of installation vessels and
barges used. The mobilisation of supply barges is managed such that the installation vessel(s)
will not be delayed by waiting for supply barges to arrive on-site for the first time. The costs
and duration from using one jacket installation vessel with various numbers of supply barge in
support are displayed in Figure 3. The overall trend in Figure 3a indicates that the number of
barges used will impact on costs, with the median costs minimised for the three barge scenario.
In Figure 3b the overall trend indicates that using more supply barges will reduce the median
[image:19.595.90.501.245.417.2]the median duration.
A more robust investigation of these results is performed using Kruskal-Wallis post-hoc tests
[21], to identify if statistical differences exist between the medians shown in Figure 3. This is
followed by applying Dunn’s multiple comparisons test [12] to identify which scenarios are
statis-tically different. This process reveals that at the 1% significance level there is sufficient evidence
to suggest that the median cost obtained for the three-barge scenario (£58.55M) is statistically different to the median costs obtained for the two- and four-barge scenarios (£65.72M and
£59.25M, respectively). At the 1% significance level there is found to be insufficient evidence to suggest that the median durations found with between four and eight supply barges used are
statistically different; however, there is sufficient evidence to suggest that the median duration
found with four supply barges (279 days) is statistically different to the median duration found
with three supply barges (291 days).
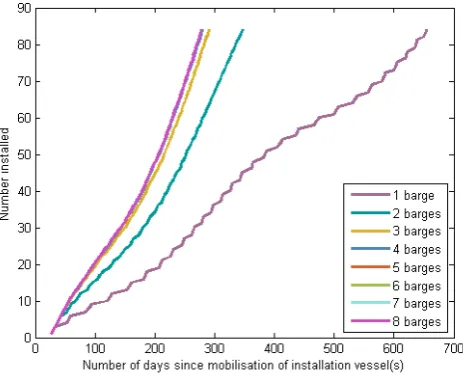
Figure 4 plots the progress of the installation process for each barge scenario and
demon-strates that the behaviour shown in Figure 3b is replicated throughout the entire installation –
as the number of supply barges used is increased up to four, progress continues to improve, with
further increases providing limited benefits. Taking both cost and duration into consideration,
the use of either three or four supply barges performs well, with the respective medians shown
to be statistically different at the 1% significance level for both cost and duration. The four
barge scenario reduces the average installation process duration by 12 days while costs increase
by £700k on average in comparison with the three barge scenario. Provided with this informa-tion an OWF developer would be able to select the best scenario based on the demands and
requirements of an individual project.
The use of supply barges supporting two jacket installation vessels is investigated in a
similar way. The impact on cost and duration is shown in Figure 5a and 5b, respectively,
with similar trends to those shown in Figures 3a-3b. Analysing the costs reveals that there is
insufficient evidence to suggest that the medians found with six, seven or eight supply barges are
statistically different at the 1% significance level; however, there is sufficient evidence to suggest
that these median costs (£79.98M-£81.25M) are statistically different to those found with five barges and with nine barges (£83.36M and£82.79M, respectively) at the 1% significance level. Furthermore, at the 1% significance level there is found to be insufficient evidence to suggest that
the median durations with between eight and 13 supply barges used are statistically different,
(a) (b)
Figure 3: Boxplots showing the distribution of jacket installation process (a) costs, and (b) durations, for one installation vessel supported by between 1-8 supply barges
Figure 4: Average progress of the jacket installation process as the number of supply barges used to support one installation vessel is varied
barges (186 days) is statistically different to the median duration when seven supply barges are
used (190 days). From this analysis, the eight supply barge scenario arguably provides the best
combination of both median cost and duration, with no other scenario providing statistically
significant improvements.
4.3 Vessel scheduling
The final stage in the management of the jacket installation operations is to determine an
appropriate starting date for installation. In Section 4.2 jacket installation starts one year after
[image:21.595.180.412.323.511.2](a) (b)
Figure 5: Boxplots showing the distribution of jacket installation process (a) costs, and (b) durations, for two installation vessels supported by between 8-13 supply barges
OWF developer would seek the best starting date for jacket operations such that a combination
of minimal delays from piling and earliest completion of jacket operations is achieved. To
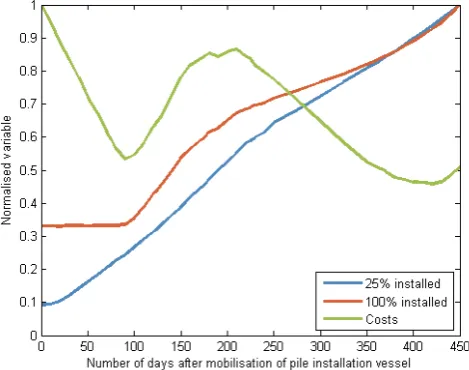
investigate this balance Figure 6 shows the normalised costs and completion dates to install
25% and 100% of jackets, for the jacket installation scenario with two vessels supported by
eight barges, as the start date for jacket operations is varied relative to the start date of the pile
installation operations. There are two factors which can explain the behaviour of the costs and
Figure 6: Average installation process costs and duration at 25% and 100% of jackets installed, as the mobilisation date of two jacket vessels and 12 barges is varied
durations shown in Figure 6. The first factor is that the average installation duration for a WT
jacket is quicker than that for the piles at a given WT location. Starting the jacket installation
[image:22.595.177.412.467.652.2]will incur unnecessary costs as the jacket installation vessels and barges are frequently inactive.
The second factor is that offshore operations during the winter months are exposed to harsher
weather conditions whereas operations during summer months are subject to more favourable
conditions. From Section 4.2 the duration of jacket installation is approximately 6-7 months,
and appropriate scheduling of installation can therefore exploit the summer conditions whilst
largely avoiding winter conditions.
For the installation schedule investigated here the pile operations commence on April 1st.
This date represents the start of the financial year and enables installation operations to
capi-talise on the favourable weather conditions over the summer months, and would therefore be an
appropriate choice. Starting jacket operations at the same time incurs many delays and gives
high costs, but gives the earliest possible completion date. Up to approximately 90 days the
jacket installation process is still delayed by the piles, finishing as soon as possible once piles
are completed; however, starting later reduces delays and therefore reduces costs. Beyond 90
days the delays due to pile installation become less prominent; however, delays due to weather
conditions begin to influence operations. The jacket installation is no longer restricted by the
pile installation, and a later start date will therefore lead to a later completion date. A jacket
start date approximately 90 days after the pile start date is at the start of July; by this point the
installation period has less overlap with the spring-summer months and begins to cross into the
winter months, resulting in increased weather delays. Starting jacket operations later increases
the exposure to winter conditions and reduces the opportunity to exploit summer conditions.
Weather delays therefore increase, causing increases to costs and increases to the rate-of-change
of completion dates. Beyond approximately 210 days, which gives a jacket start date in
Oc-tober, exposure to winter conditions begins to decrease with increasing exposure to summer
conditions. Delays due to weather start to decrease beyond this date, reducing installation
costs and reducing the rate-of-change for the completion dates.
The optimal strategy should minimise delays due to the pile installation and minimise delays
due to weather conditions, and Figure 6 indicates that there are two potential choices to achieve
this. Starting jacket operations approximately 90 days after pile operations is sufficient to
avoid delays due to the pile installation, and seems to avoid substantial delays due to weather
conditions. Alternatively, both types of delays can be minimised by starting jacket operations
the year after pile operations, with a start date approximately 420 days later. This would
The second option would give the overall least cost, whereas the first option would be slightly
more expensive but would enable jacket operations to be completed substantially quicker. The
information provided in Figure 6 would enable an OWF developer to compare the various
starting dates and decide which is most appropriate for their particular installation project.
5
Application in practice
The case study presented in Section 4 was created in collaboration with industry partners to
test the capability and illustrate the benefits of the tool. Furthermore, the tool has been used
in practice by one industry partner to support logistical decision making on a current OWF
installation project. SSE Renewables (a subsidiary of SSE, a leading UK energy firm) are the
majority owner of the Beatrice offshore wind farm, which is currently under development and
will be situated off the North-East coast of the UK. The Beatrice wind farm is expected to
span approximately 131 km2 with almost 600 MW generating capacity, and comprise 84 WTGs
and two OSPs [36]. The Beatrice project is currently in the planning phase of development,
with offshore installation operations expected to begin in 2017 and final completion expected in
2019. To support decision making for the logistical planning of the Beatrice installation, SSE
Renewables have utilised the installation simulation tool presented here.
The tool was employed from the earliest stages of the planning and scheduling process
to develop an installation schedule for which the uncertainty regarding the various stages of
completion were investigated in detail, and the associated risks of over-run and bottlenecks
analysed, characterised, and ultimately mitigated where possible. Rather than starting from an
existing schedule and seeking to improve this, logistical installation decisions were iteratively
explored and fine-tuned by providing a detailed analysis and comparison of alternative decisions.
Due to commercial sensitivity it is not possible to provide full details of the work carried out
to-date; however, the investigations were similar to those presented in Section 4, and decisions
investigated include the selection, operation and use of alternative installation vessels, and
the scheduling of different stages of the installation. The fidelity provided by the simulation
tool enabled alternative installation methods to be compared, where each method consists of
alternative operations, their durations and weather limits, and the particular sequence in which
they are performed. The tool allows each method to be analysed in context throughout an
would be challenging without this tool.
Impact for SSE Renewables from using this tool has been realised in two ways. First, the tool
provided the company with a means to challenge and refine the installation methods and
sched-ules submitted by subcontractors during contract negotiations. This yielded lower expenditure
and financial risks and SSE Renewables have estimated that the use of this tool has delivered a
saving of approximately 14% (tens of millions of GBP) of the installation costs. Second, the tool
has enabled SSE Renewables instill confidence in their regulators and investors by presenting a
methodically interrogated installation plan, in conjunction with a suite of “what-if” scenarios
and accompanying analysis. Gaining this confidence plays a major role in determining whether
or not the Beatrice wind farm is awarded final investment to proceed with the installation, and
ultimately deliver a valuable generating asset to the company.
6
Conclusions and further work
This paper presented a discrete-event simulation tool designed to provide decision making
sup-port to OWF developers. The tool was developed through collaboration with three companies
involved in OWF installation and combined a realistic model of the installation process with a
synthetic weather-series model. This combination enabled the comparative risks and benefits
of a wide variety of logistical installation decisions to be identified. The capability of the tool
was demonstrated on a fictional case study, designed to be representative of the next phase of
European OWF developments, by exploring various logistical installation decisions and
identi-fying their impact on the installation cost and duration. Furthermore, the utilisation of this
tool to support logistical decision making for a real OWF installation project was discussed.
This simulation tool supports OWF developers with logistical installation decisions at the
planning or bidding phase of an installation project. In parallel to this tool, the project has
developed a complimentary decision support tool which can be employed by OWF developers
during the course of an installation project to identify appropriate reactions to disruptions to the
installation schedule [4]. This work develops an optimisation model of the OWF installation
which combines a rolling horizon model with a robust optimisation model. By restricting
the scope of the decision space and installation model to the existing state of the installation
and realistic decisions which would be pursued, this optimisation tool is capable of providing
work presented here.
During the course of this project several areas of decision making have been identified as
critical to the OWF installation process, in addition to the logistical and operational decisions
discussed here and future work will extend the scope of this decision-support tool to incorporate
these factors explicitly. In practice various sources will be considered for each asset, with varying
manufacturing and transportation costs, and the storage requirements for larger assets can be
problematic. Additionally, there are a variety of considerations related to the layout of the
OWF which can impact on the installation process, including the geo-technical characteristics
throughout the site and the design of the cable network. It would be desirable to include these
considerations explicitly within a decision-making tool so that the supply chain, inventory, and
the layout can be optimally managed in conjunction with the installation schedule.
Acknowledgements
This study was funded through the University of Strathclyde Technology and Innovation Centre,
grant reference TIC/LCPE/FI03. The authors thank SSE Renewables, Scottish Power
Renew-ables and Technip Offshore Wind Limited for their contribution to this work. Additionally,
the authors thank the Bundesministerium fuer Umwelt (Federal Ministry for the Environment,
Nature Conservation and Nuclear Safety) and the Projekttraeger Juelich (project executing
organisation) for climate data from the FINO project.
References
[1] Agency, I.R.E.: The power to change: Solar and wind cost reduction potential to 2025
(2016). http://www.irena.org/DocumentDownloads/Publications/IRENA_Power_to_Change_
2016.pdf(Last accessed 22nd August 2016)
[2] Ait-Alla, A., Quandt, M., Lutjen, M.: Aggregate installation planning of offshore wind
farms. In: Proceedings of the 7th international conference on communications and
infor-mation technology, pp. 130–135 (2013)
[3] Arhami, M., Kamali, N., Rajabi, M.M.: Predicting hourly air pollutant levels using
artifi-cial neural networks coupled with uncertainty analysis by monte carlo simulations.
[4] Authors names removed for double blind review: A rolling horizon optimisation model for
offshore wind farm installation logistics (2016). In preparation
[5] Bauer, P., Thorpe, A., Brunet, G.: The quiet revolution of numerical weather prediction.
Nature525(7567), 47–55 (2015)
[6] Brailsford, S., Churilov, L., Dangerfield, B.: Discrete-Event Simulation and System
Dy-namics for Management Decision Making. John Wiley & Sons, Chichester, UK (2014)
[7] Bundesministerium fuer Umwelt, Projekttraeger Juelich: FINO 1 Meteorological Dataset
2004 - 2012 (2012). http://fino.bsh.de (Last accessed 1st December 2012)
[8] Christiansen, M., Fagerholt, K., Nygreen, B., Ronen, D.: Ship routing and scheduling in
the new millennium. European Journal of Operational Research228(3), 467–483 (2013)
[9] Conover, W.J.: Practical nonparametric statistics. John Wiley & Sons, New York (1980)
[10] Darabi, Z., Ferdowsi, M.: An event-based simulation framework to examine the response of
power grid to the charging demand of plug-in hybrid electric vehicles. IEEE Transactions
on Industrial Informatics10(1), 313–322 (2014)
[11] Dinwoodie, I.A., McMillan, D.: Operational strategies for offshore wind turbines to
miti-gate failure rate uncertainty on operational costs and revenue. Renewable Power
Genera-tion, IET8(4), 359–366 (2014)
[12] Dunn, O.J.: Multiple comparisons using rank sums. Technometrics 6(3), 241–252 (1964)
[13] Dunn, W.L., Shultis, J.K.: Exploring Monte Carlo Methods. Elsevier, Oxford, UK (2011)
[14] Endrerud, O.E.V., Liyanage, J.P.: Decision support for operations and maintenance of
offshore wind parks. In: Engineering Asset Management-Systems, Professional Practices
and Certification, pp. 1125–1139. Springer, London (2015)
[15] European Wind Energy Association: Wind in our sails (2011). http://www.ewea.org/
fileadmin/ewea_documents/documents/publications/reports/23420_Offshore_report_
web.pdf(Last accessed 22nd August 2016)
[16] European Wind Energy Association: Deep water (2013). http://www.ewea.org/fileadmin/
[17] Gharehgozli, A.H., Laporte, G., Yu, Y., de Koster, R.: Scheduling twin yard cranes in a
container block. Transportation Science49(31), 686–705 (2014)
[18] Golias, M., Portal, I., Konur, D., Kaisar, E., Kolomvos, G.: Robust berth scheduling
at marine container terminals via hierarchical optimization. Computers & Operations
Research41, 412–422 (2014)
[19] Irawan, C.A., Jones, D., Ouelhadj, D.: Bi-objective optimisation model for installation
scheduling in offshore wind farms. Computers & Operations Research (2015). http://dx.
doi.org/10.1016/j.cor.2015.09.010
[20] Jung, J., Onen, A., Russell, K., Broadwater, R.P., Steffel, S., Dinkel, A.: Configurable,
hierarchical, model-based, scheduling control with photovoltaic generators in power
distri-bution circuits. Renewable Energy76, 318–329 (2015)
[21] Kruskal, W.H., Wallis, W.A.: Use of ranks in one-criterion variance analysis. Journal of
the American statistical Association47(260), 583–621 (1952)
[22] Lange, K., Rinne, A., Haasis, H.D.: Planning maritime logistics concepts for offshore
wind farms: a newly developed decision support system. In: Computational Logistics, pp.
142–158. Springer, London (2012)
[23] Law, A.M., Kelton, W.D., Kelton, W.D.: Simulation modeling and analysis, vol. 2.
McGraw-Hill, New York (1991)
[24] Lutjen, M., Karimi, H.R.: Approach of a port inventory control system for the offshore
installation of wind turbines. In: The Twenty-second International Offshore and Polar
Engineering Conference, pp. 502–508 (2012)
[25] Mojo Maritime Ltd: Mermaid (2016). http://mojomermaid.com/ (Last accessed 22nd
Au-gust 2016)
[26] Morandeau, M., Walker, R.T., Argall, R., Nicholls-Lee, R.F.: Optimisation of marine
energy installation operations. International Journal of Marine Energy3, 14–26 (2013)
[27] Muhabie, Y.T., Caprace, J.D., Petcu, C., Rigo, P.: Improving the installation of offshore
wind farms by the use of discrete event simulation. In: Proceedings of the 5th World
[28] Niziolek, L., Chiam, T.C., Yih, Y.: A simulation-based study of distribution strategies for
pharmaceutical supply chains. IIE Transactions on Healthcare Systems Engineering2(3),
181–189 (2012)
[29] Offshore Wind Cost Reduction Task Force : Offshore wind cost reduction task force report
(2012). https://www.gov.uk/government/uploads/system/uploads/attachment_data/file/
66776/5584-offshore-wind-cost-reduction-task-force-report.pdf (Last accessed 22nd
August 2016)
[30] Quiring, S.M., Schumacher, A.B., Guikema, S.D.: Incorporating hurricane forecast
un-certainty into a decision-support application for power outage modeling. Bulletin of the
American Meteorological Society95(1), 47–58 (2014)
[31] Roberts, A., Weston, J., Valpy, B.: Offshore wind: a 2013 supply
chain health check (2013). https://www.thecrownestate.co.uk/media/5483/
ei-km-in-sc-supply-112013-offshore-wind-a-2013-supply-chain-health-check.pdf
(Last accessed 22nd August 2016)
[32] Robinson, S., Worthington, C., Burgess, N., Radnor, Z.J.: Facilitated modelling with
discrete-event simulation: Reality or myth? European Journal of Operational Research
234(1), 231–240 (2014)
[33] Scholz-Reiter, B., Lutjen, M., Heger, J., Schweizer, A.: Planning and control of logistics
for offshore wind farms. In: Proceedings of the 12th WSEAS international conference on
Mathematical and computational methods in science and engineering, pp. 242–247 (2010)
[34] Shafiee, M.: Maintenance logistics organization for offshore wind energy: current progress
and future perspectives. Renewable Energy 77, 182–193 (2015)
[35] Shyshou, A., Gribkovskaia, I., Barcel´o, J.: A simulation study of the fleet sizing problem
arising in offshore anchor handling operations. European Journal of Operational Research
203(1), 230–240 (2010)
[36] SSE: BOWL Presentation (Beatrice Project Update) (2015). http://sse.com/whatwedo/
[37] Stempinski, F., Wenzel, S., L¨uking, J., Martens, L., Hortamani, M.: Modelling installation
and construction of offshore wind farms. In: ASME 2014 33rd International Conference on
Ocean, Offshore and Arctic Engineering, p. Article ID V09BT09A001 (2014)
[38] Tejada, J.J., Ivy, J.S., Wilson, J.R., Ballan, M.J., Diehl, K.M., Yankaskas, B.C.: Combined
DES/SD model of breast cancer screening for older women, I: Natural-history simulation.
IIE Transactions47(6), 600–619 (2015)
[39] Wang, Z., Li, P., Li, L., Huang, C., Liu, M.: Modeling and forecasting average temperature
for weather derivative pricing. Advances in Meteorology2015, Article ID 837,293 (2015)
[40] Williams, T.: Practical use of distributions in network analysis. Journal of the Operational
Research Society 43(2), 265–270 (1992)
[41] Yuan, T., Zhu, X.: Reliability study of ultra-thin dielectric films with variable thickness