Measuring the energy innovation process: an indicator
framework and a case study of wind energy in China
Rui Hua, Jim Skeaa, Matthew Hannonb
a Centre for Environmental Policy, Imperial College London, SW7 1NA, London, United Kingdom b Strathclyde Business School, University of Strathclyde, G4 0GE, Glasgow, United Kingdom
Abstract
Whilst a well-established literature on metrics to assess innovation performance exists, relatively little work has linked it to the energy technology innovation process. This paper systematically brings together indicator sets and derives an indicator framework for measuring energy innovation, offering an important step forward in the quantitative evaluation of energy innovation performance. It incorporates input, output and outcome metrics that relate to different stages along the energy technology innovation chain, namely research, development, demonstration, market formation and diffusion. To test its efficacy, the indicator framework is applied to the case of wind energy in China, drawing comparisons against global market leaders such as Denmark, Germany and the USA. The paper finds that the framework enables a more rigorous comparative analysis of energy innovation between countries than currently offered by either the application of piecemeal indicators and complements contextually rich qualitative case studies. The empirical analysis shows that China has begun to lead across a range of innovation inputs (e.g. R&D expenditure) and outputs (e.g. publications) but lags considerably behind international competitors against other output and outcome indicators such as patents, revenue and exports.
Keywords
: innovation metrics; energy technology innovation; innovation system; China1. Introduction
Energy technology innovation has been identified as critical to achieving a transition to a sustainable energy system [1, 2]. The world’s major economies’ energy RD&D budgets have grown significantly in a bid to stimulate greater innovation following decades’ of decline and stagnation [3-5]. Given this growth in funding, it is necessary to assess the effectiveness of energy innovation support and the types of policy interventions that could accelerate innovation in the future. The first step in this direction is to develop an indicator framework capable of offering in-depth quantitative assessments of energy innovation performance [6-8]. The literature on energy innovation indicators is still in its infancy. The IEA emphasised that the “ongoing evaluation of innovation effort is needed to assess success, accumulate learning experience and determine how to best support specific technologies” ([1], pp. 16). In a bid to advance the state-of-the-art on energy innovation indicators, this paper draws upon innovation systems theory to synthesise a wide-range of indicator sets to develop a comprehensive framework that allows for a more rigorous comparative analysis of innovation performance than currently offered both by the piecemeal quantitative indicators and contextually richer qualitative accounts of innovation studies.
The framework is employed to compare the performance of China, a relative newcomer to wind energy, versus other global market leaders, namely Denmark, Germany and the USA. As of 2015, China accounted for 33% of global wind power capacity [9]. However, few studies have measured its innovation performance and there are mixed opinions in the existing literature as to whether China has grown as a leading innovator in wind technology (see [10-13]). The framework is applied to offer insights into whether China has technologically leapfrogged traditional industry leaders [10] or if its technological capability remains limited [12, 14-16]. A more rigorous assessment of China’s wind energy innovation performance relative to the world leading countries is offered.
2. Conceptual background
Innovation is a non-linear but systemic process [17]. Academic views on the innovation process have shifted from traditional linear models to the innovation systems (IS) approach [18]. A variety of IS approaches have emerged, including national innovation system (NIS) [19-21], regional innovation system (RIS) [22], sectoral innovation system (SIS) [23], technological innovation system (TIS) [24-26] and energy technology innovation system (ETIS) [27-29]. They can be regarded as variants of a generic IS approach, each adopting a different unit of analysis (i.e. national, regional, sectoral or technological) to suit the different research questions being posed [30, 31]. This paper is concerned with innovation occurring in a particular technological field within specific countries, so NIS, TIS and ETIS frameworks are most relevant. This section offers the theoretical background against which efforts have been made to measure, understand and explain the variations in innovation performance.
2.1. National innovation system
The NIS literature emerged in the early 1980s, with the theoretical foundation underpinned by key contributions from Freeman [21], Lundvall [20] and Nelson [19]. Freeman [21] argued that the performance of an NIS can be affected by a variety of factors, among which the flexibility of institutions may perhaps be the most crucial element [21]. Nelson [19] confirmed that institutions, universities, institutes and corporate R&D labs, as well as the connections among them, are essential for analysing NISs. Lundvall [20] held that the core aim of an NIS is to create favourable institutions to incentivise the heterogeneous actors to interact with each other to generate, adopt and diffuse new concepts and technologies. In essence, NIS is used to explain the macro institutional and structural factors responsible for influencing technological change and the long-term economic growth of nations.
In recent years, NIS studies have begun to focus on competence-building [32, 33], systemic problems [34, 35], dynamics of innovation [36, 37] and international linkages of innovation systems [38-40]. For example, Borrás and Edquist [32] argued that the core tasks of innovation systems are to build, maintain and use competencies. In this sense, NIS can be seen as an evolutionary concept concerning how national systems create diversity, stimulate variation and select routines [36]. In order to diagnose system failures that occur in developed and developing economies [35], Edquist [30] presented a hypothetical list of functions similar to TIS. In general, NIS is mainly concerned with the national factors that positively or negatively contribute to innovation and technological change.
2.2. Technological innovation system
The TIS framework has gained much attention recently [24-26, 30, 41-44]. Different from the NIS approach, TIS focuses on the key functions that stimulate or hamper innovation activities in a specific technological area. According to the definition, “a technological [innovation] system is a dynamic network of agents interacting in a specific economic/industrial area under a particular institutional infrastructure and involved in the generation, diffusion and utilisation of technology” ([26], pp. 111). As a TIS typically involves fewer elements and relationships than an NIS, the structure and dynamics of the system can be mapped out. Also, geographical borders do not necessarily determine the boundaries of TISs.
A key feature of the TIS framework is the inclusion of TIS functions. These present a set of specific roles the TIS performs in support of the development and deployment of an emerging technology [24, 25]. In essence, if a TIS system’s functions are all performing strongly then it is assumed the technology is well-placed to progress towards commercialisation, assuming the engineering challenges are surmountable. However, should one or more functions perform poorly then the technology may fail to reach maturity [41, 45, 46]. Assessment of TIS function performance therefore helps us to identify weaknesses or ‘bottlenecks’ that are undermining energy innovation [31, 47]. These functions are Entrepreneurial Experimentation, Knowledge Development, Knowledge Networks, Guidance of the Search, Resource Mobilisation, Market Formation, and Creation of Legitimacy [24, 25].
Scholars have begun to link the structure (e.g. actors, institutions, networks, infrastructure) with the functions of a TIS in order to diagnose systemic problems [44]. Each function involves one or more structural elements that have an important bearing on development, diffusion or use of innovations [41, 45, 46]. For example, the function of Knowledge Development is likely to perform poorly in the absence of key actors
like universities and research institutes, networks that bring these together to foster collaboration and
system upon which the functions are developed and work as ‘intermediaries’ towards the ultimate goals of the innovation system [48].
2.3. Energy technology innovation system
Energy innovation results from research, development, demonstration, deployment and diffusion efforts [28, 49]. The ETIS is an application of a systemic perspective on innovation to energy technologies [27, 28]. It is developed in reaction to some of the characteristics specific to the energy system that together result in a relatively slow process of technology innovation and diffusion. These include: (1) capital intensiveness of energy technology investments; (2) longevity of capital; (3) extended time required to progress technology from invention to innovation; and (4) extended time for technology clustering and spill-over effects to emerge [50].
Diagram 1: The analytical framework of energy technology innovation system (ETIS)
This stylistic illustration of ETIS describes the following key elements: analytical dimensions (the frame);
innovation stages (grey double-headed arrows); innovation drivers (green rhombi and block arrows); and
innovation processes (blue and brown frame) that span across inputs (blue frame), outputs (brown frame) and outcomes (orange arrow).
Source: [27]
The ETIS framework aims to capture these characteristically distinct innovation processes by emphasising the multi-dynamic feedbacks between different stages [28, 29, 50, 51]. It describes: a) the four analytical dimensions of ETIS (i.e. actors & interactions, resources, knowledge and adoption and use of energy technologies) (see Diagram 1); b) the stages of energy technology innovation process (i.e. research, development, demonstration, market formation and diffusion); c) the feedbacks between these stages; d) the drivers of energy technology innovation (i.e. technology-push and market-pull); and e) the relevance of energy supply and energy end-use technologies; [29].
with its associated inputs, outputs and outcomes. Indicators for measuring the presence and fulfilment of system functions can also be developed (see [15, 25, 31, 52-55]), but they sit outside the scope of this paper.
3. An indicator framework for measuring energy innovation process
There is a burgeoning strand of work on indicators to measure energy innovation performance (see [50, 56-60]). The indicators offer insight into how well different aspects of the innovation system are performing and taken together present a comprehensive picture of innovation performance. This section reviews the characteristics of existing indicator frameworks and highlights the need to synthesise them to enable a more rigorous comparative analysis than that offered both by piecemeal indicators in current use, and by contextually rich accounts of innovation studies.
3.1. Developments in energy innovation indicators
In broad terms, three types of indicators exist: inputs, outputs and outcomes:
Input metrics measure the tangible and intangible resources that are fed into the energy technology innovation process, such as RD&D expenditure and the number of RD&D personnel;
Output indicators measure the desired outputs generated from these inputs across different stages of the innovation chain, such as publications, patents, technological achievement (e.g. the capacity of individual units) and total installed capacity;
Outcome indicators reflect the wider socio-economic and environmental impacts these energy technology innovation outputs have had, such as economic growth, job creation and CO2 emissions reduction.
We briefly review the different indicator frameworks currently being operated for generic innovation indicators before turning to energy technology specific innovation indicators.
3.1.1. Generic innovation indicators
There is a wealth of research on generic innovation indicators. Well-recognised indicator reports include the Main Science and Technology Indicators [61], Science, Technology and Industry Scoreboard [62], Science, Technology and Industry Outlook [63], Innovation Union Scoreboard [64], and Global Innovation Index [65]. However, these frameworks and indicators have limitations. First, the indicators adopted in most of these frameworks have been limited to inputs and outputs but rarely considered outcomes. The Science, Technology and Industry Outlook (2016) began to include outcome indicators just recently. Second, many studies neglected a country’s industrial mix which has significant effects on innovation rankings. Some countries’ industrial mixes are more complex than others, and the share of manufacturing versus services sectors and high-technology industry varies across countries. Third, composite indexes were often used to benchmark countries, but the selection, weighting and aggregation of indicators varied considerably. Fourth, an innovation system can be evaluated by process (see [66]) or function (see [25]) related indicators, but many reports contain a mixture of indicator types without clarifying the differences. Overall, a transparent indicator framework with clearly defined concepts is necessary for more accurate measurement of innovation performance.
3.1.2. Energy innovation indicators
Building on these generic innovation indicators a number of energy specific indicators have subsequently emerged to measure energy innovation performance. Klitkou, Scordato and Iversen [60] suggested five types of indicators: structural, input, throughput, output and policy indicators. Structural indicators measure framework conditions such as R&D intensity, industrial specialisation and energy mix. Input indicators measure the amount of resources invested in public RD&D budgets. Throughput indicators evaluate intermediate results of the innovation process by scientific publications and patents. Output indicators capture energy technology exports. Finally, policy indicators assess the stability and longevity of energy technology policies.
role of SMEs in developing novel knowledge and technology, but it does not directly measure the results of innovation activities, namely outputs and outcomes.
In Energy Technology Perspectives 2012, IEA [68] assessed energy technology innovation from five perspectives with six distinct indicators: (a) public R&D investment (R&D expenditure); (b) technology development (number of patents); (c) technology demonstration (number of demonstration projects); (d) technology deployment (growth of deployment rates); and (e) technology diffusion (number of patents filed in at least two countries, and technology exports). These indicators focus only on a handful of specific aspects relating to the energy technology innovation process.
Wilson, Grubler, Gallagher and Nemet [27] adopted input, output and outcome indicators for evaluating the global ETIS. The indicator sets covered all stages, drivers and processes but did not clearly align the inputs, outputs and outcomes with the associated innovation stages. Besides, some indicators such as learning rate and UK/EU doctoral training centres may be inappropriate. For example, learning rate (percent cost reduction per doubling of cumulative output) can be affected by many factors such as input prices, economies of scale and changes in market conditions as well as “learning by doing” [69]. “Doctoral training centres” do not even exist in some countries, which may encounter international comparability issues. This paper intends to derive an indicator framework that pays particular attention to linking indicators with the specific innovation stages and justifies the rationales and methodological challenges of the proposed indicators. In summary, energy innovation indicator frameworks have evolved into two strands – one incorporates indicators into system functions (see [15, 25, 31, 52-55]) and the other focuses on the energy technology innovation process (see [27, 68]). Many piecemeal indicators are available for measuring the specific aspects of innovation systems, but a more systematically integrated indicator framework is required to conduct a more rigorous comparative analysis across the innovation chain. This paper aims to fill this gap by deriving an indicator framework that focuses on the chain-linked process of energy technology innovation with the associated inputs, outputs and outcomes.
4. An integrated energy innovation indicator framework
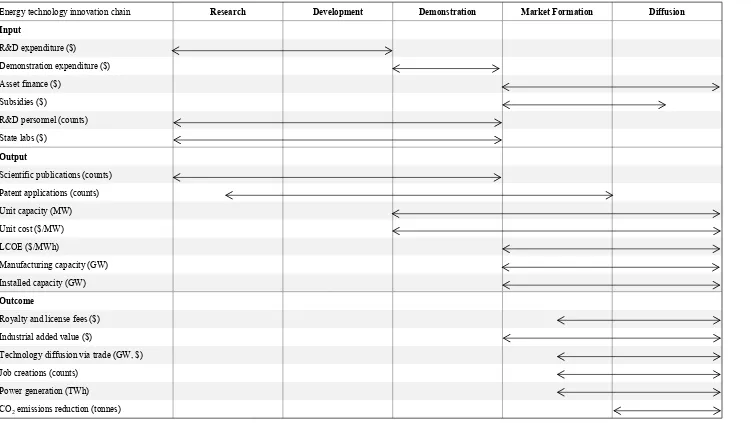
This section synthesises the existing indicator sets to present an integrated indicator framework to measure the energy innovation process. The indicator framework consists of 18 indicators, each categorised by input, output and outcome metrics (see Table 1), aimed at measuring energy innovation performance across the different chain-linked stages.
The indicator framework is process related, whereby each of the three categories is chain-linked, with outcomes following the delivery of inputs and outputs. By selecting different indicators, the chain effect is illustrated. For example, R&D expenditure and personnel (inputs) are essential to generate technical knowledge often in the forms of publications and patents (outputs), which can then be translated into the manufacturing and deployment of new energy technologies (outputs), and can in turn result in industrial revenue, job creation and CO2 emissions reduction (outcomes). Whilst innovation inputs are mainly focused on earlier stage activities (e.g. RD&D investment), some resource inputs (e.g. demand-pull subsidies and asset finance) aim at supporting later stage activities (e.g. market formation and diffusion). Linking them together can allow researchers to measure innovation performance across the energy technology development lifecycle [49, 70].
The framework does not present an exhaustive set of indicators for measuring the energy innovation process but it does provide a balanced list input-output-outcome metrics that covers all the key elements. The framework presents indicators that have relevance to the vast majority of energy technologies. However, it is designed as a menu from which an appropriate mix of indicators can be selected on a case-by-case basis when taking into account the specific research questions being examined and the availability of data. For example, installed capacity is a good measure for relatively mature technologies like wind and solar energy, but it does not fit well for immature technologies such as wave and tidal stream, which have not yet experienced sufficient commercial deployment to yield meaningful data.
basic research, applied R&D or experimental development. The output and outcome indicators can be interpreted in similar ways. For example, rather than the quantity of publications or patents, analysts can also measure their quality, indicated by a country’s share of the world’s top 10% most cited publications or patents.
Table 1 An indicator framework for measuring energy innovation process
Energy technology innovation chain Research Development Demonstration Market Formation Diffusion
Input
R&D expenditure ($)
Demonstration expenditure ($)
Asset finance ($)
Subsidies ($)
R&D personnel (counts)
State labs ($)
Output
Scientific publications (counts)
Patent applications (counts)
Unit capacity (MW)
Unit cost ($/MW)
LCOE ($/MWh)
Manufacturing capacity (GW)
Installed capacity (GW)
Outcome
Royalty and license fees ($)
Industrial added value ($)
Technology diffusion via trade (GW, $)
Job creations (counts)
Power generation (TWh)
CO2 emissions reduction (tonnes)
Table 2 Strengths and weaknesses of the indicators
Indicators Rationale Methodological challenges Data repositories Reference to reviewed
frameworks R&D expenditure ($) Most relevant for generating technical inventions [7,
71]
Can be broken down by types and funding sources
Data is only available for certain countries
Difficulty of estimating private R&D spending
IEA RD&D Database, Bloomberg Terminal
[27, 54, 59-61, 64, 65, 68]
Demonstration expenditure
($)
Complementary to R&D activities [72]
Essential for advertising the efficiency, reliability, safety, cost and other performance of novel technologies (prototypes) [56, 73]
Only public budgets data (i.e. IEA RD&D Database) is available for certain IEA countries
Difficulty of distinguishing demonstration from R&D efforts [72]
IEA RD&D Database [27, 54, 60]
Asset finance ($) Complementary to RD&D and production of devices [74]
Crucial to deploy and diffuse novel energy technologies
Data is only available for certain countries Bloomberg Terminal [27]
Subsidies ($) Creating a niche market for new technologies when they are not competitive with incumbents [75-77]
Speeding up the adoption of new technologies [78, 79]
Official data is unavailable for many countries
Subsidies may obscure the true cost of energy, create distorted price signals and unleash talented latecomers [80, 81]
n/a (requires aggregation of national data)
n/a
R&D personnel (counts) Human resources for developing cutting-edge technologies [7]
Can be broken down by gender, age, demographic characteristics and formal qualification[71]
Data is unavailable for many economies
Technology-specific data is unavailable
Data on education levels is hard to be obtained
OECD Main Science and Technology Indicators, Eurostat (not energy specific)
[60, 61] Input
State labs ($) State labs execute long-term and strategic scientific and technological missions and sustain national priorities [82, 83]
State labs often conduct basic research, different from private companies which mostly carry out applied research and experimental development
Financial data is often unavailable
Difficulty of estimating the number of technologies developed or proportion of R&D personnel involved in state labs
n/a (requires aggregation of national data)
n/a
Scientific publications (counts)
Core output of R&D activities [84]
Research quality can be estimated [85]
Can be broken down by technologies and components
Language bias exist [86]
Difficulty of determining the boundary of the technological field
Searching queries vary among analysts [60]
Scopus, Web of Science [27, 54, 60, 64, 65]
Patent applications (counts) Core output of R&D activities [87]
Research quality can be estimated [88]
Can be broken down by technologies and components
Not all innovations are patented
Time lags between application and grant dates
Patent citations are subject to examination procedures [88]
Difficulty of determining the boundary of the technological field
PATSTAT, PatentScope, national patent authorities
[54, 59-61, 64, 65, 68]
Unit capacity (MW) Indicates a form of embodied knowledge in researching and manufacturing technologies [89]
A direct measure of (nearly) commercialised technology
Cannot reflect the quality and reliability of technologies (larger unit capacity does not always mean better technology)
n/a (requires compilation from company reports and websites)
n/a ([89] adopted this metric)
Output
Unit cost ($/unit) Indicates the economic advantage of the technology [90]
Useful for comparing the effect of “learning by doing” given other inputs’ cost is similar
Unit cost is affected by a variety of input prices (e.g. labour cost) and economies of scale, apart from “learning by doing”
Bloomberg Terminal, IRENA
Levelised cost of electricity (LCOE) ($/MWh)
A robust methodological for calculating the cost of electricity generated by technology [91].
An excellent metric for technology maturity
A function of multiple factors acting simultaneously that may not directly relate to technology performance and vary dramatically by country such as operations and maintenance, technology lifetime etc.
Bloomberg Terminal, IRENA REsource
n/a
Manufacturing capacity
(GW)
Core indicator for commercialised technology
Indicates the potential to modifying or commercialising R&D efforts
Cannot reflect the proportion of imported technologies in manufacturing process
n/a (requires aggregation of national data)
n/a
Installed capacity (GW) Most relevant for indicating the deployment of novel technologies
Easy to compare the data across countries and technologies
Subject to resource endowment [92], technology development stage and technological characteristics [91]
IEA, BP, Bloomberg Terminal, IRENA Resource, REN21, EnerData
[27, 68]
Royalty and license fees ($) Reflects the quality and impact of technology
A form of technology diffusion across firms and countries
Statistics for specific technologies are unavailable OECD Statistics on International Trade in Services, UN Comtrade Database (not energy specific)
[61, 64, 65]
Industrial added value ($) Core indicator for measuring economic returns Statistics for specific technologies need to be improved
n/a (requires aggregation of national data)
[61, 64, 65]
Technology diffusion via trade (GW, $)
Indicates technological and economic impacts of
innovation [93]
Statistics in economic terms are subject to input prices (e.g. labour and material cost) and trade rules (e.g. WTO rules)
UN Comtrade Database,
Bloomberg Terminal [54, 60, 61, 64, 65, 68]
Job creations (counts) Represents a form of social impact of innovation
Indicates technology codification and transfer to wider workforce
Difficulty of estimating the number of direct and indirect jobs
Subject to technological characteristics (e.g. labour-intensive) and a country’s specialisation in global trade
IRENA REsource [54, 60, 61, 64, 65]
Power generation (TWh) Impact of technology on the energy system Subject to installed capacity and technological efficiency [94, 95]
IEA, BP, Bloomberg Terminal, IRENA Resource, REN21, EnerData
[54] Outcome
CO2 emissions reduction (tonnes)
Indicates estimated achieved emissions reduction (see [96])
Subject to the emission factors of fossil fuels that are affected by a variety of technological and policy issues (see [97])
IRENA Resource, IIASA GAINS Model
[27, 59]
5. Case study: cross-country comparisons on wind energy innovation
This section applies the integrated indicator framework to compare China’s performance relative to other leading countries in wind energy innovation. It first describes the methodology that has been developed to meet the needs of the problem at hand and then conducts both nation and firm-level comparisons across countries. The empirical results are summarised afterwards.
5.1. Methods and data
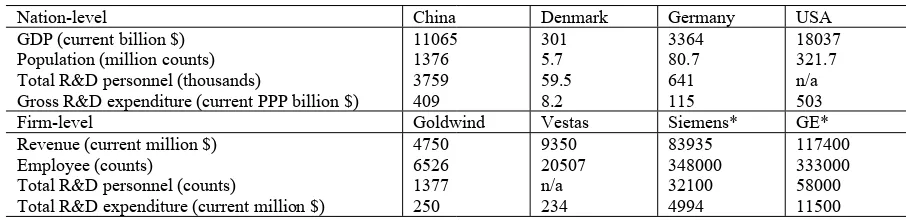
This paper assesses China’s performance relative to Denmark, Germany and the USA. These three countries represent the pioneers in developing wind technology. By comparing China’s performance with the world leaders, it is possible to identify whether China has become a leading innovator in wind power technology as well as specific gaps across the energy technology innovation chain. Descriptive statistics are adopted to measure wind energy innovation performance characterised by the growth or decline of innovation inputs, outputs and outcomes across the chain-linked stages. It is noticeable that China, Denmark, Germany and the USA vary significantly in terms of wealth and population (see Table 3). A common approach to eliminating the effect of country size on empirical results has been to normalise indicators by GDP or population. This paper does not normalise indicators by GDP nor population for two reasons.
[image:10.595.69.522.405.515.2]Firstly, GDP and population are both aggregate figures. A country’s GDP includes economic production from all sectors, whilst population consists of R&D and non-R&D workforce in all technological fields. It therefore seems problematic to normalise indicators of energy technology-specific performance, such as for wind energy, against indicators like GDP or population, when much of the wealth or population covered by these economy-wide indicators is not directly related to wind energy. Doing so may see countries with very large economies or populations, associated with growth outside the energy technology sector (e.g. agriculture, ICT and construction), perform poorly in relative terms.
Table 3 The comparable size of countries and firms, 2015
Nation-level China Denmark Germany USA
GDP (current billion $) 11065 301 3364 18037 Population (million counts) 1376 5.7 80.7 321.7 Total R&D personnel (thousands) 3759 59.5 641 n/a Gross R&D expenditure (current PPP billion $) 409 8.2 115 503
Firm-level Goldwind Vestas Siemens* GE*
Revenue (current million $) 4750 9350 83935 117400
Employee (counts) 6526 20507 348000 333000
Total R&D personnel (counts) 1377 n/a 32100 58000 Total R&D expenditure (current million $) 250 234 4994 11500
N.B. * Goldwind and Vestas focus predominantly on wind power technology whilst Siemens and GE conduct many other businesses apart from wind energy. The data for Siemens and GE are aggregate numbers rather than wind technology specific which is not publicly accessible.
Source: [98-104]
Secondly, this research is mainly concerned with China’s role in the global wind energy sector, so the adoption of absolute metrics is appropriate. However, if the narrower purpose had been to compare the effectiveness of energy innovation systems, then normalised indicators may have worked better. Aggregate data without being normalised by GDP or population can exaggerate the performance of large countries, so this paper also incorporates a firm-level comparison, with a leading manufacturer selected for each country (i.e. Goldwind for China, Vestas for Denmark, Siemens for Germany and GE for the USA) (see Table 3). This multi-level approach of assessing innovation at both a national and firm-level offers a more comprehensive picture of relative innovation performance.
applied (see Table 4). The uncovered indicators caused by data constraints may inspire future efforts to improve data infrastructure and statistics.
Table 4 The data coverage for cross-country comparisons
Metrics Nation-level Firm-level Time period Data sources
Input
R&D expenditure ($) √ √ 2005-2015 [106] Demonstration expenditure ($) × × n/a n/a
Asset finance ($) √ × 2005-2015 [106]
Subsidies ($) × × n/a n/a
R&D personnel (counts) × × n/a n/a State labs & testing centres ($) × × n/a n/a
Output
Scientific publications (counts) √ × 2005-2015 [107] Patent applications (counts) √ √ 2000-2015* [108, 109] Unit capacity (MW) × √ 1980-2015 Company websites
Unit cost ($/unit) × × n/a n/a
Manufacturing capacity (GW) √ √ 2005-2015 [106] Installed capacity (GW) √ × 2005-2015 [9]
Outcome
Royalty and license fees ($) × × n/a
Industrial added value ($) × √ 2005-2015^ [106] Technology diffusion via trade (GW, $) √ √ 2005-2015^ [110] Job creations (counts) × × n/a
Power generation (TWh) √ × 2005-2015 [9] CO2 emissions reduction (tonnes) √ × 2005-2015 [111]
N.B. * Patent statistics after 2011 are less reliable due to delayed disclosure of patent data; ^ firm-level data starts from 2006.
Source: The authors.
5.2. Nation-level comparison
5.2.1. Inputs
5.2.1.1. R&D expenditure and asset finance
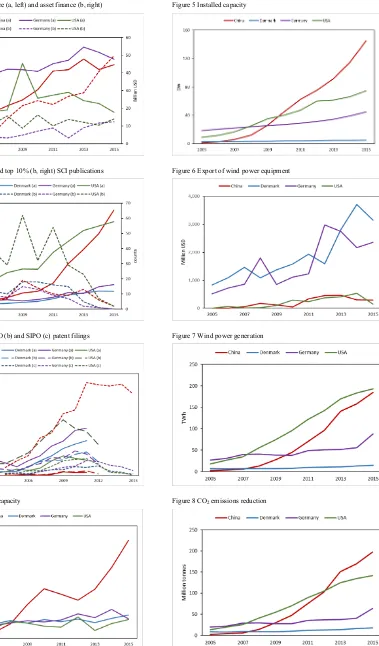
China, in recent years, invested heavily in wind energy R&D and asset finance and began to lead in these two areas. China’s wind energy R&D spending surpassed the USA in 2010 and is approaching that of Germany (see Figure 1). Between 2005 and 2015, China invested 2.2 billion USD in wind energy R&D, with an average annual growth rate of 11%, representing the fastest growth rate among the four countries [106]. In addition, China spent 50 billion USD in 2015 on wind power projects, compared to 12 billion USD by Germany and 14 billion USD by the USA [106]. In total, China invested 240 billion USD in asset finance between 2005 and 2015, with an average annual growth rate of 47% [106].
5.2.2. Outputs
5.2.2.1. Scientific publications
China’s R&D efforts seem to be paying off regarding the production of scientific publications. In 2015, China overtook the USA and became the largest producer of scientific publications in wind turbine technology (see Figure 2). Between 2005 and 2015, the number of publications authored by Chinese scientists increased from less than 30 to 560, with an average annual growth rate of 37% [107]. Even if it is measured by the world’s top 10% cited publications, China now plays as significant a role as the USA. China has leapfrogged other countries in terms of scientific publications.
5.2.2.2. Patent applications
[108]. The gap between China and the other countries in EPO and USPTO filings has widened over the last decade. However, China caught up fast with other countries in terms of patent applications to the China State Intellectual Property Office (SIPO). It filed 820 SIPO applications in 2011, compared to 70 by Denmark, 130 by Germany and 148 by the USA [109]. From 2005 to 2011, China’s SIPO filings increased by a factor five, with an average annual growth rate of 40% [109].
5.2.2.3. Manufacturing and installed capacity
China’s manufacturing capability has grown fast. Currently, half of the world’s largest wind turbine manufacturers are Chinese firms [112] (see Figure 4). The supply of wind turbines at reasonable prices enables China to deploy the technology at a massive scale. China’s installed capacity of wind power increased from less than 1.3 GW in 2005 to 145 GW by 2015, with an average annual growth rate of 66% (see Figure 5) [9]. The installed capacity is three times more than Germany and twice that of the USA.
5.2.3. Outcomes
5.2.3.1. Technology diffusion via trade
Denmark leads in wind power equipment exports, whilst China and the USA have contributed relatively little in terms of international trade of wind technology (see Figure 6). For example, Chinese firms have been exporting wind turbines since 2007 [113] and in 2015 China exported wind power equipment worth 290 million USD, compared to 3.2 billion USD for Denmark and 2.4 billion USD for Germany [110]. Between 2007 and 2015, China’s average annual growth rate of export of wind power generating sets is about 84%, compared to 14% for Denmark, 27% for Germany and 85% for the USA [110].
5.2.3.2. Power generation and CO2 emissions reduction
Figure 1 R&D expenditure (a, left) and asset finance (b, right)
Figure 2 Total (a, left) and top 10% (b, right) SCI publications
Figure 3 EPO (a), USPTO (b) and SIPO (c) patent filings
[image:13.595.143.522.71.717.2]Figure 4 Manufacturing capacity
[image:13.595.73.317.71.731.2]Figure 5 Installed capacity
Figure 6 Export of wind power equipment
Figure 7 Wind power generation
[image:13.595.314.531.75.576.2]5.2.4. Summary of nation-level comparison
China leads in six but lags in two of the eleven indicators (see Table 5). To be specific, China leads in R&D expenditure, SCI publications, SIPO filings, manufacturing capacity, installed capacity and CO2 emissions reduction, but falls behind in EPO and USPTO filings. Another observation is that Germany and the USA perform moderately well while Denmark, often considered as one of the most advanced countries in wind technology, underperforms in most indicators except exports. It suggests that large countries may be ranked higher in nation-level comparison. To help mitigate the impact of country size on results, Section 5.3 will conduct firm-level comparison.
[image:14.595.74.526.321.555.2]The performance of the Chinese innovation system for wind energy has grown consistently in terms of inputs, outputs and outcomes. The biggest issue is with the country’s deficit in EPO and USPTO filings. In comparison, performance growth for the wind energy innovation systems of Denmark, Germany and the USA has been less consistent - they all slowed the growth of, or cut, R&D expenditure. Asset finance in Germany and the USA has also declined. Despite weak growth or the reduction of inputs, outputs and outcomes have continued to increase for these traditional leaders. They are far ahead of China in EPO and USPTO filings. The continued increase of outputs and outcomes despite the stagnant growth or reduction of inputs indicates the importance of cumulative R&D. In other words, technological innovation requires continuous R&D inputs, and the effect of prior R&D efforts and achievements matter a great deal (see [114]).
Table 5 The inputs, outputs and outcomes across countries, 2015
Metrics High Low
Input
R&D expenditure (million $) 278 206 104
Asset finance (billion $) 50 14 12
Output
SCI publications (counts) 560 495 139 101
Top 10% SCI publications (counts)* 54 16 10 9
EPO filings (counts)* 418 307 133 26
USPTO filings (counts)* 388 207 188 40
SIPO filings (counts)* 821 147 130 71
Manufacturing capacity (GW) 30.4 7.3 6.1 5.9
Installed capacity (GW) 145 75 45 5
Outcome
Technology diffusion via trade (million $) 3,150 2,358 291 149
Power generation (TWh) 193 185 88 14
CO2 emissions reduction (million tonnes) 198 142 64 18
* The data is based on the year of 2011. China Denmark Germany USA
Source: The author.
5.3. Firm-level comparison
5.3.1. Inputs
5.3.1.1. R&D expenditure
5.3.2. Outputs
5.3.2.1. Patent applications
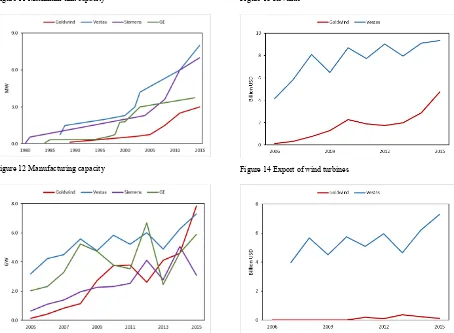
As for the relative weakness in patent applications at the national level, China’s patenting performance at the firm level is also deficient. As of 2011, Goldwind had made only three patent applications to the EPO and USPTO, plus five by its German subsidiary Vensys [108]. In comparison, Siemens (Germany) filed about 180 patent applications to the EPO and 32 to the USPTO in 2011 (see Figure 10). Siemens, Vestas and GE (USA) are significantly ahead of Goldwind.
Even in the Chinese market, Goldwind did not patent until 2010 [109]. The firm has made only 8 patent applications to the SIPO, compared to 56 by Vestas, 58 by Siemens and 131 by GE [109]. Before 2007, Vestas and Siemens had almost no patenting records at SIPO, but they have quickly built a strong patenting stock since then. The rapid increase may be attributable to their cumulative knowledge – they can modify their prior patents filed at the EPO or USPTO to meet the Chinese criteria so that the technologies can also be protected in the Chinese market. Recent data indicates a rapid growth in Goldwind’s SIPO filings and a significant decline of the other firms, but this may be affected by the patent authority’s examination procedure and delayed disclosure of information.
5.3.2.2. Unit capacity
There occurred remarkable upscaling in terms of wind turbine unit capacity in Europe and the USA between the early 1980s and 2005 over which time Vestas, Siemens and GE upgraded wind turbines from less than 1.0 MW to 3.0 MW (see Figure 11). Goldwind was not able to develop a 1.5 MW wind turbines (prototype) until 2003, thanks to a joint R&D project with Vensys. By 2015, Goldwind had scaled up turbine size to 3.0 MW when Vestas and Siemens successfully developed 6.0–8.0 MW offshore wind turbines. Goldwind has developed 6.0 MW prototypes, but these are yet to become commercialised and are thus excluded in the analysis. There still exists a large gap between Goldwind and the leading players in terms of unit capacity.
5.3.2.3. Manufacturing capacity
Driven by the fast-growing Chinese wind power market, Goldwind overtook Vestas and became the largest wind turbine producer in 2015 (see Figure 12). The firm delivered wind turbines with a total capacity of 7.8 GW, compared to 7.3 GW by Vestas, 3.1 GW by Siemens and 5.9 GW by GE [106]. Between 2005 and 2015, Goldwind supplied wind turbines with a capacity of 32 GW to meet demand, with an average annual growth rate of 64% [106]. Vestas and Siemens experienced a gradual increase while GE underwent ups and downs.
5.3.3. Outcomes
5.3.3.1. Revenue and export
Goldwind far lags Vestas in terms of revenue (see Figure 13). In 2015, Goldwind made 4.8 billion USD, just half of Vestas’ sales. This may be because Vestas turbines are priced higher than Goldwind’s. On average, it costs 1.28 million USD/MW for Vestas wind turbines and 0.61 million USD/MW for Goldwind turbines1[106]. Lower prices have not led to competitive advantage for Goldwind in the international market. The quality and reliability of turbines, as well as certification, are major concerns for wind farm developers [115].
Regarding export performance, Vestas is the global leader (see Figure 14). In 2015, Vestas exported wind turbines with a capacity of about 7.2 GW, compared to 115 MW for Goldwind [106]. Exports account for 96% of Vestas’ delivered capacity while it is only 1.5% for Goldwind [106]. The variation in export demonstrates the international competitiveness between Goldwind and Vestas.
Figure 9 R&D expenditure
[image:16.842.552.779.76.412.2]Figure 10 EPO (a), USPTO (b) and SIPO filings (c)
Figure 11 Maximum unit capacity
Figure 12 Manufacturing capacity
Figure 13 Revenue
[image:16.842.321.775.78.411.2] [image:16.842.72.584.79.414.2]5.3.4. Summary of firm-level comparison
Goldwind leads in two but lags in six of the eight indicators (see Table 6). To be specific, it leads the other companies in terms of R&D expenditure and manufacturing capacity but falls behind in EPO, USPTO and SIPO filings, unit capacity, revenue and export. The gap in patent filings is very large. Goldwind delivered slightly more wind turbines than Vestas, but its revenue was half of the latter. When it comes to technology exports, Goldwind’s share was tiny compared to Vestas.
[image:17.595.72.527.272.490.2]Vestas performs excellently in almost all measures of input, output and outcome other than SIPO filings which are only two less than Siemens. In contrast with the nation-level comparison, this firm-level comparison shows that Denmark is the most advanced country in wind turbine innovation. It implies that merely relying on nation-level comparisons may generate biased information. The consistent findings from nation and firm-level comparisons are that China has caught up fast in R&D expenditure and manufacturing capacity but lags significantly in patent filings and exports. A combination of nation and firm-level comparisons produces more convincing results.
Table 6 The inputs, outputs and outcomes across companies, 2015
Metrics High Low
Input
R&D expenditure (million $) 251 234
Output
EPO filings (counts)* 188 145 97 2
USPTO filings (counts)* 51 44 32 1
SIPO filings (counts)* 131 58 56 8
Unit capacity (MW) 8.0 7.0 3.75 3.0
Manufacturing capacity (GW) 7.8 7.3 5.9 3.1 Outcome
Revenue (million $) 9.3 4.8
Technology diffusion via trade (GW) 7.3 0.1
* The data is based on the year of 2011. Goldwind Vestas Siemens GE
Source: The author.
6. Reflections on application of the indicator framework
6.1 Efficacy of the indicator framework
The proposed indicator framework synthesizes a host of existing indicator sets to present a valuable means of undertaking a more comprehensive comparative assessment of countries’ energy innovation performance across the multiple stages than that offered by piecemeal indicators currently in use.
capacity achieved through RD&D investment or the recruitment of skilled graduates. This could reveal, for example, that relatively little technological progress has been achieved due to a lack of relevant innovation inputs. However, this approach may suffer from temporal issues across indicators (see Section 6.3). The real explanatory power is likely to come from subsequent detailed qualitative case studies, that are selected on the basis of interesting system weaknesses/strengths and trends initially identified by this quantitative indicator framework.
6.2 Nation and firm-level comparisons
Country size may influence quantitative assessments of relative innovation performance. To remedy this, a combination of nation and firm-level comparisons have been undertaken to offer a more balanced view of performance. The two types of comparisons have generated different pictures. Nation-level comparisons ranks China an innovation leader except for EPO and USPTO filings and technology export, whereas firm-level comparison ranks Vestas the highest. This suggests that merely relying on nationally aggregated data may produce biased information, as large countries may be ranked higher from a national perspective. The excellent performance of Vestas implies that country size does not necessarily ensure that firms in large countries will rank above those from smaller countries; instead, firms in small countries can be very technologically competitive on the global stage. It also indicates that large countries can catch up fast in R&D expenditure, but it is a hard and slow process for them to leapfrog existing frontiers in technological capability. This may be attributable to the effect of cumulative R&D efforts. Innovation is a cumulative process in nature.
Despite some differences, there is broad consistency in the nation and firm-level comparisons. They both indicate that China has caught up fast in terms of wind energy R&D and is heading towards becoming the top R&D investor. China’s manufacturing capacity is huge, but the country lags significantly in EPO and USPTO filings, revenues and exports. The consistency between nation and firm-level comparisons suggests the overall reliability of the quantitative results.
6.3 Temporal issues between indicators
The framework can also offer insights into the effectiveness of innovation policy by dividing outputs and outcomes by inputs, such as publications or patents per unit of R&D spend (counts/million $), manufacturing or export capacity per unit of R&D (GW/million $) and installed capacity per unit of asset finance (GW/million $). However, time lags, such as those between R&D funding, publications, patents, commercialised innovation and technology diffusion, are very important and can skew results. Studies have identified a 2-10 years’ time lag between R&D funding and publications, and 4-12 years’ time lag between R&D funding and patents in the energy sector [116].
There are time lags between each indicator across the energy technology innovation process. Existing literature has mainly focused on the time lags between R&D funding and publications (or patents) (see [117-119]), while few studies have examined the time lags between R&D funding and later stages such as manufacturing, deployment and export. Some studies have used patent citations to estimate the time lags between a technical invention and subsequent diffusion. It was approximately 20 years (see [120, 121]), equivalent to the term of a patent - the period during which the patent protection is in force. The incomplete estimations of time lags across indicators are not sufficient to allow the normalisation of output and outcomes by inputs, nor outcomes by outputs.
Another issue is the estimation of cumulative effect of R&D in advancing technological innovation. It has been demonstrated in Section 5 that traditional industry leaders have continued to outperform China regarding EPO and USPTO patent filings and maximum unit capacity despite their temporal decline in R&D expenditure. This means that countries which temporarily cut R&D expenses can continue to perform well owing to their prior knowledge base and the cumulative effect of R&D (see [114, 122]). Applying a discount ratio like knowledge depreciation rate (see [117-119, 123, 124]) may help to account for temporal factors between indicators.
7. Conclusions
technology innovation chain (namely research, development, demonstration, market formation and diffusion), potentially offering a comprehensive assessment of innovation performance across different innovation activities and stages. The efficacy of the indicator framework is tested by applying it to the case of wind power, examining in particular China’s performance relative to the global market leaders - Denmark, Germany and the USA. It finds that China is beginning to lead in terms of inputs (e.g. R&D expenditure) and certain outputs (e.g. publications) but lags the world leaders in other indicators especially technical inventions and outcomes (e.g. export). The case study points to a set of methodological issues, which include the normalisation of indicators (or otherwise), nation and firm-level comparisons and timeliness.
Finally, further research on input, output and outcome metrics will be valuable for enriching and validating the indicator sets. The identification of correlations between indicators could be helpful in understanding which variables may have influenced a system’s performance most, however normalisation and temporal issues need to be carefully addressed to ensure meaningful comparisons are conducted. In addition, further examination of the use and limitations of existing energy innovation statistics may help improve the accessibility, quality and reliability of data.
Acknowledgements
Annex
Annex 1 Searching queries for bibliometric and patent analyses
Types Searching codes
Bibliometrics TI=(energ* OR electricity* OR power* OR blade* OR rotor* OR gearbox* OR generator* OR nacelle* OR tower* OR inverter* OR converter* OR transformer*) AND TS=(wind) Language: English
Document type: article, proceedings paper, book chapter, review Database: SCIE, ISI Web of Science
Patent analysis For PATSTAT (jointly established by the EPO and USPTO), CPC codes were referred to:
blades or rotors (Y02E 10/721)
components or gearbox (Y02E 10/722)
control of turbines (Y02E 10/723)
generator or configuration (Y02E 10/725)
nacelles (Y02E 10/726)
offshore towers (Y02E 10/727)
onshore towers (Y02E 10/728)
power conversion electric or electronic aspects (Y02E 10/76) For PIAS (developed by the SIPO), IPC code was referred to:
wind motors (F03D)
[image:20.595.74.527.125.329.2]Annex 2 Notes for figures
Figure 1: a) Unless indicated, all monetary data is calculated using exchange rates and converted into constant prices with 2015 as the base year; b) both public and private R&D is included. Figure 3: Patent data after 2011 was less reliable from the PATSTAT and thus excluded.
Figure 4: Manufacturing capacity for each country is aggregated based on a few companies’ data, i.e. Goldwind, United Power, Mingyang and Envision Energy for China, Vestas for Denmark, Siemens and Enercon for Germany, and GE for the USA.
References
[1] IEA, Energy Technology Perspective 2015: Mobilising innovation to Accelerate Climate Action, in, 2015.
[2] IPCC, Climate Change 2014: Synthesis Report. Contribution of Working Groups I, II and III to the Fifth Assessment Report of the Intergovernmental Panel on Climate Change [Core Writing Team, R.K. Pachauri and L.A. Meyer (eds.)], in, Geneva, Switzerland, 2014.
[3] J. Skea, The renaissance of energy innovation, Energy & Environmental Science, 7 (2014) 21. [4] Mission Innovation, Mission Innovation: Accelerate the Clean Energy Revolution, in, 2015. [5] Breakthrough Energy Coalition, Breakthrough Energy Coalition, in, 2016.
[6] C. Freeman, L. Soete, Developing science, technology and innovation indicators: What we can learn from the past, Research Policy, 38 (2009) 583-589.
[7] OECD, Frascati Manual, in, 2015.
[8] OECD, Eurostat, Oslo Manual, OECD, Paris, 2005.
[9] BP, BP Statistical Review of World Energy 2016, in, 2016.
[10] P. Ru, Q. Zhi, F. Zhang, X. Zhong, J. Li, J. Su, Behind the development of technology: The transition of innovation modes in China’s wind turbine manufacturing industry, Energy Policy, 43 (2012) 58-69.
[11] J. Gosens, Y.L. Lu, From lagging to leading? Technological innovation systems in emerging economies and the case of Chinese wind power, Energy Policy, 60 (2013) 234-250.
[12] Z.-y. Zhao, W.-j. Ling, G. Zillante, J. Zuo, Comparative assessment of performance of foreign and local wind turbine manufacturers in China, Renewable Energy, 39 (2012) 424-432.
[13] H.R. Zhao, S. Guo, L.W. Fu, Review on the costs and benefits of renewable energy power subsidy in China, Renewable & Sustainable Energy Reviews, 37 (2014) 538-549.
[14] B. Klagge, Z. Liu, P. Campos Silva, Constructing China’s wind energy innovation system, Energy Policy, 50 (2012) 370-382.
[15] J. Gosens, Y. Lu, From lagging to leading? Technological innovation systems in emerging economies and the case of Chinese wind power, Energy Policy, 60 (2013) 234-250.
[16] F. Urban, Y. Zhou, J. Nordensvard, A. Narain, Firm-level technology transfer and technology cooperation for wind energy between Europe, China and India: From North-South to South-North cooperation?, Energy for Sustainable Development, 28 (2015) 29-40.
[17] J. Fagerberg, Innovation: A Guide to the Literature, in: J. Fagerberg, D.C. Mowery, R.R. Nelson (Eds.) Oxford Handbook of Innovation, Oxford University Press, New York, 2005.
[18] N. Rosenberg, Inside the Black Box: Technology and Economics, Cambridge University Press, 1982.
[19] R.R. Nelson, National Innovation Systems: A Comparative Analysis, Oxford University Press, 1993.
[20] B.-Å. Lundvall, National Systems of Innovation: Toward a Theory of Innovation and Interactive Learning, Anthem Press, 1992.
[21] C. Freeman, Technology Policy and Economic Performance: Lessons from Japan, Continuum International Publishing, 1987.
[22] P. Cooke, Regional innovation systems: Competitive regulation in the new Europe, Geoforum, 23 (1992) 365-382.
[23] Malerba, Sectoral systems of innovation and production, Research Policy, 31 (2002) 18.
[24] A. Bergek, S. Jacobsson, B. Carlsson, S. Lindmark, A. Rickne, Analyzing the functional dynamics of technological innovation systems: A scheme of analysis, Research Policy, 37 (2008) 407-429.
[26] B. Carlsson, R. Stankiewicz, On the nature, function and composition of technological system, Journal of Evolutionary Economics, (1991) 26.
[27] C. Wilson, A. Grubler, K.S. Gallagher, G.F. Nemet, Marginalization of end-use technologies in energy innovation for climate protection, Nature Climate Change, 2 (2012) 780-788.
[28] K.S. Gallagher, A. Grübler, L. Kuhl, G. Nemet, C. Wilson, The Energy Technology Innovation System, Annual Review of Environment and Resources, 37 (2012) 137-162.
[29] C. Wilson, A. Grubler, The Energy Technology Innovation System, in: A. Grubler, C. Wilson (Eds.) Energy Technology Innovation: Learning from Historical Successes and Failures, Cambridge
University Press, 2014.
[30] C. Edquist, Systems of Innovation: Perspectives and Challenges, in: J. Fagerberg, D.C. Mowery, R.R. Nelson (Eds.) The Oxford Handbook of Innovation, Oxford University Press, 2005.
[31] J. Markard, B. Truffer, Technological innovation systems and the multi-level perspective: Towards an integrated framework, Research Policy, 37 (2008) 596-615.
[32] S. Borrás, C. Edquist, Competence Building: A Systemic Approach to Innovation Policy, in: Atlanta Conference on Science and Innovation Policy, 2013.
[33] Lundvall, National systems of production, innovation and competence building, Research Policy, (2002).
[34] C. Edquist, Design of innovation policy through diagnostic analysis: identification of systemic problems (or failures), Industrial and Corporate Change, 20 (2011) 1725-1753.
[35] C. Chaminade, B.-Å. Lundvall, J. Vang, K.J. Joseph, Designing Innovation Policies for
Development: Towards a Systemic Experimentation-based Approach, in: Bengt-Åke Lundvall, K.J. Joseph, Cristina Chaminade, J. Vang (Eds.) Handbook of Innovation Systems and Developing Countries: Building Domestic Capabilities in a Global Setting, Edward Elgar Publishing, 2009.
[36] B.Å. Lundvall, National Innovation Systems - Analytical Concept and Development Tool, Industry & Innovation, 14 (2007) 95-119.
[37] B.-A. Lundvall, K.J. Joseph, C. Chaminade, J. Vang, Handbook of Innovation Systems and
Developing Countries Building Domestic Capabilities in a Global Setting, in, Edward Elgar Publishing, 2009.
[38] A. Marin, V. Arza, The Role of Multinational Corporations in National Innovation Systems in Developing Countries: From Technology Diffusion to International Involvement in: B.-Å. Lundvall, K.J. Joseph, C. Chaminade, J. Vang (Eds.) Handbook of Innovation Systems and Developing Countries: Building Domestic Capabilities in a Global Setting, Edward Elgar Publishing, 2009.
[39] B. Carlsson, Internationalization of innovation systems: A survey of the literature, Research Policy, 35 (2006) 56-67.
[40] M. McKelvey, S. Bagchi-Sen, Innovation Spaces in Asia: Entrepreneurs, Multinational Enterprises and Policy, in, Edwar Elgar Publishing, 2015.
[41] S. Jacobsson, A. Johnson, The diffusion of renewable energy technology: an analytical framework and key issues for research, Energy Policy, 28 (2000) 625-640.
[42] S. Jacobsson, Transforming the energy sector: the evolution of technological systems in renewable energy technology, Industrial and Corporate Change, 13 (2004) 815-849.
[43] A. Bergek, M. Hekkert, S. Jacobsson, J. Markard, B. Sandén, B. Truffer, Technological innovation systems in contexts: Conceptualizing contextual structures and interaction dynamics, Environmental Innovation and Societal Transitions, 16 (2015) 51-64.
[44] A.J. Wieczorek, M.P. Hekkert, Systemic instruments for systemic innovation problems: A framework for policy makers and innovation scholars, Science and Public Policy, 39 (2012) 74-87. [45] C. Edquist, The Systems of Innovation Approach and Innovation Policy: An account of the state of the art, in: DRUID Conference, Aalborg, Denmark, 2001.
[47] S.K. Ruud Smits, The rise of systemic instruments in innovation policy, International Journal of Foresight and Innovation Policy (IJFIP), 1 (2004).
[48] A.J. Wieczorek, Towards sustainable innovation: Analysing and dealing with systemic problems in innovation systems, in, Utrecht University, 2014.
[49] A. Grübler, N. Nakićenović, D.G. Victor, Dynamics of energy technologies and global change, Energy Policy, 27 (1999) 247-280.
[50] A. Grubler, F. Aguayo, F. Aguayo, K. Gallagher, M. Hekkert, K. JIANG, L. Mytelka, L. Neij, G. Nemet, C. Wilson, P.D. Andersen, L. Clarke, L.D. Anadon, S. Fuss, M. Jakob, D. Kammen, R. Kempener, O. Kimura, B. Kiss, A. O’Rourke, R.N. Schock, P.T.d.S. Jr., Policies for the Energy
Technology Innovation System (ETIS), in: GEA (Ed.) Global Energy Assessment - Toward a Sustainable Future, Cambridge University Press, Cambridge, UK and New York, NY, USA and the International Institute for Applied Systems Analysis, Laxenburg, Austria, 2012.
[51] K.S. Gallagher, J.P. Holdren, A.D. Sagar, Energy Technology Innovation, Annual Review of Environment and Resources, 31 (2006) 193-237.
[52] S.O. Negro, M.P. Hekkert, R.E. Smits, Explaining the failure of the Dutch innovation system for biomass digestion - A functional analysis, Energy Policy, 35 (2007) 925-938.
[53] R.A.A. Suurs, Motors of Sustainable Innovation: Towards a theory on the dynamics of technological innovation systems, in, Utrecht University, 2009.
[54] A.B. Klitkou, Mads; Iversen, Eric, Energy Innovation Systems Indicator Report 2012, in, Department of Management Engineering, Technical University of Denmark, 2012.
[55] V. Vasseur, L.M. Kamp, S.O. Negro, A comparative analysis of Photovoltaic Technological Innovation Systems including international dimensions: the cases of Japan and The Netherlands, Journal of Cleaner Production, 48 (2013) 200-210.
[56] K.S. Gallagher, J.P. Holdren, A.D. Sagar, Energy-Technology Innovation, Annual Review of Environment and Resources, 31 (2006) 193-237.
[57] M. Borup, A. Klitkou, M.M. Andersen, D.S. Hain, J.L. Christensen, K. Rennings, Indicators of energy innovation systems and their dynamics, in, 2013.
[58] C. Wilson, Metrics for Assessing Energy Technology Innovation, in: A. Grubler, F. Aguayo, K. Gallagher, M. Hekkert, K. JIANG, L. Mytelka, L. Neij, G. Nemet, C. Wilson, P.D. Andersen, L. Clarke, L.D. Anadon, S. Fuss, M. Jakob, D. Kammen, R. Kempener, O. Kimura, B. Kiss, A. O’Rourke, R.N. Schock, P.T.d.S. Jr. (Eds.) Policies for the Energy Technology Innovation System (ETIS) International Institute for Applied Systems Analysis; Cambridge University Press, 2012.
[59] C. Kettner, A. Köppl, T. Steffl, H. Warmuth, Energy Innovation Scoreboard 2014, in, 2014. [60] A. Klitkou, L. Scordato, E. Iversen, Nordic Energy Technology Scoreboard 2010, in, 2010. [61] OECD, Main Science and Technology Indicators, in, 2015.
[62] OECD, OECD Science, Technology and Industry Scoreboard, in, Paris, 2015, pp. 260. [63] OECD, Science, Technology and Industry Outlook 2014, in, 2014.
[64] H. Hollanders, N. Es-Sadki, M. Kanerva, Union Innovation Scoreboard, in, 2015. [65] S. Dutta, B. Lanvin, S. Wunsch-Vincent, Global Innovation Index 2015, in, 2015.
[66] A.D. Sagar, J.P. Holdren, Assessing the global energy innovation system: some key issues, Energy Policy, 30 (2002) 465-469.
[67] H. Hollanders, N. Es-Sadki, Innovation Union Scoreboard, in, 2013. [68] IEA, Energy Technology Perspectives 2012, in, 2012.
[69] K.S. Gallagher, The Globalisation of Clean Energy Technology: Lessons from China, The MIT Press, Cambridge, Massachusetts; London, England, 2014.
[70] M.A. Schilling, M. Esmundo, Technology S-curves in renewable energy alternatives: Analysis and implications for industry and government, Energy Policy, 37 (2009) 1767-1781.
[71] OECD, Frascati Manual 2015: Guidelines for Collecting and Reporting Data on Research and Experimental Development, OECD, 2015.
[73] The National Academies of Sciences.Engineering.Medicine, Supporting and Strengthening the Energy Innovation Process to Expand the Technological Base for Increasingly Clean Electric Power, in: T.N.A.o. Sciences.Engineering.Medicine (Ed.) The Power of Change: Innovation for Development and Deployment of Increasingly Clean Electric Power Technologies, National Academies Press, Washington, DC, 2016, pp. 51.
[74] FS-UNEP Collaborating Centre/BNEF, Global Trends in Renewable Energy Investment 2016, in, 2016.
[75] X. Ouyang, B. Lin, Impacts of increasing renewable energy subsidies and phasing out fossil fuel subsidies in China, Renewable and Sustainable Energy Reviews, 37 (2014) 933-942.
[76] G. Verbong, F. Geels, The ongoing energy transition: Lessons from a socio-technical, multi-level analysis of the Dutch electricity system (1960–2004), Energy Policy, 35 (2007) 1025-1037.
[77] T.J. Foxon, R. Gross, A. Chase, J. Howes, A. Arnall, D. Anderson, UK innovation systems for new and renewable energy technologies: drivers, barriers and systems failures, Energy Policy, 33 (2005) 2123-2137.
[78] T. Couture, Y. Gagnon, An analysis of feed-in tariff remuneration models: Implications for renewable energy investment, Energy Policy, 38 (2010) 955-965.
[79] J. Shen, C. Luo, Overall review of renewable energy subsidy policies in China – Contradictions of intentions and effects, Renewable and Sustainable Energy Reviews, 41 (2015) 1478-1488.
[80] M. Alashaal, Is Subsidy Good or Bad? An Evaluation of the Energy Sector Subsidy Reform in Egypt (April 20, 2015), Available at SSRN: https://ssrn.com/abstract=2596621 or
http://dx.doi.org/10.2139/ssrn.2596621, (2015).
[81] P. Nahi, Government Subsidies: Silent Killer Of Renewable Energy, in: E. Savitz (Ed.) Forbes, 2013.
[82] DOE, U.S. Department of Energy Office of Science Laboratories, in, DOE, 2015.
[83] D. Foray, D.C. Mowery, R.R. Nelson, Public R&D and social challenges: What lessons from mission R&D programs?, Research Policy, 41 (2012) 1697-1702.
[84] T.U. Daim, G. Rueda, H. Martin, P. Gerdsri, Forecasting emerging technologies: Use of
bibliometrics and patent analysis, Technological Forecasting and Social Change, 73 (2006) 981-1012. [85] Y. Kajikawa, Y. Takeda, Citation network analysis of organic LEDs, Technological Forecasting and Social Change, 76 (2009) 1115-1123.
[86] T.N.V. Leeuwen, H.F. Moed, R.J.W. Tijssen, M.S. Visser, A.F.J.V. Raan, Language biases in the coverage of the Science Citation Index and its consequencesfor international comparisons of national research performance, Scientometrics, 51 (2001) 12.
[87] G. Park, Y. Park, On the measurement of patent stock as knowledge indicators, Technological Forecasting and Social Change, 73 (2006) 793-812.
[88] OECD, Patent Statistics Manual, in, 2009.
[89] C. Wilson, Up-scaling, formative phases, and learning in the historical diffusion of energy technologies, Energy Policy, 50 (2012) 81-94.
[90] A. Verbruggen, M. Fischedick, W. Moomaw, T. Weir, A. Nadaï, L.J. Nilsson, J. Nyboer, J. Sathaye, Renewable energy costs, potentials, barriers: Conceptual issues, Energy Policy, 38 (2010) 850-861. [91] IRENA, Renewable Energy Cost Analysis: Biomass for Power Generation, in, 2012.
[92] X. Lu, M.B. McElroy, W. Peng, S. Liu, C.P. Nielsen, H. Wang, Challenges faced by China compared with the US in developing wind power, Nature Energy, 1 (2016) 16061.
[93] J.R. Baldwin, Trade Liberalization: Export-market Participation, Productivity Growth, and Innovation, Oxford Review of Economic Policy, 20 (2004) 372-392.
[94] C. Li, H. Shi, Y. Cao, J. Wang, Y. Kuang, Y. Tan, J. Wei, Comprehensive review of renewable energy curtailment and avoidance: A specific example in China, Renewable and Sustainable Energy Reviews, 41 (2015) 1067-1079.
[96] K. Riahi, A. Grubler, N. Nakicenovic, Scenarios of long-term socio-economic and environmental development under climate stabilization, Technological Forecasting and Social Change, 74 (2007) 887-935.
[97] P. Zhou, B.W. Ang, J.Y. Han, Total factor carbon emission performance: A Malmquist index analysis, Energy Economics, 32 (2010) 194-201.
[98] World Bank, Gross domestic product 2015, in, The World Bank Group, 2016.
[99] United Nations, The World Population Prospects: 2015 Revision, in, United Nations Department of Economic and Social Affairs, Population Division, Population Estimates and Projections Section, 2015.
[100] Goldwind, Goldwind Annual Report 2015 (in Chinese), in, 2016.
[101] OECD, Main Science and Technology Indicators - Online Statistics, in, The OECD, 2016. [102] Vestas, Vestas Annual Report 2015, in, 2016.
[103] Siemens, Siemens Annual Report 2015, in, 2016. [104] GE, GE Annual Report 2015, in, 2016.
[105] A. Maddison, The World Economy: A Millennial Perspective, OECD, Paris, 2001. [106] BNEF, Bloomberg Desktop Database, in, Bloomberg New Energy Finance, 2016. [107] WoS, Science Citation Index-Expanded, ISI Web of Science, in, 2016.
[108] EPO, USPTO, Worldwide Patent Statistical Database (PATSTAT), in, 2016.
[109] SIPO, Patent Infomration Analysis System (PIAS), in, State Intellectual Property Office (SIPO) of P.R. China, 2016.
[110] United Nations, UN Comtrade - International Trade Statistics Database, in, United Nations, 2016.
[111] IIASA, GAINS Model, in, 2015.
[112] REN21, Renewables 2016 Global Status Report, in, 2016.
[113] CWEA, China's Wind Power Capacity Statistics 2015 (in Chinese), Wind Energy, (2016) 16. [114] P. Laurens, C. Le Bas, S. Lhuillery, A. Schoen, The determinants of cleaner energy innovations of the world’s largest firms: the impact of firm learning and knowledge capital, Economics of
Innovation and New Technology, 26 (2016) 311-333.
[115] GWEC, IRENA, 30 Years of Policies for Wind Energy: Lessons from 12 Wind Energy Markets, in, 2012.
[116] D. Popp, Economic analysis of scientific publications and implications for energy research and development, Nature Energy, 1 (2016) 16020.
[117] G. Klaassen, A. Miketa, K. Larsen, T. Sundqvist, The impact of R&D on innovation for wind energy in Denmark, Germany and the United Kingdom, Ecological Economics, 54 (2005) 227-240. [118] T. Daim, M. Monalisa, P. Dash, N. Brown, Time lag assessment between research funding and output in emerging technologies, Foresight, 9 (2007) 33-44.
[119] G.A. Crespi, A. Geuna, An empirical study of scientific production: A cross country analysis, 1981–2002, Research Policy, 37 (2008) 565-579.
[120] B. Lee, I. Iliev, F. Preston, Who Owns Our Low Carbon Future - Intellectual Property and Energy Technologies, in, Chatham House, 2009.
[121] E. Verdolini, M. Galeotti, At home and abroad: An empirical analysis of innovation and diffusion in energy technologies, Journal of Environmental Economics and Management, 61 (2011) 119-134.
[122] J. West, M. Iansiti, Experience, experimentation, and the accumulation of knowledge: the evolution of R&D in the semiconductor industry, Research Policy, 32 (2003) 809-825. [123] I. Kim, H.L. Seo, Depreciation and transfer of knowledge: an empirical exploration of a shipbuilding process, International Journal of Production Research, 47 (2009) 1857-1876.
[124] G. Li, S. Rajagopalan, A learning curve model with knowledge depreciation, European Journal of Operational Research, 105 (1998) 143-154.
Biographic note
Rui Hu is a PhD candidate at the Centre for Environmental Policy, Imperial College London, with a research focus on energy innovation policy. His PhD project is to study China’s wind energy innovation system. A core objective of this project is to develop an indicator framework that links metrics to energy technology innovation system.
Jim Skea is a Professor of Sustainable Energy at the Centre for Environmental Policy, Imperial College London. He has particular research interests in energy, climate change and technological innovation, and has always worked in interdisplinary settings. He is currently leading a research programme for measuring the effectiveness of energy innovation systems across countries and technologies.