This is a repository copy of
Determining the effect of drying time on phosphorus
solubilization from three agricultural soils under climate change scenarios
.
White Rose Research Online URL for this paper:
http://eprints.whiterose.ac.uk/127126/
Version: Published Version
Article:
Forber, Kirsty, Ockenden, Mary, Wearing, C et al. (12 more authors) (2017) Determining
the effect of drying time on phosphorus solubilization from three agricultural soils under
climate change scenarios. Journal of environmental quality. pp. 1131-1136. ISSN
0047-2425
https://doi.org/10.2134/jeq2017.04.0144
[email protected] https://eprints.whiterose.ac.uk/
Reuse
This article is distributed under the terms of the Creative Commons Attribution (CC BY) licence. This licence allows you to distribute, remix, tweak, and build upon the work, even commercially, as long as you credit the authors for the original work. More information and the full terms of the licence here:
https://creativecommons.org/licenses/
Takedown
If you consider content in White Rose Research Online to be in breach of UK law, please notify us by
Abstract
Climate projections for the future indicate that the United Kingdom will experience hotter, drier summers and warmer, wetter winters, bringing longer dry periods followed by rewetting. This will result in changes in phosphorus (P) mobilization patterns that will inluence the transfer of P from land to water. We tested the hypothesis that changes in the future patterns of drying–rewetting will afect the amount of soluble reactive phosphorus (SRP) solubilized from soil. Estimations of dry period characteristics (duration and temperature) under current and predicted climate were determined using data from the UK Climate Projections (UKCP09) Weather Generator tool. Three soils (sieved <2 mm), collected from two regions of the United Kingdom with diferent soils and farm systems, were dried at 25°C for periods of 0, 2, 4, 5, 6, 8, 10, 15, 20, 25, 30, 60, and 90 d, then subsequently rewetted (50 mL over 2 h). The solubilized leachate was collected and analyzed for SRP. In the 2050s, warm period temperature extremes >25°C are predicted in some places and dry periods of 30 to 90 d extremes are predicted. Combining the frequency of projected dry periods with the SRP concentration in leachate suggests that this may result overall in increased mobilization of P; however, critical breakpoints of 6.9 to 14.5 d dry occur wherein up to 28% more SRP can be solubilized following a rapid rewetting event. The precise cause of this increase could not be identiied and warrants further investigation as the process is not currently included in P transfer models.
Determining the Efect of Drying Time on Phosphorus Solubilization
from Three Agricultural Soils under Climate Change Scenarios
K. J. Forber,* M. C. Ockenden, C. Wearing, M. J. Hollaway, P. D. Falloon, R. Kahana, M. L. Villamizar, J. G. Zhou, P. J. A. Withers, K. J. Beven, A. L. Collins, R. Evans, K. M. Hiscock, C. J. A. Macleod, and P. M. Haygarth
A
gricultural difuse pollution from soil causes signiicant pressure on water quality (European Commission, 2012). he challenges of mitigating agri-cultural phosphorus (P) pollution are complex (Kleinman et al., 2015), and despite signiicant eforts to reduce difuse P pollu-tion, evidence suggests success is rare and poor water quality pro-liferates ( Jarvie et al., 2013). Such challenges will become more prevalent as pressures driven by climate change increase.In large parts of Europe, the frequency of warm days (i.e., heat waves) has likely increased (IPCC, 2014). Globally, the probability of heat waves occurring has more than doubled in some locations (IPCC, 2014). he UK Climate Projections (UKCP09; UKCP, 2009) provides probabilistic estimates for temperature change and other climatic variables (which do not include event duration, e.g., dry spells) in the United Kingdom. Under a medium emissions scenario, the mean annual tempera-ture in England is projected to increase between 0.9 and 4.0°C by the 2050s when compared to the 1961 to 1990 climate mean, with a central estimate of 3.6°C warming. Summer temperatures are projected to rise even more, (1.0–4.6°C) with a central esti-mate of 4.1°C and higher increases in the southeast of England (1.3–4.6°C) than the northwest of England (1.2–4.1°C). Summer rainfall is also likely to decrease in both the northwest (-36 to 1%) and the southeast (-41 to 7%) of England. Current high resolution climate models (1.5-km grid spacing) indicate that hourly rainfall intensities will increase in both summer and winter months (Kendon et al., 2014). Hence, dry periods of increased duration followed by intense rewetting will likely become more prevalent. For catchments where the main source of P is agricultural, most annual total P loads are transferred during high discharge events (Ockenden et al., 2016), of which a
Abbreviations: DRW, drying–rewetting; DTC, demonstration test catchment; SRP, soluble reactive phosphorus; UKCP09, UK Climate Projections.
K.J. Forber, M.C. Ockenden, C. Wearing, M.J. Hollaway, K.J. Beven, and P.M. Haygarth, Lancaster Environment Centre, Lancaster Univ., Lancaster LA1 4YQ, England; P. D. Falloon and R. Kahana, Met Oice Hadley Centre, Exeter, Devon EX1 3PB, England; M.L. Villamizar, School of Engineering, Liverpool Univ., L69 3GQ, England; J.G. Zhou, School of Computing, Mathematics and Digital Technology, Manchester Metropolitan Univ., Manchester M1 5GB, England; P.J.A. Withers, Bangor Univ., Bangor, Gwynedd LL58 8RF, Wales; A.L. Collins, Rothamsted Research North Wyke, Okehampton, Devon EX20 2SB, England; R. Evans, Global Sustainability Institute, Anglia Ruskin Univ., Cambridge CB1 1PT, England; K.M. Hiscock, Univ. of East Anglia, Norwich NR4 7TJ, England; C.J.A. Macleod, James Hutton Institute, Aberdeen AB15 8QH, Scotland. Assigned to Associate Editor Sam Carrick.
Copyright © American Society of Agronomy, Crop Science Society of America, and Soil Science Society of America. 5585 Guilford Rd., Madison, WI 53711 USA. All rights reserved.
J. Environ. Qual. 46:1131–1136 (2017) doi:10.2134/jeq2017.04.0144
This is an open access article distributed under the terms of the CC BY license (https://creativecommons.org/licenses/by/4.0/)
Supplemental material is available online for this article. Received 11 Apr. 2017.
Accepted 22 Aug. 2017.
*Corresponding author ([email protected]).
Journal of Environmental Quality
Short CommuniCAtionS
Core ideas
• UK Climate Projections predict long dry hot periods followed by intense rainfall.
• Frequency of longer dry periods increase under climate change. • Critical breakpoints of 7–15 dry days have been identiied that solubilize more P from soil.
• Increased dry period frequency will result in an overall increase in SRP concentration solubilized.
1132 Journal of Environmental Quality
signiicant portion is bioavailable dissolved P ( Joosse and Baker, 2011). herefore, increased frequency of extreme meteorologi-cal and hydrologimeteorologi-cal events in the future is likely to increase the transfer of P to water bodies (Ockenden et al., 2016), increas-ing the risk of eutrophication. It seems likely that climate change will alter the degree, rate, and frequency of drying–rewetting (DRW) events, so altering the nutrient cycling of P within soils as it undergoes both abiotic and biotic stress. Such changes may alter the amount and form of P mobilized via solubilization and detachment, consequently increasing the amount of P that can undergo transport and afect watercourses, as described by the P transfer continuum (Haygarth et al., 2005).his is especially important to consider into the future as, although net P inputs to land may decline, accumulated P stores will continue to be mobilized, posing continual and long-term risks to watercourses (Powers et al., 2016).
Evidence suggests that DRW events cause an increase in soil nutrient availability in leachate (Blackwell et al., 2009, 2012; Bünemann et al., 2013; Butterly et al., 2011b; Nguyen and Marschner, 2005; Soinne et al., 2010; Xu et al., 2011). Drying soils to a gravimetric water content of <10% (w/w) signii-cantly increases P mobilization at rewetting, especially at <2.5% (Bünemann et al. (2013) and 2 to 4% (Dinh et al., 2017). his increase in P availability in dried soil on rewetting has been attrib-uted to microbial cell lysis (Turner and Haygarth, 2001), yet it is probable that a signiicant proportion is of nonmicrobial origin organic P or inorganic P (Blackwell et al., 2009; Bünemann et al., 2013; Butterly et al., 2009, 2011b). For example, high organic carbon (C) soils can result in signiicantly more available P ater drying and rewetting (Nguyen and Marschner, 2005; Styles and Coxon, 2006). Chen et al. (2016) also found that frequent DRW cycles can cause greater, more long lasting impacts on soil biomass P dynamics than carbon dynamics. In addition, soils with high microbial biomasses yield more P on rewetting (Styles and Coxon, 2006), especially if the community is not resilient to DRW cycles (Butterly et al., 2011a; Fierer et al., 2002; Pailler et al., 2014; Wang et al., 2013). Drying can induce the oxidation of soil organic C–Fe and –Al associations (Bartlett and James, 1980; Haynes and Swit, 1985; Schlichting and Leinweber, 2002) and thus directly release organic P and indirectly release inorganic P via mineralization that is subsequently stimulated (Styles and Coxon, 2006). Slaking has also been identiied as one the most important mechanisms to disrupt soil aggregate struc-ture and integrity, exposing speciic surface areas to desorb both inorganic and organic P (from nonliving organic matter) from dried soil as it is rewetted (Bünemann et al., 2013; Chepkwony et al., 2001). Upon drying without rewetting however, some (peat) soils can further adsorb more P associated with these organic matter complexes (which are also more extractable if rewetted) (Schlichting and Leinweber, 2002). his has been observed in the ield in western Ireland, where during summer, lower mois-ture contents and higher P sorption capacities can bufer against P loss even following P application (Styles and Coxon, 2007).
Despite this, as far as we are aware, there is no literature on the efect of the duration of drying period of the soil on the solubili-zation of P ater a rapid rewetting event. his needs to be known if we are to consider the efects of predicted climatic change. In addition, such information may help inform land managers of optimum P application timings during the growing season.
Our experiment was designed to inform a multimodel exer-cise that explores model performance and/or prediction of trans-port of nutrients in the Defra (Department for the Environment and Rural Afairs)-funded UK Demonstration Test Catchments (DTCs) (McGonigle et al., 2014) under climate change. In this study, three subcatchments were chosen to represent two of the DTCs. hese subcatchments are included in extensive catch-ment-scale research platforms that explore the efects of difuse agricultural pollution on stream ecosystems (Ockenden et al., 2016; Outram et al., 2014, 2016; Snell et al., 2014; Wade et al., 2012). In this study, we test the hypothesis that changes in the future patterns of DRW will afect the amount of soluble reac-tive phosphorus (SRP) solubilized. he speciic objecreac-tives were (i) to determine how the duration and frequency of dry periods would change from present day to the future (2050) at the local scale for three UK catchments; (ii) to use laboratory experiments on soils from the three catchments to determine how the dura-tion of drying period before an intense rewetting event afects the amount of SRP solubilized and measured in leachate; and (iii) to combine the frequency and duration of future dry periods with the results of laboratory experiments to estimate how total SRP solubilized ater DRW events may change.
Materials and Methods
Estimation of Dry Period Characteristics
he UKCP09 Weather Generator (UKCP, 2009) was used to determine characteristics of temperature (25°C for extreme dry periods) and dry period duration in the future (up to 90 d), which were used to inform the DRW event in our experiment. Further details are given in Supplemental Material.
Choice of Sampling Location
Soils were chosen to represent the diferent land uses and soils within the Eden and Wensum DTCs. Newby Beck (12.5 km2,
54.59° N, 2.62° W) and Pow Beck (10.5 km2, 54.84° N, 2.96° W)
are two rural headwater subcatchments within the Eden DTC, Cumbria, UK. he Newby Beck subcatchment is predominantly improved grassland (76%); soil was collected from a ield that is grazed on rotation by sheep and dairy cattle (P2O5 application
rate 28.76 kg P ha-1 for 2014). Pow Beck is also predominantly
improved grassland (46%) and is more intensively farmed than Newby Beck; soil was collected from a ield in which beef cattle are grazed (no recorded P applied for 2014). Limited fertilizer and slurry application data are available for these two catch-ments (see Supplemental Material). he Blackwater (19.7 km2,
52.78° N, 1.15° E) is a subcatchment within the Wensum DTC, Norfolk, UK. Soil was also collected from an arable (winter wheat [Triticum aestivum L.]) ield within the Blackwater (2013–2014 spring bean [Phaseolus vulgaris L.] rotation with an inorganic and organic P application rate of 1–49 kg P ha-1 [Outram et al.,
2016]). Detailed farm business data for the Blackwater are pub-lished in Outram et al. (2016), and further information can be found in the Supplemental Material.
Soil Type, Collection, and Preparation
dug and a bulk sample was removed inclusive of plant mate-rial present. Soil samples were sieved wet to 2 mm, removing visible plant and root material, and kept in sealed bags at 4°C until use. Soils from the Newby and Pow catchments are similar (Typic Haplaquept Inceptisols or Chromic Eutric Albic Luvic Stagnosols [Cranield University, 2017; IUSS Working Group WRB, 2015]), the Newby soil being of ine loamy texture, and the Pow soil ine and coarse loamy. he Blackwater soil (Aquic Dystrochept Inceptisol or Endostagnic Luvisols [Cranield University, 2017; IUSS Working Group WRB, 2015]) is a loamy and clayey soil (NSRI, 2014), characterized by a subsurface accu-mulation of clays. For Olsen’s P analysis, soil was air-dried to a constant weight and sieved to 2 mm. For further chemical analy-sis, prepared soil was ground using a pestle and mortar for C, nitrogen (N), and total soil P analysis. Soil pH was measured in a deionized water suspension using a Jenway 3510 according to Rowell (1994). Soil C and N percentages were measured using a Vario El Elemental Analyzer, and C/N was calculated. Total soil P was determined by wet oxidation digestion (Rowland and Grimshaw, 1985) and Olsen’s P was determined by the method of Olsen and Sommers (1982); both were measured according to Murphy and Riley (1962) (Seal Analytical AQ2+).
Soil Drying and Rewetting
Soils were prepared according to the method from Blackwell et al. (2009). Soils were pre-incubated at 25°C for 24 h prior to being dried. Soil samples of approximately 300 g were then air-dried undisturbed in a temperature-controlled room ixed at 25°C in 2-L rectangular tubs for each drying increment. he temperature (25°C) and maximum duration of dry period (90 d) were justiied from UKCP09 as indicative of the most extreme dry periods in the future for these sites. Newby and Pow soils were dried for 0, 2, 4, 5, 6, 8, 10, 15, 20, 25, 30, 60, and 90 d. he Blackwater soil was dried for 0, 5, 10, 15, 20, 25, 30, 60, and 90 d as a limited amount of soil was available. Matric potential was measured using a Decagon WP4-C Dewpoint Potentiometer in three subsamples for each drying period. Five subsamples (21 g dry wt. equivalent) of soil for each drying period were removed and placed into 50-mL plastic conical funnels each plugged with 0.3 g of nonabsorbent glass wool. he soil was loosely packed in the funnel by gently tapping and placed in a centrifuge tube. All soil was then rewetted over 2 h (50 mL, pipetting 5-mL ali-quots evenly spaced over 2 h); 0.45-mm Whatman ilter paper was placed on the soil surface to aid even distribution of water; leachate was collected in the centrifuge tube. A rewetting rate of 25 mL over 2 h was used in Blackwell et al. (2009) and resulted in the most signiicant leaching of dissolved P in those experi-ments; it was therefore doubled here to increase the intensity of the rewetting event. Filtered (using 0.45-mm syringe ilters) leachate samples were used to measure SRP according to Murphy and Riley (1962) using a hermo Scientiic Multiskan GO Plate Reader. Information regarding statistical analysis can be found in the Supplemental Material.
Results and Discussion
Change in Duration and Temperature of Dry Period
he 95th percentile (mean average over 100 runs) duration of dry periods increased in both catchments between the present
day and the future scenario period; dry periods increased by up to 40% for the Blackwater and 25% for Newby Beck (Supplemental Table S1). here was a 17, 23, and 7% increase in the frequency periods of 11- to 15-d dry in the Newby, Pow, and Blackwater catchments in the scenario period (Supplemental Fig. S1 and S2). he frequency of dry periods of >16 d increased in the scenario period in all catchments; however, dry periods between 1 and 5 d either increased by <1.5% (Newby and Pow) or decreased in fre-quency (Blackwater) under climate change (Supplemental Fig. S3). he 90th percentile of mean average temperature during dry periods (Supplemental Fig. S2) increased by ~3°C in each catch-ment (Supplecatch-mental Table S2). Under climate change, longer periods of dry weather (extremes 90 d) at higher temperatures (extremes 25°C) may be experienced. hese results were used to inform the laboratory experimental design to ensure the proba-bilistic range indicated by the weather generator was covered.
Diference Between Soils in Diferent Catchments
he C and N percentages for the Newby (4.18, 0.47) and Pow (6.43, 0.62) soils were greater than the Blackwater soil (1.47, 0.17) (Supplemental Table S2). he C/N ratios were cal-culated as 8.89, 10.37 and 8.65 for Newby, Pow, and Blackwater, respectively, with soil pH determined as 5.84, 5.56, and 5.78. he Blackwater soil had a lower initial total P content (780 mg kg-1) than Newby (1600 mg kg-1) and Pow (1200 mg kg-1)
soils. Available P (Olsen’s P) was the same in the Blackwater and Newby soils (3.4 mg kg-1); Pow had a highest content (12.8
mg kg-1). Moisture content for Newby, Pow, and Blackwater
soils was 32.93, 34.97, and 14.65% respectively (Supplemental Table S2). he matric potential at 0 d dry was similar between soils, measured as -0 (0), -0.24 (0.11), and -0.46 (0.095) for Newby, Pow, and Blackwater. Bulk density was not determined a priori in this experiment but was estimated for each soil type in this location as 1.22, 1.2, and 1.4 g cm-3 for Newby, Pow, and
Blackwater, respectively (NSRI, 2014).
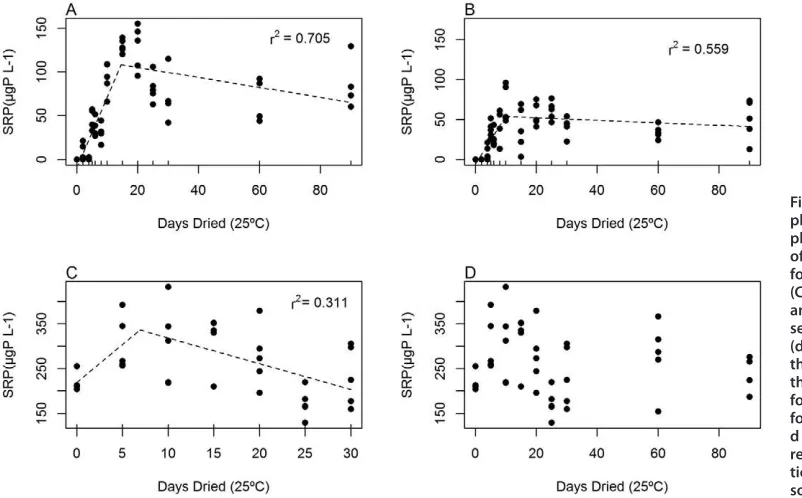
Figure 1 describes the concentration of SRP (mg L-1) in
leach-ate subsequent to rewetting for each replicleach-ate at the individual drying increments. In the Pow and Newby soils, SRP concentra-tions were outside the detectable limit in leachate samples from soils dried between 0 and 2 d; these are therefore reported as 0. At 90 d, the SRP concentration in leachate was higher than that reported at 0 d for all soils (Supplemental Table S4). However, the highest concentration of SRP was measured in leachate from soil dried for the duration of 15 d for Newby (129.7 ± 7.7 mg L-1), 10 d for Pow (68.1 ± 23.2 mg L-1), and 20 d for Blackwater
(305.9 ± 67.8 mg L-1) soils. here was no signiicant diference
between the volume of leachate collected at each drying incre-ment; the mean average volume collected for Newby, Pow and Blackwater was 35.9 (± 3.4), 38.7 (± 3.4), and 40.3 (± 2.1) mL, respectively. herefore, the relationship between time dried and load of SRP (mg P) was similar to the relationship between time dried and concentration of SRP (mg L-1), as conidence intervals
for the breakpoints overlap (Fig. 1, Supplemental Fig. S4). Analysis identiied breakpoints at 14.5 ± 1.8 d (r2 = 0.705)
for Newby, 10.0 ± 1.4 d (r2 = 0.559) for Pow, and 6.9 ± 2.3 d (r2
1134 Journal of Environmental Quality
the number of dry days, but ater this point, the amount of SRP solubilized was reduced or stayed fairly constant. he Newby soil identiies well with the model (r2 = 0.705), yet contrastingly, the
Blackwater soil does not (r2 = 0.311). Greater percentage C does
not yield greater concentrations of SRP in leachate, but it may account for the more pronounced breakpoint response from the Newby and Pow soils (Nguyen and Marschner, 2005). here was not, however, a clear decrease of mean average SRP concentra-tion in leachate between each drying increment subsequent to the breakpoint (Supplemental Table S4). At these breakpoints, nonetheless, up to 28% more SRP in leachate was yielded (solu-bilized) than in lesser and longer drying periods.
Matric potential in all soils rapidly increased (values more negative) between 0 and 5 d of drying time (Supplemental Table S4). Breakpoints were identiied for all soils at 5.3 ± 0.2 d (r2
= 0.943) (mean average reported). Ater this breakpoint, matric potential did not change signiicantly, meaning that the ability of water to move through the soils remained similar. Soil prepara-tion (sieving to 2 mm), along with the experimental condiprepara-tions under which the soils were dried (temperature controlled room at 25°C), could have signiicantly exacerbated the drying process, resulting in the shorter matric potential breakpoint compared with the SRP breakpoint. As the breakpoint drying times have been identiied in a laboratory environment, they are likely to difer in the ield, where it would take longer to attain the same
degree of dryness (matric potential). However, the frequency of longer drying events increases under climate change, so the efect may still be true in the ield and, indeed, be more pronounced as drying will predominantly occur at the surface (where P is more concentrated), gradually spreading down the soil proile to, for example, the depth sampled here. Soil preparation likely removed some of the natural drying features that would occur to soil in the ield on drying, as sieving can remove preferential low character-istics (Koestel et al., 2012) that can enhance P loss to waterbodies (Sharpley et al., 2013) and root removal can modify soil struc-ture and afect water retention (Daly et al., 2015). Nonetheless, some artiicial pathways would have been created as the dry soil was repacked, in addition to the microcracks potentially formed on rewetting (Grant and Dexter, 1989), afecting the rate of water low with difering kinetic energies (Blackwell et al., 2009) and possibly contributing to the variation between repetitions of SRP concentration in leachate. Increased cracking and preferen-tial pathways, together with increased hydrophobicity of the soil, may be responsible for the diminished SRP concentration ater the breakpoint; further investigation is warranted as to whether this process was the cause for the observed breakpoint. With this dataset, however, no relationship could be found between matric potential and SRP concentration in leachate.
[image:5.594.40.441.34.283.2]Increased frequency of dry periods between 6 and 55 d under climate change could yield a total change in mobilized
Fig. 1. Soluble reactive phosphorus (SrP) (mg P L−1)
plotted against the duration of time dried (at 25°C) in days for the (A) newby, (B) Pow, and (C) Blackwater (0–30 d data), and (D) complete dataset. the segmented model prediction (dashed line) suggests that the signiicant breakpoint in the data is at 14.5 (r2 = 0.705)
for newby, 10.0 (r2 = 0.559)
for Pow, and 6.9 (r2 = 0.311)
d for Blackwater, where the relationship between the dura-tion of time (d) dried and SrP solubilization changes.
table 1. results of segmented linear regression for newby Beck, Pow Beck, and Blackwater soils (standard error) for matric potential and soluble reactive phosphorus (SrP), and the increased frequency of breakpoints and potentially leachable SrP under uKCP09 medium emissions climate change.
Soil Breakpoint (d)SrP
Segmented regression R2
SrP
Potentially leachable SrP at breakpoint (segmented model)
Potentially leachable SrP at breakpoint (collected data)
increased frequency of
breakpoint occurring under
climate change
increased potentially leachable SrP under climate change (6–55 d)
increased frequency of 7–15
dry d occurring under climate
change
d ———— mg P L-1 ———— ——————————— % ———————————
Newby 14.5 (1.8) 0.705 108 129 (8) 28 13 6
Pow 10.0 (1.4) 0.559 318 68 (23) 13 11 8
[image:5.594.41.545.641.742.2]SRP via solubilization of 13, 11, and -1% for Newby, Pow, and Blackwater soils, respectively (Table 1). Increased frequency of dry periods of 11 to 55 d under climate change could yield a total change in SRP solubilized of 31, 38, and 21% for Newby, Pow, and Blackwater soils, respectively. Increased frequency of estimated breakpoints at 7 to 15 d under climate change will likely increase SRP solubilization for the Newby and Pow soils (6 and 8% respectively) but decrease SRP solubilization in the Blackwater soil (-4%) (Table 1). Air-drying soil changes the sol-ubility of P and may not relect true solsol-ubility in the ield (Soinne et al., 2010), so translation of these laboratory results to the ield scale should be treated cautiously. However, the identiication of a breakpoint in SRP solubilization from soil is novel and impor-tant. he increased frequency of shorter dry days (11–15 d) may therefore be more important to consider as greater concentra-tions of SRP in leachate were found. Scalenghe et al. (2002) similarly found that under reducing conditions (albeit under looding), the maximum rate of solubilization occurred within 1 to 3 wk. It would be useful, therefore, to investigate this further with a greater variety of soils.
Conclusion
Under climate change projections, the duration and frequency of dry periods will increase compared with present-day condi-tions in three contrasting UK catchments. For three soils, we identiied critical breakpoints (6.9–14.5 d) of drying duration. Before the breakpoint, an increase in SRP loss with the number of dry days was observed; ater this point, the amount of SRP lost decreased or stayed fairly constant. he frequency of these break-points occurring under climate change was predicted to increase and therefore yield an increase in SRP solubilization in only two of the studied soils (Table 1). It is likely that longer periods of dry days followed by rapid rewetting events will not yield more SRP via solubilization than at the breakpoint. However, because the frequency of longer dry periods will increase under climate change, the solubilization of SRP from soil (-1 to 13%) will also change. herefore, we can accept our original hypothesis that changes in the future patterns of DRW afect the amount of SRP solubilized.
Supplemental Material
Supplemental material includes further detail of the results from the Weather Generator analysis and soil experiments and is available online.
Data
he data underlying the igures in this manuscript are openly available from Lancaster University data archive at http://dx.doi.org/10.17635/ lancaster/researchdata/170.
Acknowledgments
his work was funded by the Natural Environment Research Council (NERC) under the Changing Water Cycles Programme; projects NE/ K002392/1, NE/K002430/1, NE/K002406/1 (NUTCAT 2050) and supported by the Joint UK BEIS/Defra Met Oice Hadley Centre Climate Programme (GA01101).We acknowledge the Demonstration Test Catchment (DTC) project for assistance with collection of soils. he UK Climate Projections have been made available by the Department for Environment, Food and Rural Afairs (Defra) and the Department of Energy and Climate Change (DECC) under license from the Met Oice, UKCIP, British Atmospheric Data Centre, Newcastle University,
University of East Anglia, Environment Agency, Tyndall Centre, and Proudman Oceanographic Laboratory. hese organizations give no warranties, express or implied, as to the accuracy of the UKCP09 and do not accept any liability for loss or damage, which may arise from reliance on the UKCP09, and any use of the UKCP09 is undertaken entirely at the user’s risk.
References
Bartlett, R., and B. James. 1980. Studying dried, stored soil samples— some pitfalls. Soil Sci. Soc. Am. J. 44:721–724. doi:10.2136/ sssaj1980.03615995004400040011x
Blackwell, M.S.A., P.C. Brookes, N. de la Fuente-Martinez, P.J. Murray, K.E. Snars, J.K. Williams, et al. 2009. Efects of soil drying and rate of re-wetting on concentrations and forms of phosphorus in leachate. Biol. Fertil. Soils 45:635–643. doi:10.1007/s00374-009-0375-x
Blackwell, M.S.A., A.M. Carswell, and R. Bol. 2012. Variations in concentrations of N and P forms in leachates from dried soils rewetted at diferent rates. Biol. Fertil. Soils 49:79–87. doi:10.1007/s00374-012-0700-7
Bünemann, E.K., B. Keller, D. Hoop, K. Jud, P. Boivin, and E. Frossard. 2013. Increased availability of phosphorus ater drying and rewetting of a grassland soil: Processes and plant use. Plant Soil. doi:10.1007/ s11104-013-1651-y
Butterly, C.R., E.K. Bünemann, A.M. McNeill, J.A. Baldock, and P. Marschner. 2009. Carbon pulses but not phosphorus pulses are related to decreases in microbial biomass during repeated drying and rewetting of soils. Soil Biol. Biochem. 41:1406–1416. doi:10.1016/j.soilbio.2009.03.018
Butterly, C.R., A.M. McNeill, J.A. Baldock, and P. Marschner. 2011a. Changes in water content of two agricultural soils does not alter labile P and C pools. Plant Soil 348:185–201. doi:10.1007/s11104-011-0931-7
Butterly, C.R., A.M. McNeill, J.A. Baldock, and P. Marschner. 2011b. Rapid changes in carbon and phosphorus ater rewetting of dry soil. Biol. Fertil. Soils 47:41–50. doi:10.1007/s00374-010-0500-x
Chen, H., L. Lai, X. Zhao, G. Li, and Q. Lin. 2016. Soil microbial biomass car-bon and phosphorus as afected by frequent drying–rewetting. Soil Res. 54: 321–327. doi:10.1071/SR14299
Chepkwony, C.K., R.J. Haynes, R.S. Swit, and R. Harrison. 2001. Mineral-ization of soil organic P induced by drying and rewetting as a source of plant-available P in limed and unlimed samples of an acid soil. Plant Soil 234:83–90. doi:10.1023/A:1010541000437
Cranield University. 2017. he soils guide. Cranield University, Cranield, UK. Daly, K.R., S.J. Mooney, M.J. Bennett, N.M.J. Crout, T. Roose, and S.R. Tracy.
2015. Assessing the inluence of the rhizosphere on soil hydraulic proper-ties using x-ray computed tomography and numerical modelling. J. Exp. Bot. 66:2305–2314. doi:10.1093/jxb/eru509
Dinh, M.-V., A. Guhr, M. Spohn, and E. Matzner. 2017. Release of phosphorus from soil bacterial and fungal biomass following drying/rewetting. Soil Biol. Biochem. 110:1–7. doi:10.1016/j.soilbio.2017.02.014
European Commission. 2012. Report from the commission to the European Par-liament and the council on the implementation of the water framework directive (2000/60/ec) river basin management plans: UK. European Commission, Brussels, Belgium.
Fierer, N., J.P. Schimel, and P.A. Holden. 2002. Inluence of drying–rewetting frequency on soil bacterial community structure. Microb. Ecol. 45:63–71. doi:10.1007/s00248-002-1007-2
Grant, C.D., and A.R. Dexter. 1989. Generation of microcracks in molded soils by rapid wetting. Soil Res. 27:169–182. doi:10.1071/SR9890169 Haygarth, P.M., L.M. Condron, A.L. Heathwaite, B.L. Turner, and G.P.
Har-ris. 2005. he phosphorus transfer continuum: Linking source to impact with an interdisciplinary and multi-scaled approach. Sci. Total Environ. 344:5–14. doi:10.1016/j.scitotenv.2005.02.001
Haynes, R.J., and R.S. Swit. 1985. Efects of air-drying on the adsorp-tion and desorpadsorp-tion of phosphate and levels of extractable phos-phate in a group of acid soils, New Zealand. Geoderma 35:145–157. doi:10.1016/0016-7061(85)90027-8
IPCC. 2014. Climate change 2014: Synthesis report. Contribution of Working Groups I, II, and III to the Fith Assessment Report of the Intergovern-mental Panel on Climate Change. IPCC, Geneva.
IUSS Working Group WRB. 2015. World reference base for soil resources 2014, update 2015: International soil classiication system for naming soils and creating legends for soil maps. World Soil Resources Rep. 106. FAO, Rome.
1136 Journal of Environmental Quality
Joosse, P.J., and D.B. Baker. 2011. Context for re-evaluating agricultural source phosphorus loadings to the great lakes. Can. J. Soil Sci. 91:317–327. doi:10.4141/cjss10005
Kendon, E., N. Roberts, H. Fowler, M. Roberts, S. Chan, and C. Senior. 2014. Heavier summer downpours with climate change revealed by weather forecast resolution model. Nat. Clim. Chang. 4:570–576. doi:10.1038/ nclimate2258
Kleinman, P.J.A., A.N. Sharpley, P.J.A. Withers, L. Bergström, L.T. Johnson, and D.G. Doody. 2015. Implementing agricultural phosphorus sci-ence and management to combat eutrophication. Ambio 44:297–310. doi:10.1007/s13280-015-0631-2
Koestel, J., J. Moeys, and N. Jarvis. 2012. Meta-analysis of the efects of soil prop-erties, site factors and experimental conditions on solute transport. Hydrol. Earth Syst. Sci. 16:1647–1665. doi:10.5194/hess-16-1647-2012 McGonigle, D.F., S.P. Burke, A.L. Collins, R. Gartner, M.R. Hat, R.C. Harris,
et al. 2014. Developing demonstration test catchments as a platform for transdisciplinary land management research in England and Wales. En-viron. Sci. Process. Impacts 16:1618–1628. doi:10.1039/C3EM00658A Muggeo, V.M.R. 2003. Estimating regression models with unknown
break-points. Stat. Med. 22:3055–3071.
Muggeo, V.M.R. 2008. segmented: An R package to it regression models with broken-line relationships. R News 8(1):20–25. http://cran.r-project.org/ doc/Rnews/.
Murphy, J., and J.P. Riley. 1962. A modiied single solution method for the de-termination of phosphate in natural waters. Anal. Chim. Acta 27:31–36. doi:10.1016/S0003-2670(00)88444-5
Nguyen, T.B., and P. Marschner. 2005. Efect of drying and rewetting on phosphorus transformations in red brown soils with diferent soil or-ganic matter content. Soil Biol. Biochem. 37:1573–1576. doi:10.1016/j. soilbio.2005.01.015
NSRI. 2014. he soils guide. National Soil Resources Institute, Cranield Uni-versity, Cranield, UK.
Ockenden, M., C. Deasy, C. Benskin, K. Beven, S. Burke, A.L. Collins, et al. 2016. Changing climate and nutrient transfers: Evidence from high tempo-ral resolution concentration-low dynamics in headwater catchments. Sci. Total Environ. 548–549:325–339. doi:10.1016/j.scitotenv.2015.12.086 Olsen, S.R., and L.E. Sommers. 1982. Determination of available phosphorus.
In: A.L. Page, R.H. Miller, and D.R. Keeney, editors, Method of soil analy-sis. ASA, Madison, WI.
Outram, F.N., R.J. Cooper, G. Sünnenberg, K.M. Hiscock, and A.A. Lovett. 2016. Antecedent conditions, hydrological connectivity, and anthro-pogenic inputs: Factors afecting nitrate and phosphorus transfers to agricultural headwater streams. Sci. Total Environ. 545–546:184–199. doi:10.1016/j.scitotenv.2015.12.025
Outram, F.N., C.E.M. Lloyd, J. Jonczyk, M.C.H. Benskin, F. Grant, M.T. Perks, et al. 2014. High-frequency monitoring of nitrogen and phosphorus re-sponse in three rural catchments to the end of the 2011–2012 drought in England. Hydrol. Earth Syst. Sci. 18:3429–3448. doi:10.5194/ hess-18-3429-2014
Pailler, A., M. Vennetier, F. Torre, C. Ripert, and D. Guiral. 2014. Forest soil mi-crobial functional patterns and response to a drought and warming event: Key role of climate–plant–soil interactions at a regional scale. Soil Biol. Biochem. 70:1–4. doi:10.1016/j.soilbio.2013.12.003
Powers, S.M., T.W. Bruulsema, T.P. Burt, N.I. Chan, J.J. Elser, P.M. Haygarth, et al. 2016. Long-term accumulation and transport of anthropogenic phosphorus in three river basins. Nat. Geosci. 9:353–356. doi:10.1038/ ngeo2693
Rowell, D.L. 1994. Soil science: Methods and applications. Prentice Hall, Pear-son Education, Harlow, UK.
Rowland, A.P., and H.M. Grimshaw. 1985. A wet oxidation procedure suitable for total nitrogen and phosphorus in soil. Commun. Soil Sci. Plant Anal. 16:551–560. doi:10.1080/00103628509367628
Scalenghe, R., A.C. Edwards, F. Ajmone Marsan, and E. Barberis. 2002. he efect of reducing conditions on the solubility of phosphorus in a di-verse range of European agricultural soils. Eur. J. Soil Sci. 53:439–447. doi:10.1046/j.1365-2389.2002.00462.x
Schlichting, A., and P. Leinweber. 2002. Efects of pretreatment on sequentially-extracted phosphorus fractions from peat soils. Commun. Soil Sci. Plant Anal. 33:1617–1627. doi:10.1081/CSS-120004303
Sharpley, A., H.P. Jarvie, A. Buda, L. May, B. Spears, and P. Kleinman. 2013. Phosphorus legacy: Overcoming the efects of past management practices to mitigate future water quality impairment. J. Environ. Qual. 42:1308– 1326. doi:10.2134/jeq2013.03.0098
Snell, M.A., P.A. Barker, B.W.J. Surridge, A.R.G. Large, J. Jonczyk, M.C.H. Benskin, et al. 2014. High frequency variability of environmental drivers determining benthic community dynamics in headwater streams. Env. Sci. Process. Impact. 16:1629–1636. doi:10.1039/c3em00680h
Soinne, H., M. Räty, and H. Hartikainen. 2010. Efect of air-drying on phospho-rus fractions in clay soil. J. Plant Nutr. Soil Sci. 173:332–336. doi:10.1002/ jpln.200900225
Styles, D., and C. Coxon. 2006. Laboratory drying of organic-matter rich soils: Phosphorus solubility efects, inluence of soil characteristics, and con-sequences for environmental interpretation. Geoderma 136:120–135. doi:10.1016/j.geoderma.2006.03.017
Styles, D., and C. Coxon. 2007. Meteorological and management inluences on seasonal variation in phosphorus fractions extracted from soils in western Ireland. Geoderma 142:152–164. doi:10.1016/j.geoderma.2007.08.008 Turner, B.L., and P.M. Haygarth. 2001. Biogeochemistry: Phosphorus
solubiliza-tion in rewetted soils. Nature 411. doi:10.1038/35077146
UKCP. 2009. Weather generator. http://ukclimateprojections.Metoice.Gov. Uk/23261
Wade, A.J., E.J. Palmer-Felgate, S.J. Halliday, R.A. Skeington, M. Loewenthal, H.P. Jarvie, et al. 2012. Hydrochemical processes in lowland rivers: In-sights from in situ, high-resolution monitoring. Hydrol. Earth Syst. Sci. 16:4323–4342. doi:10.5194/hess-16-4323-2012
Wang, Y., Y. Hao, X. Cui, H. Zhao, C. Xu, X. Zhou, et al. 2013. Responses of soil respiration and its components to drought stress. J. Soils Sediments 14:99–109. doi:10.1007/s11368-013-0799-7