5 1113 - 1126
International Journal of
ELECTROCHEMICAL
SCIENCE
www.electrochemsci.org
Investigation of SnO
2-modified LiMn
2O
4Composite as Cathode
Material for Lithium-ion Batteries
Li Wang, Jishi Zhao, Shaohua Guo, Xiangming He*, Changyin Jiang, Chunrong Wan
Institute of Nuclear & New Energy Technology, Tsinghua University, Beijing 100084, PR China
*E-mail: [email protected]
Received: 22 June 2010 / Accepted: 15 July 2010 / Published: 10 August 2010
SnO2-modified LiMn2O4 cathode materials are prepared based on controlled crystallization and solid
state reaction. SEM analysis shows that SnO2-modified samples have the same spherical shape as
unmodified ones. Powder X-ray diffraction (XRD) analysis reflects that obtained peaks correspond well with characteristic of spinel structural LiMnO4 samples in the range of 5o and 90o. Based on XRD
and ICP-AES analysis it may safely be concluded that some SnO2 particles have been introduced
(doped) into the crystal matrix of LiMn2O4, while other SnO2 particles agglomerate on the surface of
LiMn2O4 which is evidenced by EDXS analysis. EDXS analysis reveals that some SnO2 particles are
coated on the surface of the LiMn2O4 during the preparation processes. Furthermore, the influence of
the SnO2 on the electrochemical performance of LiMn2O4 is characterized by electrochemical
impedance spectroscopy (EIS) and cyclic voltammetry (CV). In comparison to unmodified samples, SnO2-modified samples exhibited better cycling performance from 76.3 mAh g-1 to 99.6 mAh g-1 and
higher capacity retention from 67.8% to 95.1% at 55oC after 50 cycles.
Keywords: Spherical LiMn2O4; SnO2; Electrochemical impedance spectroscopy (EIS); Lithium ion
batteries
1. INTRODUCTION
Although widely used in the field of various portable electric devices as a power supply, lithium ion batteries have still attracted much attention in attempts to ameliorate the performance of their inside components. Owing to such advantages as low cost, low toxicity and high safety, spinel LiMn2O4 can be used as cathode material of lithium ion batteries in place of LiCoO2. Many researches
on Li-Mn-O compounds have been reported in recent years [1-7]. However, LiMn2O4 suffers from a
application. It is postulated that this problem is induced by the dissolution of LiMn2O4 electrode into
electrolyte (as Mn2+) and a phase transition due to Jahn-Teller distortion [8].
Doping and coating have been widely applied to improve the electrochemical performance of LiMn2O4. Above all, doping can alleviate Jahn-Teller effect, resulting in stabilized spinel structure of
LiMn2O4.Furthermore; doping can decrease the dissolution of Mn2+ (according to equation (1)) due to
the fact that dopant ions might take the place of Mn3+ in LiMn
2O4. Such metals as Al, Mg, Zn and Ni
[3-5, 9-10] have been adopted as dopants to enhance the performance of the spinel LiMn2O4. Some
researchers have found that the coated spinel LiMn2O4 shows not only a good rate capability, but also
an improved tolerance to overcharging and elevating temperature performance due to the increased conductivity [11-13].
3+ 4+ 2+
solid solid solution
2Mn →Mn +Mn (1)
However, He et al. [14] found that doping of yttrium could enhance the activity of manganese in spinel LiMn2O4, which cause the active manganese to dissolve into electrolyte easily during cycling.
In this work, SnO2-modified LiMn2O4 samples were prepared by solid phase synthesis at high
temperature. During the preparation processes, the doping of SnO2 maybe occurred in the surface layer
of pristine LiMn2O4, and some SnO2 powders are coated on the surface of LiMn2O4 simultaneously.
Mn4+ ions were partially replaced by Sn4+ after doping in an attempt to increase the concentration of Mn3+ on the surface, and at the same time, induce more Mn2+ dissolution into electrolyte. In present work, X-ray diffraction (XRD), scanning electron microscopy (SEM), energy dispersive X-ray spectroscopy (EDXS), electrochemical impedance spectroscopy (EIS) and cyclic voltammetry (CV) were applied to investigate the physical characteristics and electrochemical properties of the SnO2
-modified LiMn2O4 samples.
2. EXPERIMENTAL
2.1. Preparation and characterization of Sn-doped LiMn2O4 powders
Firstly, spherical MnCO3 powders were synthesized by controlled crystallization method
[15-16] via a chemical reaction as follows:
4 4 3 3 4 2 4 2 3
MnSO +2NH HCO →MnCO ↓+ (NH ) SO + H CO (2)
Here, MnSO4, NH4HCO3, and NH3•H2O solutions were fed continuously into a crystallization
reactor with agitation. All particles formed in the reactor gradually with a spherical shape after a definite reaction time. The spherical Mn2O3 was then obtained by heat-treatment of MnCO3 at 560oC
for 4h. A mixture of Mn2O3, Li2CO3 and SnO2 was calcined at 750oC for 20h to produce the
respectively. In this paper, we describe these samples as pristine LMO, Sn (1%)/LMO, Sn (2%)/LMO, Sn (5%)/LMO and Sn (10%)/LMO, respectively.
The crystal structure of the samples was characterized by X-ray diffraction (XRD, Rigaku, D/max-rB) using a diffractometer with Cu Kα radiation. Morphologies and energy dispersion X-ray
spectroscopy (EDXS, point scanning mode) of the synthesized samples were observed with scanning electron microscopy (SEM, JSM-6301, Hitachi, Ltd.). After every sample immerged in the electrolyte at room temperature for 72h, the dissolved manganese was detected by inductively coupled plasma-atomic emission spectrum (ICP-AES, Thermo-Jarrell-Ash IRIS).
2.2. Electrochemistry measurements
The as-prepared composite was mixed with acetylene black and PTFEin weight ratio of 8:1:1 to form slurry. After solvent evaporation, the electrodewas prepared and dried at 120oC under vacuum over 24h. CR2025-type coin cells were assembled in a glove box (M. Braun GmbH, Germany) with H2O and O2 content below 2ppm. Metallic lithium foil was used as counter electrode. The electrolyte
was 1M LiPF6 dissolved in EC + DEC (1:1, v/v) and Celgard 2400 polyethylene membrane was used
as separator.
Electrochemical impedance spectroscopy (EIS) and cyclic voltammetry (CV) analysis were carried out using ZAHNER-IM6eX electrochemical workstation. EIS measurements were performed with 10 mV perturbation amplitude in the range from 100 kHz to 5 mHz in automatic sweep mode from high to low frequency. The impedance spectra were recorded at each state allowing at least 5 additional hours for equilibration after each charge step. The counter electrode was lithium foil about 1.0 cm2 and the electrochemical measurements were performed with a two-electrode system. Data
acquisition and analysis were made using the electrochemical impedance software. CV was carried out within a voltage range of 2.5V ~ 4.5V at the scan rate of 0.2mV s-1. All the electrochemical measurements mentioned above were conducted at room temperature. The research on cycling performance was conducted between 4.35 V and 3.35 V with a current density of 0.5mA/cm2 at room
temperature and 55oC.
3. RESULTS AND DISCUSSION 3.1. Physical characteristics
3.1.1. XRD results
Fig.1 shows the XRD patterns of the composite powders with different content of SnO2
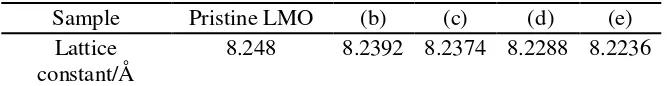
addition. The diffraction peaks marked as (111), (311), (400), (511) and (440) in the spectra correspond well with the standard data of JCPDS 35-0782 card, indicating the existence of the well-crystallized spinel cubic LiMn2O4 phase in all samples. Table 1 show that the lattice constants decrease
changes in the lattice constants reveals that some Sn4+ ions have been introduced into the crystal lattice
of pristine LiMn2O4 in place of Mn4+ ions. Obviously, not all SnO2 entered into the crystal lattice
because changes in the lattice constants (decreasing from 8.248 to 8.2236 Å) are not comparable with SnO2 content (increasing from 0 to 10%).
(a) Pristine LMO
0 20 40 60 80
2 Theta / deg.
(111)
(311) (400)
(511)(440)
(211)
(c) Sn (2%)/LMO (110) (101) (211)
(d) Sn (5%)/LMO (e) Sn (10%)/LMO
(110)
(101) (211)
[image:4.612.200.413.158.371.2](b) Sn (1%)/LMO
Figure 1. XRD patterns of (a): Pristine LMO, (b): Sn (1%)/LMO, (c): Sn (2%)/LMO, (d): Sn
(5%)/LMO and (e): Sn (10%)/LMO
Furthermore, the diffraction peaks corresponding to SnO2 marked as (110), (101) and (211)
have been clearly observed in the patterns of sample (d) and (e) as well as a weak diffraction peak of SnO2 (211) in the pattern of sample (c), indicating the existence of pristine SnO2 particles in the
[image:4.612.140.476.544.587.2]composite.
Table 1. The lattice constants of different samples
Sample Pristine LMO (b) (c) (d) (e)
Lattice
constant/Å 8.248 8.2392 8.2374 8.2288 8.2236
3.1.2. SEM results
Fig. 2 shows SEM photos of the samples. It is definitely showed that all the samples are spherical with diameters less than 40 µm in Fig. 2. EDXS analysis shows the atomic percentage of the
(a)-1 (a)-2
(b) (c)
[image:5.612.123.490.87.551.2]
(d) (e)
Figure 2. SEM of (a)-1 and (a)-2: Pristine LiMn2O4; (b): Sn (1%)/LMO, (c): Sn (2%)/LMO, (d): Sn
(5%)/LMO and (e): Sn (10%)/LMO[41]
3.1.3. ICP-AES results
The ICP-AES results are presented in Table 3. As can be seen, the dissolution percentage of Mn of pristine LMO is the smallest, revealing that the addition of SnO2 enhances the dissolution of
Table 2. Sn content on the surface of the spherical composites
samples Sn
(1%)/LMO
Sn (2%)/LMO
Sn (5%)/LMO
Sn (10%)/LMO
Sn percentage (wt. %) 1.98 4.04 8.5 17.71
Prospective
percentage (wt. %) 1 2 5 10
Relative ratio 1.98 2.02 1.7 1.771
It is well known that Mn2+ is relatively easy to dissolve into the electrolyte. It can be inferred
that some Mn4+ ions have been partially replaced by Sn4+ and consequently increased the ratio of Mn3+/Mn4+ by addition of SnO2. According to the ionic dissolution equilibrium, as shown in equation
(1), more Mn2+ ions can readily be dissolved into electrolyte after the dissolution of Mn3+ ions.
Moreover, the dissolution percentage of Mn decreased with the increase of SnO2 content (from 1% to
10%), revealing that the doping of Sn4+ does not increase with the increase of SnO2 content in the
[image:6.612.92.517.364.434.2]modified samples.
Table 3. the dissolution percentage of Mn
samples Pristine LMO
Sn (1%)/LMO
Sn (2%)/LMO
Sn (5%)/LMO
Sn (10%)/LMO Dissolution
percentage/‰ 0.65 2.45 1.97 1.14 0.97
3.2. Electrochemical results 3.2.1. Cyclic voltammograms
Fig. 3 shows the CV plots of the first and the tenth cycle (scan rate: 0.2mV s-1) obtained at
room temperature. Both XRD and ICP-AES results have shown that some superfluous SnO2 is coated
on the surface of LiMn2O4, or exists in the composite as unexpected impurities during the preparation
processes. As a result of the unexpected impurities, both C and E are different from the others, especially the 1st CV. There are no obvious differences in the tenth CV (dash dot line) from A to E, demonstrating that the influence of the surface layer doping and the impurities disappears after several cycles, and the SnO2 coating on the surface prevents the Mn dissolution into electrolyte furthermore
after several cycles. The integrated curves are used to calculate the quasi-thermodynamic x versus E
curves in order to assign a value of the intercalation degree (x) to each potential. Nobili et al. [17]
considered that the calculated x values probably contain some errors and should be taken with some
3.00 3.25 3.50 3.75 4.00 4.25 4.50 -40 -20 0 20 40 I / 1 0 -6 A
E / V vs Li
1st cycle ... 10th cycle A
3.00 3.25 3.50 3.75 4.00 4.25 4.50 -20 -10 0 10 20 30 40 I / 1 0 -6 A
E / V vs Li
1st cycle ...10th cycle
B
3.00 3.25 3.50 3.75 4.00 4.25 4.50 -20 -10 0 10 20 30 40 50 I / 1 0 -6 A
E / V vs Li 1st cycle ... 10th cycle
C
3.00 3.25 3.50 3.75 4.00 4.25 4.50 -20 -10 0 10 20 I / 1 0 -6 A
E / V vs Li
1st cycle ...10th cycle
D
3.00 3.25 3.50 3.75 4.00 4.25 4.50 -20 0 20 40 60 80 I / 1 0 -6A
E / V vs Li 1st cycle ... 10th cycle
[image:7.612.125.487.81.477.2]E
Figure 3. Cyclic votammograms of electrodes at 25oC (A: Pristine LMO, B: Sn (1%)/LMO, C: Sn
(2%)/LMO, D: Sn (5%)/LMO and E: Sn (10%)/LMO, Scan rate: 0.2mV s-1)[41]
Moreover, the cation doping shows favorable influences on the electrochemical performance [18]: (1) the valence of Mn will be increased by doping, it is helpful to suppress Jahn-Teller effect; (2)the spinel frame of LiMn2O4 will be stabilized, it is helpful for lowering structural change during
charge/discharge process and inhibiting the solution reaction of Mn; (3) the improvement of the conductivity is propitious to the reversible lithium intercalation and deintercalation and (4) the surface area will be decreased, resulting in the decrease of contacting area between active cathode materials and electrolyte.
The CV curves of all samples at the 10th cycle are quite similar, revealing the electrochemical
stability of modified LiMn2O4. Anyway, the addition of SnO2 exhibits significant influence on the
3.2.2. Electrochemical impedance spectra
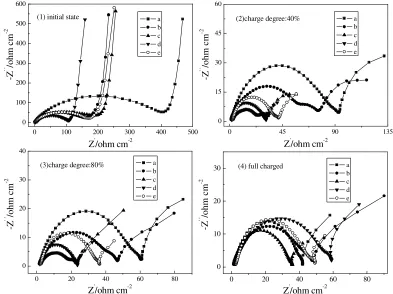
EIS is one of the most powerful tools to analyze electrochemical reactions, such as those processes occurring at electrode/electrolyte interfaces and the lithium ion intercalation/deintercalation occurring in anode/cathode, and has been widely reported in the previous literature [17, 19-26]. The Nyquist plots of electrochemical lithium ion deintercalation from oxide-based electrodes (corresponding to the charge processes) commonly consist of three parts: the first arc in the high frequency range, the second arc in the medium frequency range and an approximate straight line inclined at a constant angle to the real axis in the lower frequency range. Though the dependence of Nyquist plots for impedance spectra on state of charge (SOC) does not come to an agreement among researchers, it is acknowledged that every part of the plots can indicate some electrochemical characterizations of electrode materials [27-31, 42]. In this study, EIS is employed to investigate the influence of SnO2 on the electrochemical performance of LiMn2O4, especially the resistance of solid
electrolyte interface (SEI) film (Rsf), charge transfer resistance (Rct) and the resistance between SEI
film and cathode (Rin).
0 100 200 300 400 500
0 100 200 300 400 500 600 -Z
' ' /o
hm
c
m
-2
Z'/ohm cm-2
a b c d e
(1) initial state
0 45 90 135
0 15 30 45 60 -Z
' ' /o
hm
c
m
-2
Z'/ohm cm-2
a b c d e (2)charge degree:40%
0 20 40 60 80
0 10 20 30 40 -Z
' ' /o
hm
c
m
-2
Z'/ohm cm-2
a b c d e (3)charge degree:80%
0 20 40 60 80 0
10 20 30
-Z
' ' /o
hm
c
m
-2
Z'/ohm cm-2
a b c d e
[image:8.612.108.501.325.619.2](4) full charged
Figure 4. Series of Nyquist plots obtained at different state of charge at the rate of 0.1C (a: Pristine
LMO, b: Sn (1%)/LMO, c: Sn (2%)/LMO, d: Sn (5%)/LMO and e: Sn (10%)/LMO)
et al. considered that the depressed arc belong to insertion compound [32]. It is shown that the EIS analysis of a pressed porous powder insertion compound electrode in contact with liquid electrolyte can be modeled by a modified Randles equivalent circuit using a resistor/capacitor (R/C) combination. In fact, the presence of an additional dipole may account for at least two physical processes [33-36]: one is an adsorption process of Li+ ions or other species onto the surface of the electrode without
[image:9.612.201.410.268.334.2]charge transfer; the other is the formation of a surface layer on the electrode. According to not well defined semicircle (see inset in Fig. 4) presented at the high frequency limit, it can be speculated that the latter case occurring in this work, so the surface of electrode is probably covered by an ionically conductive but electrically insulating surface layer. The lithium ion diffusion region at the lower frequencies is generally assigned to solid state diffusion of lithium ion into the bulk cathode material [30].
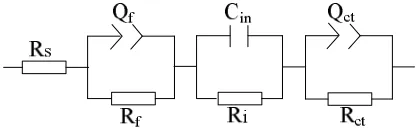
Figure 5. Equivalent circuit describing the impedance responses shown in Fig. 4
Generally, the overall impedance decreases with the decrease of the charge degree, and the semicircles in the high and middle frequency range are more defined at middle charged state, such as at 40% SOC. There are two distinct semicircles in the plots from (2) to (4), which is different from the plots (1). And the size of all the semicircles is strongly depended on the SOC. In order to investigate the Nyquist plots in detail, it is necessary to build an equivalent circuit to fit into the impedance spectra shown in Fig. 4. Such equivalent circuit has been shown in Fig. 5. In the equivalent circuit, Rs
represents the ohmic resistance of the electrolyte; Rsf and Rin are resistances of SEI film and the
interface between SEI film and cathode, respectively; Rct is the resistance of the lithium ion
transference in cathode. Cin represents the capacitance of the double layer; the capacitance of the SEI
film and lithium ion diffusion impedance are represented by constant phase elements (CPE) Qf and Qct,
respectively. The expression for the CPE (Q) is
0 cos 0 sin
2 2
n n n n
Y =Yω π + jYω π
(3)
Where,ωis the angular frequency, j is the imaginary unit. A CPE represents a resistor when
n=0, a capacitor with capacitance of C when n=1 and an inductor when n=-1. By the way, CPE
represents a Warburg resistance when n=0.5 if Warburg resistance exists in impedance spectra.
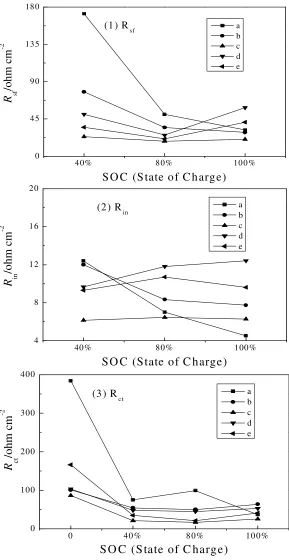
6(1) and Fig. 6(2). Moreover, both resistances of the sample are smaller than those of other remaining samples. During the charge process the stability of Rsf and Rin is probably attributed to the surface
coating of SnO2. Fig. 6(3) shows that Rct decreases with the increase of charge degree (from 0% to
100% SOC). Rct is supposed to represent the lithium ion diffusion in the cathode. The value of Rct is
expected to decrease during the charge process because the ionic conductivity of cathode materials will increase with the deintercalation of lithium ion from host. Obviously, the addition of SnO2 has a
beneficial (positive) effect on the ionic conductivity of LiMn2O4 due to the fact that t Rct is evidently
decreased after the modification, as shown in Fig. 6(3). Furthermore, it is well noted that the sample of Sn (2%)/LMO shows the smallest Rct among all the samples. Li et al. [37] have studied the influence of
Sn doping on the diffusion coefficient of Lithium ion in electrode materials. It can be considered that the doping of Sn can not only stabilize the crystal structure, but also enhance the ionic conductivity of electrode materials. In this study, it has been demonstrated that the addition of SnO2 reduces the
impedance of Rsf, Rin and Rct during the first cycle, which is conductive, favorable for the improvement
of the cycling performance of LiMn2O4 cathode.
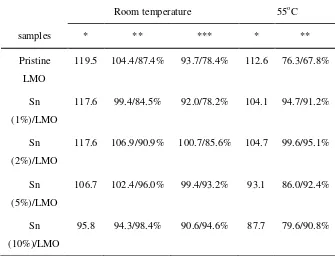
[image:10.612.137.472.388.646.2]3.2.3. Cycling performance test
Table 4. Cycling performance of Li/composites cathode conducted between 4.35 V and 3.35 V with a
current density of 0.5mA/cm2 at room temperature and 55oC (mAh g-1)
Room temperature 55oC
samples * ** *** * **
Pristine LMO
119.5 104.4/87.4% 93.7/78.4% 112.6 76.3/67.8%
Sn (1%)/LMO
117.6 99.4/84.5% 92.0/78.2% 104.1 94.7/91.2%
Sn (2%)/LMO
117.6 106.9/90.9% 100.7/85.6% 104.7 99.6/95.1%
Sn (5%)/LMO
106.7 102.4/96.0% 99.4/93.2% 93.1 86.0/92.4%
Sn (10%)/LMO
95.8 94.3/98.4% 90.6/94.6% 87.7 79.6/90.8%
Note: *---Initial capacity;
40% 80% 100% 0
45 90 135 180
R sf
/o
hm
c
m
-2
SO C (State of C harge)
a b c d e (1) Rsf
40% 80% 100%
4 8 12 16 20
R in
/o
hm
c
m
-2
SO C (State of C harge)
a b c d e (2) Rin
0 40% 80% 100%
0 100 200 300 400
R ct
/o
hm
c
m
-2
SO C (State of C harge)
a b c d e
[image:11.612.161.450.63.623.2](3) Rct
Figure 6. Results of the Nyquist plots shown in Fig. 4 (a: Pristine LMO, b: Sn (1%)/LMO, c: Sn
(2%)/LMO, d: Sn (5%)/LMO and e: Sn (10%)/LMO)
Table 4 shows the cycling performance of Lithium metal-pristine LMO (or SnO2-modified
temperature and 55oC. The initial capacity decreased with increase of the content of SnO
2 (wt. %) from
0 to 10% at room temperature and 55oC resulting from the surface layer doping of Sn4+. The capacity
retention at room temperature shows the same tendency, reflecting that the addition of SnO2 improves
the cycleability because of the moderate SnO2 coatings on the surface of LiMn2O4. The capacity fading
at higher temperatures (>50oC) is too high for practical applications [38-40] because the dissolution of
LiMn2O4 electrode into the electrolyte (as Mn2+) increases with the increase of temperature. In this
work, the Sn (2%)/LMO composite displays the best cycling performance at 55oC, the capacity and the
capacity retention increase from 76.3 mAh g-1 and 67.8% to 99.6 mAh g-1 and 95.1% respectively;
because of doping of Sn4+ in surface layer and moderate coating of SnO
2 on the surface occurring in
the preparation processes. Based on the improvements as discussed above, it can be speculated that the dissolution of LiMn2O4 electrode into the electrolyte (as Mn2+) decreases during the initial cycle owing
to the doping of SnO2 particles into the pristine LiMn2O4. And the capacity maintenance ability of
composite cathode has been enhanced as a result of the SnO2 coatings on the surface of LiMn2O4.
Obviously, it does not mean that more content of favorable dopant will achieve better electrochemical performance. If the content of dopant is too much, unexpected impurities and deterioration of electrochemical performances will be ensued. In other words, there is usually a trade-off between cycle life and capacity in the case of the favorable dopant. In this work, the composite with 2% SnO2 used as
additive showed the best electrochemical performance.
4. CONCLUSION
The spherical SnO2-modified LiMn2O4 is prepared based on controlled crystallization and solid
state reaction in this study. SEM and XRD analysis show that the morphology and diffraction spectra of LiMn2O4 does not change obviously with the addition of SnO2, revealing that the modification by
SnO2 does not destroy the crystal structure of pristine LiMn2O4. Some obvious impurities are observed
in the samples with large content (wt. %) of SnO2, indicating that some SnO2 particles are coated on
the surface of LiMn2O4 particles though some other SnO2 have been introduced into the spinel
structure. The ICP-AES results show that some Sn4+ ions have been doped into the surface layer of
LiMn2O4 in place of Mn4+.
There are no obvious differences observed in CV results between the first cycle and the tenth cycle, reflecting that the addition of SnO2 does not destroy the electrochemical stability of LiMn2O4.
EIS analysis shows that both Rsf (the resistance of solid electrolyte interface (SEI)) and Rin (the
resistance between SEI film and cathode) are decreased and well stabilized as a result of the modification by SnO2. Furthermore, the charge transfer resistance (Rct) decreases with the increase of
charge degree (SOC). In both cases, the SnO2 coating and Sn4+ doping have a definite influence on the
electrochemical performance, resulting in the decrease of impedance. Among all the samples, Sn (2%)/LMO composite display the smallest impedance.
The cycling performance shows that the addition of SnO2 improves the ionic conductivity and
the cycleability (the capacity and the capacity retention increase from 76.3 mAh g-1 and 67.8% to 99.6
of Sn4+. The Sn (2%)/LMO composite displays the best electrochemical performance at different
temperature and the best cycling performance at 55oC because of the moderate coating of SnO 2.
ACKNOWLEDGEMENT
The authors thank National Science Foundation of China (No. 20901046) and LG Chem for funding this work. The authors highly appreciate the revision comments from the anonymous reviewers; we also appreciate the help for the English improvements from Dr. Wang Zhi-chao.
References
1. Y. Gao, J.R. Dahn. J. Electrochem. Soc. 143 (1996) 100.
2. A. Ogata, T. Shimizu, S. Komaba. J. Power Sources 174 (2007) 756.
3. X.M He, L. Wang W.H. Pu, G.Y. Zhang, C.Y. Jiang, C.R. Wan, Int. J. Electrochem. Sci.
1(2006)12.
4. X.M. He, J.J. Li, Y. Cai, Y.W. Wang, J.R. Ying, C.Y. Jiang, C.R. Wan, J. Solid State Electrochem.
9(2005)438.
5. Y. Cai,Y.W. Wang, X.M. He, C.Y. Jiang, C.R. Wan, J. Inorg. Mat. 19(2004)1058.
6. X.M. He, J.J. Li, Y. Cai, C.Y. Jiang, C.R. Wan, Mat. Chem. Phys. 95(2006)105.
7. X.M. He, J.J. Li, Y. Cai, Y.W. Wang, J.R. Ying, C.Y. Jiang, C.R. Wan, Solid State Ionics,
176(2005) 2571.
8. T. Aoshima, K. Okahara, C. Kiyohara, K. Shizuka. J. Power Sources 97-98 (2001) 377.
9. S. W. Lee, K. S. Kim, H. S. Moon, H. J. Kim, B. W. Cho, W. I. Cho, J. B. Ju, J. W. Park. J. Power Sources 126 (2004)150.
10.Y. K. Sun, K.J. Hong, J. Prakash. J. Electrochem. Soc.150 (2003) A970.
11.S. C. Park, Y. M. Kim, Y. M. Kang, K. T. Kim, P. S. Lee, J. Y. Lee. J. Power Sources 103 (2001)
86.
12.Y. K. Sun, K. J. Hong, J. Prakash, K. Amine. Electrochemistry Communications 4 (2002) 344.
13.L. J. Fu, H. Liu, C. Li, Y. P. Wu, E. Rahm, R. Holze, H. Q. Wu. Prog. Mater. Sci. 50 (2005) 881.
14.X. M. He, J. J. Li, Y. Cai, Y. W. Wang, J. R. Ying, C. Y. Jiang, C. R. Wan. J. Power Sources 150
(2005) 216.
15.X. Wu, S. B. Kim. J. Power Sources 109 (2002) 53.
16.D. Aurbach, M. D. Levi, E. Levi, H. Teller, B. Markovsky, G. Salitra, U. Heider, L. Heider. J. Electrochem. Soc. 145 (1998) 3024.
17.F. Nobili, S. Dsoke, F. Croce, R. Marassi. Electrochim. Acta 50 (2005) 2307.
18.Y. P. Wu, E. Rahm, R. Holze. Electrochim. Acta 47 (2002) 3491.
19.C. S. Wang, A. J. Appleby, F. E. Little. Electrochim. Acta 46 (2001) 1793.
20.A. Funabiki, M. Inaba, Z. Ogumi. J. Power Sources 68 (1997) 227.
21.K. N. Jung, S. I. Pyun, J. W. Lee. Electrochim. Acta 49 (2004) 4371.
22.H. Li, X. J. Huang, L.Q. Chen. J. Power Sources 81-82 (1999) 340.
23.C. L. Li, Z. W. Fu. J. Electrochem. Soc. 154 (2007) A784.
24.S. Q. Liu, S. C. Li, K. L. Huang, B. L. Gong, G. Zhang. J. Alloys and Compounds, In Press.
25.Y. C. Chang, H. J. Sohn. J. Electrochem. Soc. 147 (2000) 50.
26.M. Itagaki, N. Kobari, S. Yotsuda, K. Watanabe, S. Kinoshita, M. Ue. J. Power Sources 135
(2004) 255.
27.Z. H. Yang, S. B. Sang, Y. Feng, Y. H. Zhou, K. L. Huang, H. Q. Wu. Diamond Relat. Mat. 14
(2005) 1302.
28.S. Zhang, P. F. Shi. Electrochim. Acta 49 (2004) 1475.
30.K. N. Jung, S. I. Pyun. Electrochim. Acta 52 (2007) 5453.
31.M. Quintin, O. Devos, M. H. Delville, G. Campet. Electrochim. Acta 51 (2006) 6426.
32.M. G. S. R. Thomas, P. G. Bruce, J. B. Goodenough. J. Electrochem. Soc. 132 (1985) 1521.
33.J. E. Bauerle. J. Phys. Chem. Solids 30 (1969) 2657.
34.P. R. Sorensen, T. Jacobsen. Electrochim. Acta 27 (1982) 1671.
35.C. A. C. Sequeira, A. Hooper. Solid State Ionics 9-10 (1983) 1131.
36.D. Fauteux. Solid State Ionics 17 (1985) 133.
37.J. G. Li, X. M. He, R. S. Zhao, C. R. Wan, C. Y. Jiang, D. G. Xia, S. C. Zhang. J. Power Sources
158 (2005) 524.
38.G. G. Amatucci, N. Pereira, T. Zheng, J.M. Tarascon. J. Electrochem. Soc. 148 (2001) A171.
39.B. Deng, H. Nakamura, M. Yoshio. Chem. Lett. 32 (2003) 942.
40.T. Horiba, K. Hironaka, T. Matsumura, T. Kai, M. Koseki, Y. Muranaka. J. Power Sources
119-121 (2003) 893.
41.S.H. Guo, S.C. Zhang, X. M. He, W.H. Pu, C.Y. Jiang, C.R. Wan. J. Electrochem. Soc. 155 (2008)
A760.
42. J.S. Zhao, L. Wang, X.M. He, C.R. Wan, C.Y. Jiang, Int. J. Electrochem. Sci. 5(2010) 478.
![Figure 2. SEM of (a)-1 and (a)-2: Pristine LiMn2O4; (b): Sn (1%)/LMO, (c): Sn (2%)/LMO, (d): Sn (5%)/LMO and (e): Sn (10%)/LMO[41]](https://thumb-us.123doks.com/thumbv2/123dok_us/1942726.154330/5.612.123.490.87.551/figure-sem-pristine-limn-lmo-lmo-lmo-lmo.webp)

![Figure 3. Cyclic votammograms of electrodes at 25oC (A: Pristine LMO, B: Sn (1%)/LMO, C: Sn (2%)/LMO, D: Sn (5%)/LMO and E: Sn (10%)/LMO, Scan rate: 0.2mV s-1)[41]](https://thumb-us.123doks.com/thumbv2/123dok_us/1942726.154330/7.612.125.487.81.477/figure-cyclic-votammograms-electrodes-pristine-lmo-scan-rate.webp)