European Countries
Bôata
European Commission
Directorate General for Agriculture (DGVI) Working Document
Agricultural Situation and Prospects
in the Central and Eastern European Countries
LATVIA
This Document has been prepared by DG VI in close collaboration with Mr. Andris Miglavs, of the Latvian State Institute of Agrarian Economics and with the assistance of Dr. Christian Dose, ASA Institute for Agricultural Sector Analysis, Bonn.
The manuscript has been prepared by Martin Strittmatter, with the assistance of Steve Darling. The authors accept full responsibility for any errors, which could still remain in the text
TABLE OF CONTENTS
Page
Foreword
0
Executive Summary
1
General Overview
1.1 Climate and geography · 1
1.2 Population 1
1.3 Education 2
1.4 Infrastructure 2
1.5 Political situation 3
1.6 Economic situation 4
Occupational Activities Industrial Production Trade
Currency and Monetary Questions Wages and Prices
! 2
Agricultural Economy
2.1 Importance in the economy
2.2 Land use 7
2.3 Food consumption
2.4 Structure and privatization 8
2.5 Jlrable crops 11
2.5.1 Cereals
2.5.2 Fodder Crops 13
2.5.3 Potatoes 14
2.5.4 Sugar beet 15
2.5.5 Fresh Vegetables 16
2.5. 7 Permanent crops 16
2.6 Livestock 17
2.6.1 Milk and Dairy Products
2.6.2 Beef Meat 19
2.6.3""Pork 20
2.6.4 Poultry and other Meat 21
2. 7 Forestry 21
3
Upstream and downstream Industry
3.1 Upstream industry 3.2 Downstream industry
4
Agricultural Policy
4.1 Price policy, 4.2 Border protection 4.3 Direct payments 4.4 Farm credits 4.5 Taxes
5
Agricultural Trade
5.1 General situation
-Main Trading Partners - Main Export Commodities - Main Import Commodities 5.2 Free Trade Agreement with the EU
6
Perspectives, Evolution, Conflicts and Problems
23 25
26
27
27
28
28
28
32
6.1 The development of the macro- economic situation 33
6.2 General perspective for Latvian agriculture 34
6.3 Impact of agricultural policy measures 36
6.4 Possible developments for the main commodities 36
until the year 2000
Bibliography 40
Annexes
Annex 1 Price comparison between the Baltic States 42
Annex 2 Production and supply balance for most important commodities
Annex 3 Production costs 51
Annex 4 Europe Agreement 53
list
of Tables fJageTable 0.1 Projections for main Commodities
XI
Table 1 Latvia in Comparison with other CEECs and the EU
XII
Table 1.1 Macro Economic Indicators for Latvia 3a
Table 1.2 Main Trading Partners in 1994 04
Table 2.1 Annual per Capita Consumption of food 08
Table 2.2 Structure of Land use 1 January 1994 11
Table 2.3 Summary Table Cereal Production Latvia 13
Table 2.4 Potato Production 14
Table 2.5 Sugar beet and sugar production 15
Table 2.6 Fresh "egetables 16
Table 2.7 Fruit and berries 17
Table 2.8 Production of milk and dairy products 18
Table 2.9 Beef meat production 19
Table 2.10 Pork production 20
Table 2.11 Poultry production 21
Table 2.12 Wood hatvest 22
Table 5.1 Share of agricultural trade compared to total trade 29
Table 5.2 Main agricultural export commodities 30
Table 5.2 Main agricultural import commodities 31
Table 5.3 Main concessions of the EU free trade agreement 33
Table 6.1 Projections for cereals 37
Table 6.2 Projections for milk and dairy production 38
Table 6.3 Projections for beef 39
Foreword
The European Union has expressed its intention to offer membership to those countries in central and eastern Europe with which it has an association agreement (see box below). Agriculture has been identified as an important issue for future accession, due to its relative size in some of the Central and Eastern European Countries (CEECs) and to the difficulties there might be in extending the Common Agricultural Policy in its current form to these countries.
A series of ten country reports on the agricultural situation and prospects in the CEECs has been prepared by the services of the European Commission in collaboration with national experts and with the help of scientific advisers. The ten countries covered are Bulgaria, the Czech Republic, Hungary, Poland, Romania and Slovakia, which are associated to the European Union through the Europe Agreements, and Estonia, Latvia, Lithuania and Slovenia, which are in the process of being associated.
The country reports attempt to provide an objective analysis of the current situation in agriculture and the agro-food sector in the CEECs and an assessment of the developments to be expected in the medium term.
Extract conclustons Copenhagen summit of 22-23 June 1993
About the data ....
The data used in this country report are derived from a CEEC dataset established by DG VI in cooperation with other services of the European
Commission and with external experts. Data have been selected after a number of analyses carried out by both external research institutes1 and DG VI services. They originate from various sources: FAO, OECD, World Bank, United Nations, USDA, national statistics, economic institutes and the European Commission {DG 11, Eurostat).
The main objective was to obtain a dataset which was as coherent as possible, offering a good comparability of data.
For the agricuHural data, the starting point of the analysis was the work carried out by Prof. Jackson {Institute for Central and East European Studies, Katholieke Universiteit Leuven, Belgium), who compared figures from OECD, FAO and the national statistics of Poland, Hungary, the Czech Republic,Siovakia, Bulgaria and Romania. The conclusion of this study was that the FAO was the most reliable source because these data were standardized, which was not the case for the two other sources.
Moreover, DG VI services compared FAO and USDA data and aHhough for the crop sector there were no important differences, this was not the case for the animal sector where big discrepancies were apparent. This is due to different methodological approaches and also to different coefficients used to transform live
, animal Weight in CarCaSS Weight. I
In general the FAO data for agricuHure were used, but for certain countries and/or for certain products, and in particular for the most recent years, the fJQures were adjusted or replaced by data from ottler sources, after discussion with country specialists and with FAO statisticians. In such cases, FAO coefficients and standards were used to avoid a break in the time series.
Despite all efforts to create a coherent, reliable and up to date dataset, all figures presented in this report should be interpreted with care. Significant changes in data collection and processing methods have sometimes led to major breaks in historical series as the countries concerned have moved from centrally planned to market economies. One general impression is, according to some experts1.2, that these problems may have led to overestimate the decline in economic activity in general and of agricuHural production in particular in the first years of transition: data from 1989 and before being somewhat inflated and data after 1989 underrecording the increase in private sector activity.
1
-M. JACKSON and J. SVVINNEN (1995) : A statistical analysis and survey of the current situation of
agriculture in the Central and Eastern European Countries, report to DG I, Eullipean Commission. - W.J. STEIN LE (1994) : First Study on Data Collection on "Visegrad" Countries and ECO Countries, Empirica Delasasse, Eurostat.
2 S. TANGERMANN and T. JOSLING (1994): Pre-accession agricultural policies for central Europe and
Executive Sumnuuy
General Overview
The total area of Latvia comprises 64600 km2 of which 44% is forest, 3?% is agricultural land, most of it arable.
The total population reached 2.58 million in 1994. Due to emigration of ethnic minorities and a shrinking birth rate, the population has dropped since 1989. One third live in rural areas. The average density of population is some 40 inhabitants per km2• Ethnic minorities, and in particular Russians account for 45% of the total population. In the larger cities, Russians account for nearly two thirds of the population.
Latvia has a good network of roads and railways most of them however in a bad condition. Latvia has practically no energy resources of its own. Electricity was imported from Estonia and Lithuania, petrol mainly from Russia, although demand for both dropped significantly due to declining economical activity. ·
In August 1991 Latvia declared its independence. The "Seim", an unicameral assembly is the legislative body. At present Latvia is governed by a Coalition between th~ left of centre party "National Union Economists" (NUE) and the "Latvian way", with Maris Gailis as Prime Minister. In autumn 1995 general elections will be held and political changes may result.
In January 1995 Latvia became a member qf the Council of Europe and in June, an association agreement with the. EU was signed, which contains the option of later EU membership.
Economic development in the last years has been characterized by a drop in industrial and agricultural production and in the service sector. Deteriorating trade flows, and high rates of inflation added to the problem. In 1994 the economy began to stabilize and for 1995 a slight growth can be expected.
At present Latvia runs a rather moderate budget deficit of around 2%.
The official rate of unemployment reached 6.5% in 1994 and is the highest of all the three Baltic republics. Hidden unemployment however is an important factor and real unemployment may lie well above 10%. Continuing restructuring of the industrial sector will also lead to increasing unemployment. The share of agriculture in employment remains important reaching 18.4% in 1993.
For the time being the banking sector plays an important role in the economy. The Russian influence in the sector remains strong, with the majority of the capital coming from Russia. Latvia left the Rouble zone in 1992 and established its own national currency. The national bank follows a tight monetary policy, which has led to an overvalued currency with negative impact on the competitiveness of exports.
Trade is an important element of the Latvian economy. Machinery, food (particularly fish)and agricultural products used to be the main export commodities. Before the liberralisation, trade flows were mainly within the FSU and at present more than 50% of exports go to the Russian market. On the import side energy and again machinery are the most important commodities, for which the FSU remains the most important trade partner. The trade balance has become negative since 1992 but trade figures are incomplete and vary considerably between sources. In addition there is a lot of unregistered trade which is outside the official statistics. The average import tariffs is 20%. Export tariffs are applied mainly on timber and leather.
Situation of Agriculture
Agriculture is still an important factor in the economy, its share of GDP was 7.8% in 1994, which continues the process of decline in recent years. However, employment in agriculture and in particular on small household plots, is increasing due to a lack of employment opportunities in other sectors.
Agricultural land has diminished significantly over the last decades with a tendency for the less productive land to be afforested or abandoned. At present the total agricultural area comprises 2.35 million ha, two-thirds of which is arable land.
Food consumption for meat and dairy products used to be fairly high in comparison with average incomes but has declined during recent years, while consumption of grains and potatoes has increased.
Structure and Privatisation
After liberalisation, the structure of landownership changed dramatically. The large state farms and collective farms, the so-called "sowkhoses" and "kolkhoses" were reorganized and many of them were later broken up. The land is now being restituted to its former owners. At present, three types of farms prevail: Cooperative farms, manage around 17 % of agricultural land, household plots with an average size between 2 and 4 ha, account for 32% and thirdly, the peasant farms with an average size around 19 ha, farm 46%. The privatisation process however is not yet finished and legal titles to the land are still largely missing.
Farm Production
The area planted to cereals stayed relatively stable around 660.000 ha until 1994, when it contracted to less than 500.000 ha. Yields lie around 2,0 tlha but show much variation due to climatic reasons. Barley accounts for roughly two thirds of cereal production, which reflects the dominating role of animal feed production in this sector. In the Soviet era large amounts of feed grain had to be imported mainly from Russia. However, as a consequence of the massive destocki'f!:g process in the livestock sector, grain imports contracted whereas production of wheat and rye for human consumption has been increasing.
More than half of the arable land used to be planted to fodder crops, mainly perennial grasses but production has dropped in line with falling livestock numbers.
Potatoes are planted on 80.000 ha but yields are fairly low and the annual production lies between 1 and 1.2 Mio t. Roughly one third of the production, which is to a large extent from household plots is used for feed purposes.
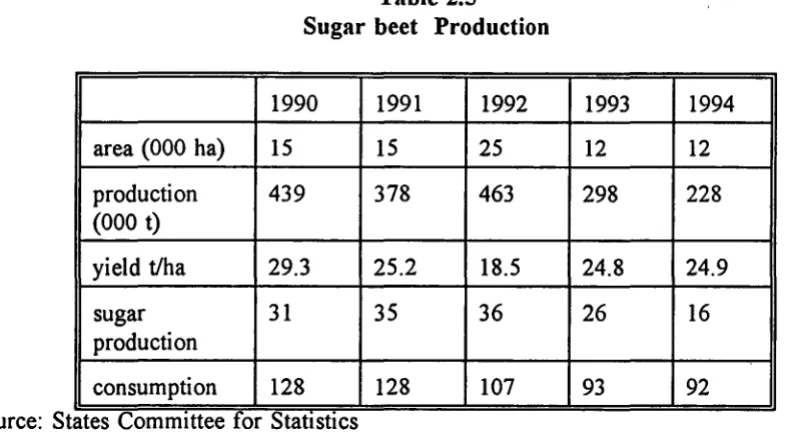
Sugar beet production is mainly an activity of large scale farms. On average, the area planted to sugar beet is between 12-14.000 ha, which is insufficient to cover domestic supply, so that most of the domestically consumed sugar was produced from imported raw sugar and some of which was even reexported. ~ uc w~6:tr processing industry is still largely monopolized.
The production of rape seed and other oil seeds plays practically no role in Latvian agriculture.
Production of fruit and vegetables is mainly an activity of small household plots and plays an important role for the nutrition of families. Production may well have increased over recent years, but statistical evidence for this is weak.
The livestock sector used to be the most important sector of Latvian agriculture. Production by far exceeded consumption and large amounts of meat and dairy products were exported mainly to Moscow and St.Petersburgh. On the other hand livestock production was dependent on imports of feed grain from other Soviet Republics. During the transition process livestock numbers and production figures dropped dramatically with the decline seeming to have bottomed out only in 1994. Consumption and exports dropped by equal amounts. The whole livestock sector suffers from relatively high prices for cereals as well as from the strong currency, which reduces its ability to compete on foreign markets.
Beef meat can be considered to be mainly a by product of milk production and the meat produced is generally of low quality. The cattle inventory dropped to 551.000 heads in 1994, which is less than 40% of the 1990 level. Prices for beef meat are below those for pig meat and reflect the low consumer preference as well as the low quality of the meat.
Pig meat production has experienced a dramatic decline in production, which to some extent is due to high cereal prices, since 1993 Latvia has been a net importer of pig meat. The protein content of animal feed is also low which affects the feed conversion rates.
The upstream and downstream industry
Latvia has little production of fertilizers and agricultural machinery having to import most inputs mainly from the FSU. Utilisation of fertilizers has dropped due to increasing prices. The Agro service sector has been privatized, mainly to its former staff and split into smaller entities.
Except for the grain sector, the processing industry has been largely privatized but due to the drop in primary production suffers from overcapacity. Outworn, oversized and high energy consuming machinery are adding to the problem, so that quality standards and efficiency of production remain low by West European standards. At present there are no slaughterhouses which fulfil the EU hygiene standards, this inhibits exports to that market.
Agricultural Policy
Apart from border protection measures, which have recently been increased, support to the agricultural sector is very limited. State procurement of cereals covers less than 20% of production. In 1994 export subsidies for dairy products were introduced. Within the 1995 budget a total amount of 13.2 Mio Lats {19.7 Mio ECU) have been earmarked for agricultural subsidies. In spite of a prospering banking sector, there is still a shortage of soft credits for the farm sector.
In the Soviet era trade flows were nearly exclusively within the FSU. Dairy and meat products were exported to the Russian market whereas feed grain had to be imported from other soviet Republics. After independence, trade flows deteriorated in general and part of it was reoriented to the EU and EFTA countries. Russia still remains the main single trading partner.
Outlook
Since the contraction of the economy appears to have bottomed out in 1994, moderate growth can be expected for the coming five years. Agriculture will remain an important sector of the economy, especially for the labour market. In rural areas, at least in the short run, household plots will continue to provide livelihood for many families.
There are still a series of blocking factors, which will hamper a quick recovery of the agricultural sector : The process of restitution is proceeding but slowly, the performance of the processing industry is rather poor and investment capital is inadequate. The relationship between prices for inputs and outputs is improving but still not satisfactory.
[image:12.563.97.417.319.460.2]It can therefore be expected, that agricultural production for the main products will increase but at a rather slow pace. In the cereal sector, Latvia will probably remain a net importing country. For dairy products the exportable surplus will be rather small compared to the production. For beef and pig meat it is probable that production will be at or near to self sufficiency.
Table 0.1
Projections for main commodities, production (OOOt)
1993 1994 2000
Cereals 1235 901 1182
Milk 1157 937 1187
beef 107 68 74
TABLE 1 : Latvia in comparison with other CEECs and EU-15
Population GDP GDP pc Total area
(mio) (bio ECU) (ECU) (mio ha)
Bulgaria 8.5 9.4 lllO ll.l
Czech. Rep. 10.3 26.7 2586 7.9
Estonia 1.6 1.5 938 4.5
Hungary 10.3 32.5 3150 9.3
Latvia 2.6 2.2 850 6.5
Lithuania 3.8 2.3 627 6.5
Poland 38.5 73.4 1907 31.3
Romania 22.7 21.8 961 23.8
Slovakia 5.3 8.7 1643 4.9
Slovenia 1.9 9.8 5018 2.0
CEEC-10 105.4 188.3 1786 107.7
EU-15 369.7 5905.1 15972 323.4
Agricultural area Arable area Agricultural production
(rnio ha) (~11 total) (mio ha) (ha pc) (bio ECU) (% GDP)
6.2 55.9 4.0 0.47 1.131 12.0
4.3 54.3 3.2 0.31 0.871 3.3
1.4 30.6 1.0 0.63 0.266 10.4
6.1 65.& 4.7 0.46 2.068 6.4
2.5 39.2 1.7 0.65 0.232 10.6
•
3.5 54.0 2.3 0.62 0.259 11.0
18.6 59.5 14.3 0.37 4.648 6.3
14.7 61.9 9.3 0.41 4.500 20.2
2.4 49.0 1.5 0.28 0.512 5.8 0.9 42.7 0.2 0.13 0.250 4.9
60.6 56.2 42.3 0.40 14.7 7.8
138.1 42.7 77.1 0.21 208.8 2.5
Agricultural employment Rainfall
(000) (%tot. empl.) (mm/year)
694 21.2 550
271 5.6 491
89 8.2 600
392 10.1 600
229 18.4 680
399 22.4 625
3661 25.5 550
3537 35.2 635
178 8.4 6ll
90 10.7 1350
9540 26.7
[image:13.856.196.788.147.441.2]X ... ... ... r-tn ~· §
0.
--"' :a
...
--I:T"' "' n ... :::T
- "'
n "'
:!t~:~
r-e
"' :::1
- 0. ~ ~ [ ~ -o '0 ,_,,
'""\_ 22"0ST .• .I
,4 .
[I
BALTIC SEA
LETTLAND
-i,_: States borders Districts borders • Capital
.A~ r:• //\-' '\ ()
(
~ ... BAY'~ OF RIGA
' \
TALSU '
LITHUANIA
VERWALTUNGSEJNTEILUNG, BEVOLKERUNGSDICHTE 1992
inhabitants per km'
C-J
.
C1
~I
5 lo 9.9
10 to 14.9
l51o 19.9
t
I L I
J
20 In 24.9ll U
n
I
25 to 29.9r---~_-lmnrc than 311
26" 20"
58"NORO·
RUSSIA
56"
1 General overview
1.1 Climate and geography
Latvia has a total land surface of 64.600 km2
, which is comparable to that of Ireland. It is dominated by large forests and a multitude of lakes and rivers. Four natural regions can be distinguished:
the coastal region adjoining the baltic sea;
western Latvia which is characterised by lowland plains; central Latvia which is more mountainous; and
easte~ Latvia which has an average altitude of 170 m
Average temperatures in Latvia reach 17°C in summer and -SOC in winter. Average annual rainfall is 680 mm.
1.2 Population
The official language is Latvian, but due to the existence of large minorities, Russian is also widely spoken.
The census of 1993 recorded an official population of 2.58 million; 90.000 less than in 1989. This represents an annual population decrease of 0.57%, reflecting not only a reduced birth rate but also to a large extent the emigration of ethnic minorities particularly Russian. The age structure is characterized by a relatively high proportion of elderly and retired people and a low birth rate.
I
Ethnic Structure in Latvia
I
The population density ranges from 6 to 50 inhabitants per km2, depending on the region, but the average is 40.3 inhabitants per
krn
2 (Eur average being 15.89 inhabitants/km2). One third of the population lives in the capital Riga. As a consequence of the industrialisation process that started under Soviet rule in the late 194o•s a continuous population shift to urban areas occured. Today more than two thirds of the population live in towns. Another result has(54,6%)
(34,1%)
been a particularly high age structure in the rural areas.
11111 Latvia ns IIIIIIIRussians (7,0%) llmlWhite Russians (4,3%) DOther
in the urban areas. In some cities such as Riga, Russians account for nearly two thirds of the population. In rural areas however, Latvians have always been clearly dominant.
1.3 Education
Latvia has a nine year compulsory school education for all children with the possibility of higher education and specialist training. There are 14 high schools in Latvia and the Latvian University of Agriculture has some 5000 students. A total of about 30 technical schools ensure a professional education.
1.4 Infrastructure
Transport
Latvia has a network of about 2.500 km of railways and 20.500 km of public roads. Latvia was considered to have the best road system of the former Soviet Union but investment in most of the road and railway network is now required. Sea transport plays an important role. Ventspils is the main trading port from where the majority of petrol imports from Russia are unloaded. Other important harbours are Riga and Lipaja.
Energy
Other than hydro-electric power and small amounts of peat, Latvia has no domestic energy resources. During the Soviet era most of the primary energy (petrol and gas) was imported, mainly from Russia, at prices far below the world market level. Estonia and Lithuania were important suppliers of electricity. Following Latvian independence, Russia began to charge world market prices for its energy exports which led to a significant increase in prices, while energy exports from Estonia and Lithuania contracted. Electricity was traditionally widely used in Latvian agriculture but due to the high energy inflation and a drop in production following independence, this has contracted substantially.
Telecommunications
1.5 Political situation
Before being annexed by the Soviet Union in 1940 Latvia had seen only a short period of independence starting in 1922. Before that time Latvia had been under Swedish, Polish and later under Russian rule. During the Soviet period Latvia suffered from a harsh Sovietisation policy, which included collectivization of agriculture and rapid industrialization combined with the intensive immigration of Russians. Encouraged by the glas-nost policy of Michael Gorbachev, Latvia began its struggle for independence which was finally obtained after a referendum in 1991. It is an important fact that even the large minority of Russians supported Latvian independence at that time because it promised growing prosperity for the country.
Latvia declared its independence on August 21, 1991. The national legislature which followed comprised a 100-seatParliament, called the "Saiema". General elections were last held in June 1993 returning a minority coalition under Valdis Birkavs as Prime Minister. The larger coalition partner is the right of centre "Latvian Way" with 36 seats, which favours economic reforms and is free market orientated. The smaller coalition partner was originally the peasants party, "Latvians Farmers Union", with a strongly protectionist policy. However a new government was formed in September 1994 after the Farmers Union deserted the coalition following intensive debate about the introduction of border protection measures. The new ruling coalition under Maris Gaillis, which has now been formed is again a minority coalition between "Latvian way" and a left of centre party the "National Union of Economists" (NUE), which demands stronger state influence on the economy. The opposition is divided between various factions, the most important being the "Latvian National Independence Movement" (15 seats) and "Harmony" (13 seats), which recently split into two factions, one being the NUE. In autumn 1995 general elections will be held and changes in the political constelations are expected.
1. 6 Economic Situation
Occupational activities
The working population, like in other former Soviet republics, has been rather high compared to the total number of citizens. Unemployment has therefore been growing as a consequence of the restructuring process but the official rate of unemployment is still rather moderate at around 6.5%. Hidden unemployment, unpaid leave and part time work, however play an important role and it is estimated that the real rate of unemployment lies in fact far above 10%.
Another result of the restructuring process is that employment in state enterprises has been declining constantly whereas employment in the private sector has been growing.
Table 1.1 Macroeconomic Indicators for Latvia
1990 1991 1992 1993 1994
Population 2,671 2,662 2,632 2,582 2,548
GDP Nominal GDP (million Lats) 62,4 143 1005 1467 1696
GDP per Capita 23,4 53,8 381,7 567,3 665,5
~eal GDP2 (percentage change) -10,4 -34,9 -14,9
-2,2
share of: -Agriculture 9,4 10,3 11,2 10,6 7,8
-Industry 30,1 33,7 26,6 21,1 19,9
Services 30,1 29,6 38,6 48,3 51,9
Monetary Rate of lnflation2 162 858 34,8
24,9
Exchange Rate/ECU 1,027 0,668 0,665
Labour Official Unemployment 2,3 5,8 6,5
Indicators Average WagesLats/month 3 21,5 47,2 74
Real Index 1990= 1 00 100 83,7 70,6 71
Labour share of : - Agriculture 15 16 18,5 18,4
-Industry 37
- Services
Government Total revenue (Mio LVL) 410,1 561,3
Finance (Percent of GDP) 27,9 33,1
Total Expenditure (Mio LVL) 412,6 599,2
(Percent of GDP) 28,1 35,3
Balance ( Mio LVL) -2,42 -37,93
(percent of GDP) 0,2 2,2
Trade Total Exports (Mio LVL) 577 676 553
Totallmports(Mio LVL)) 543 639 695
Trade Balance 34 37 -142
Industrial production
Industrial capacity was largely built up during the Soviet period and the industry has been very much dependent on imports of energy from Russia, while significant parts of production were exported mainly to the Republics of the FSU. The most important industrial sectors used to be mechanical engineering, metal processing, food processing and textiles. For some important products such as transport vehicles (buses), diesel engines, radios and some kind of very simple agricultural machinery, Latvia enjoyed a near monopolistic position on the Soviet market. As a consequence of the restructuring process which is still continuing, the close trading relationship which had been built up with the Republics of the FSU have become more difficult, hindered further because of the enormous inflation rates experienced in the FSU and the inherant trade risks this entails. Resulting from the privatisation process the Latvian agricultural machinery industry is now trying to establish Western markets with its rather solid and simple machinery and some success has been evident. Nevertheless the total value of industrial sector output contracted by nearly 50% between 1990 and 1994 and its share of GDP in the same period shrunk from 30% to 19.9 %. The pace of privatisation was initially rather slow but accelerated during 1994, by which time the private sector accounted for approximately 55% of GDP.
Trade
Since the domestic market is rather small compared to total national production, exports have traditionally been a very important factor in the Latvian economy. Before independence trade was almost exclusively with the Soviet Union. Until 1993 Russia still accounted for more than 50% of both exports and imports, and remains the most important single trading partner for Latvia, even though trade flows to the EU have increased over the last few years. Within the EU, the Netherlands and Germany are the most important export markets. In 1994 trade with the EU has further increased, while trade with the FSU and especially imports have dropped.
Table 1.2
Main trading partners in 1994
Exports Imports
Mio LVL % Mio LVL %
FSU 236 43 212 31
EU 154 28 178 26
EFTA 75 14 116 17
Others 88 15 188 26
TOTAL 553 100 694 100
The main products for export used to be machinery and foodstuffs, but due to the drop in industrial and agricultural output, products like unprocessed wood have gained a larger share of exports. Fish remain one of the most important export commodities with over 70% of production is still exported to Lithuania and the FSU.1 On the import side energy, machinery,
textiles and chemical products are the dominating commodities, with the Republics of the FSU, mainly Russia, being by far the most imprtant trading partners.
Trade figures vary between different sources and have to be viewed with great caution. The official trade statistics are based on the trade volumes and values registered by the customs authorities. For to a number of reasons, including a substantial share of black market transactions across the Russian border, technical problems within the customs administration, and barter trade which is usually not included in official statistics, it is difficult to determine the real value of traded commodities. Official trade figures are therefore not yet complete and need to be improved. From 1994 progress in that direction can already be observed which should lead to more consistent trade data in the future.
Due to the internal price structure within Russia, which lies below world market levels, many products, but mainly crude oil and metals; are exported illegally to the Baltics and to some extent may be reexported again to other destinations. Some statistical sources try to include this as an estimation of the volume of black market trade, while other sources refer only to officially registered trade. The true value of these illegal trade flows is difficult to estimate but might reach between 20 and 50% of officially registered trade.
Since 1992 trade volumes have declined signi.ficantly and the trade balance has became negative. This however is counteracted by a surplus in the service sector, firstly in the banking sector but also the transport sector [and the transfer-trade contributed to this surplus.]
A standard tariff of I% is applied to most imports. In order to support domestic production tariffs of up to 45% are applied on goods that can be produced locally. The average protection is around 20%. Agricultural products from Russia and the Ukraine are subject to these higher tariffs. Export taxes are applied to metal products, timber and leather.
Currency and monetary questions
Latvia left the Rouble zone in 1992 and established an intermediate national currency, the LVR, which was replaced by the Lat in June 1993. Due to a strict monetary policy. the Latvian currency has remained stable. Unlike the two other Baltic Republics, Latvia has not pegged its currency officially to another hard currency such as the deutch mark but since its introduction in 1993 the Lat has been kept stable against the SDR, the money basket used by the World Bank.
The stability of the currency has however contributed to increasing imports, shrinking exports and consequently the recent negative trade balance.
The rate of inflation increased sharply in 1991 and 1992 reaching 162% and 858% respectively, but decreased to 34.8% in 1993 and is expected to be confirmed at around 25% for 1994 2•
Wages and prices
During the Soviet era and until 1992 Latvia applied a system of wage indexation, leading to automatic wage rises. Due to high inflation however, real wages dropped and only 1993 witnessed the first real wages rise since independence. In the state sector the average salary per month as at April 1994 was LAT 78. Similar data is not available for the private sector.
It can however be assumed, that especially in the banking sector, average wages are about three times as high as in the state sector. Wages in all three Baltic states are considerably lower than in Poland and the Czech Republic but are higher than in neighbouring Russia, the Ukraine and Belarus. Due to the low level of income expenditure, food accounts for at least 45% to 50% of an average Latvian salary.
Retail prices for agricultural products are the highest of the three Baltic Republics. In 1994 the following retail prices were given: most expensive was pork meat at with ECU 2.4/kg followed by beef meat and chicken meat which have been sold at a price of ECU 2.38 and 2.35 respectively. Milk prices reached ECU 0.34 per litre and bread was sold at a price of ECU 0.44 per kg.
2 Agricultural Economy
2.1 Importance in the economy
Agricultural production plays an important role in the national economy. Its share of GDP was 10.3% in 1991. Following the establishment of national statistics, this figure remained relatively stable until 1993; estimations for 1994 lie at around 7.8%. Agriculture employs an important part of the labour force, most of it in the livestock sector. The World Bank report of 1993 suggested that 250 000 people were employed in the agricultural sector. This figure includes the owners of restituted land, who are not necessarily engaged in farming as well as people working on household plots. The real number of people employed in agriculture might therefore be closer to 170 000. As a consequence of the bad situation in other sectors, employment in agriculture increased in recent years, reaching 18.4% in 1993. Labour productivity is however considerably lower than Western European standards.
At least in the short term the agriculture sector will remain an important employer since it continues to provide a basis of living for a large number of families at least as long as opportunities in the industrial and service sectors are not sufficiently developed.
2.2 Land Use
I
Use of Agricultural Land
I
(66,7%)
(0,9%) ~Arable Land
em
Pastures(32,4%) 111111111 Permanent crops
I
Total agr. surf.2,53 Mio haI
Only 39% of Latvia is utilised for agriculture, most of which is arable. The agricultural surface has however declined sharply in the last 40 years with more than 1 million ha of agricultural land being abandoned and subsequently afforested, a tendency which may continue in the future.
The most fertile soils can be found in the plains to the south of Riga, where most of the sugar beet production and also fruit and vegetable production is concentrated. The central and eastern parts are hilly areas which are less favourable for crop production and which are therefore dominated by cattle breeding. Flax production is also concentrated mostly in these districts.
Latvian agriculture has been a traditiona+ producer of livestock and dairy products with considerable export capacities.
Soil quality is variable but typically fairly poor with 54% being podsolize soils. The climate is favourable for agricultural production, severe droughts such as experienced in 1992 are rare.
1.7 million ha of agricultural land is drained but drainage systems have often been left to deteriorate and need repair. Agricultural output has been affected by this as well as by soil compaction. Soil maps are available for most of the country.
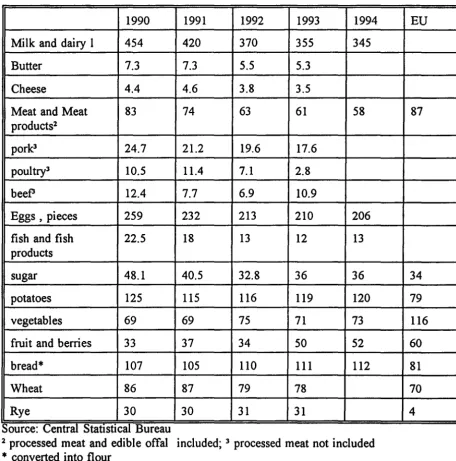
2.3 Food Consumption
Per capita consumption of sugar has been particularly high but is explained mainly by the fact that much of the sugar was processed into alcohol.
Table 2.1
Annual per capita consumption of food (kg)
1990 1991 1992 1993 1994
Milk and dairy I 454 420 370 355 345
Butter 7.3 7.3 5.5 5.3
Cheese 4.4 4.6 3.8 3.5
Meat and Meat 83 74 63 61 58
products2
pork3 24.7 21.2 19.6 17.6
poultry3 10.5 11.4 7.1 2.8
beeP 12.4 7.7 6.9 10.9
Eggs , pieces 259 232 213 210 206
fish and fish 22.5 18 13 12 13
products
sugar 48.1 40.5 32.8 36 36
potatoes 125 115 116 119 120
vegetables 69 69 75 71 73
fruit and berries 33 37 34 50 52
bread* 107 105 110 111 112
Wheat 86 87 79 78
Rye 30 30 31 31
Source: Central Statistical Bureau
2 processed meat and edible offal included; 3 processed meat not included * converted into flour
2.4 Structure and Privatisation
EU
87
34
79
116
60
81
70
4
household plots remained dependent on the large scale farms. For the bulk of their production they used the marketing channels of the state farms, which was also true for machinery and the supply of other inputs.
The privatization process is legally based on different laws, which distinguish between the privatization of land and the restitution of other agricultural assets, such as buildings, stables etc. Such a distinction was made necessary because of different titles of ownership for the land, which was state owned and for the other assets which were the property of the kolkhoses and sowkhoses.
The process of land restitution in Latvia is very complicated, due to the fact that the first privatisation laws pursued the aim of returning land primarily to those who used the land. Over time this attitude was changed and historic ownership rights from the pre-Soviet period were taken as the major criterion for land restitution. This change led to a number of problems and competing claims for restitution, making arrangements for compensation necessary.
The first law, leading only to a partial restructuring of agriculture was the "Law on Peasant Farming" of May 1989. This gave the right to use parcels of land to create private family farms, but without stating ownership to the land. This marked the first time in the Soviet era that private farming was allowed and given the same rights as the large scale production units. The next stage was the "Law on Land reform", adopted on November 21, 1990, which set up the legal conditions and administrative framework to restore rightful ownership to the land nationalized during the Soviet period. This law was based on a decision of the Supreme Soviet ofLatvia, which made the way free for land reform and restructuring of the state- and collective farms. Claims for land restitution had to be submitted before June 20 1991 with land users being given preferential status for restitution.
Actual property rights were not stated until the "Law on Land Privatization in Rural Areas" was adopted on July 9, 1992. Former owners who did not claim for restitution under the previous law could now claim for compensation in land or in vouchers. The possibility to provide compensation in cash is now under discussion.
After being transformed into legal enterprises, an evaluation of the assets of the former kolkhoses and sowkhoses was carried out under the auspices of a privatisation commission, which consisted basically of members/employees of the farms to be privatized. The assets were then divided into several production units, allowing them to commence commercial farming. These production units could then be purchased with "shares" which were distributed among farm workers, taking into account salary, the time worked, and the value of assets brought in when collectivisation took place. Members of the state farms could claim for one or several of the production units. Auctions were carried out if several claims were registered for the same production unit. The balance sheet values were taken as starting prices but especially for machinery and livestock, auction prices far exceeded these levels.
privatization of other assets. Consequently production units were often left without land and could not be operated properly.
Finally the pace in which the legal titles to the land were stipulated was very slow, due to both administrative difficulties and missing land boundaries and land registration. In January 1995 ownership rights had been issued for some 7000 family farms and about 6000 household plots, accounting altogether for 222.000 ha, i.e. less than 10% of agricultural land.
The structure of Latvian agriculture is now characterized by four different types of farms. Firstly there is a growing number of private family farms with an average size of around 20 ha of land, part of which is forests. Indeed many have significant forest areas, which provide additional income. The area managed by family farms has increased significantly in the last year and reached nearly 47% of total agricultual land by the beginning of 1995. Small scale farms have had a low degree of specialisation, but especially in the dairy sector a tendency towards increasing specialisation can now be observed.
I
Structure of Land Use
I
(17,4%)
(2,0%)
(32,7%)
!Jan. 19951
(48,0% L\\1 Peasant farms
1m Household plots
1111111 State farms
1m Statutory Companies
The second type of farm are the household plots and subsidiary farms with an average size of 5.2 ha and 2 ha respectively, which started to be established in the Soviet era but have recently increased in size. As far as the farm size is concerned, there is a certain overlapping between family farms and household plots, since about 40% of household plots are now larger than 5 ha. Household plots and subsidiary plots account for 32% of agricultural land. For the time being they primarily play a social role but a proportion will continue to grow and start professional farming. At present small land users tend to keep their land to produce food for their own use and for some additional income. Low land prices and difficulties with legal titles are further obstacles which have hampered further restructuring. A land market is practically non existant.
The third type of farm are the so- called "statutory companies". They are the "heirs" of the ••sowkhoses" and "kolkhoses", which have been transformed into limited liability companies, stock companies or share holding companies. Since some of these enterprises did not perform very well their share of total land use dropped from 31% at the beginning of 1994 to only 17% by the beginning of 1995. In the same period their number fell from 812 to 656. The future of many of these farms is still rather uncertain. Some have been split further and some of them have been transformed into individual farms. Within the statutory companies, a certain concentra#on of shares has occured. It can be expected however, that in the longer run this type of farm will represent some 15% of the agricultural area.
Table 2.2
Structure of land use 1 January 1995
Number Total area average %of
(000 ha)2 SIZe total
(ha) area
Peasant farms 64364 1278.7 19.9 46.7
Household 118749 620.5 5.2 22.7
plots
Private 124736 251.6 2 .. 0 9.2
subsidiary farms
Private 65037 6.95 0.1 0.3
orchards
State farms 95 52.0 547 1.9
Statutory 656 463.0 706 16.9
compames
others 4149 82.6 15.1 2.3
TOTAL 377686 2735.3 7.2 100
Source: Latvtan State Institute for A ranan Economtcs· g , 2 about 200.000 ha of af forested land included, which is no longer used for agricultural purposes.
2.5. Arable crops
Before independence the arable sector's primary function was to supply the livestock sector with feed grains and compound feed. More than half of the arable land was put to fodder crops. Despite this, domestic production of cereals was far below the level of consumption and large amounts of feed grains had to be imported, mainly from the FSU, to supply the livestock sector. The economical and political changes which followed liberalisation also affected arable production. In 1994 there was a significant drop in the cultivated area and approximately 20% of the agricultural area was left idle~ a process that might not yet have found its end in 1995.
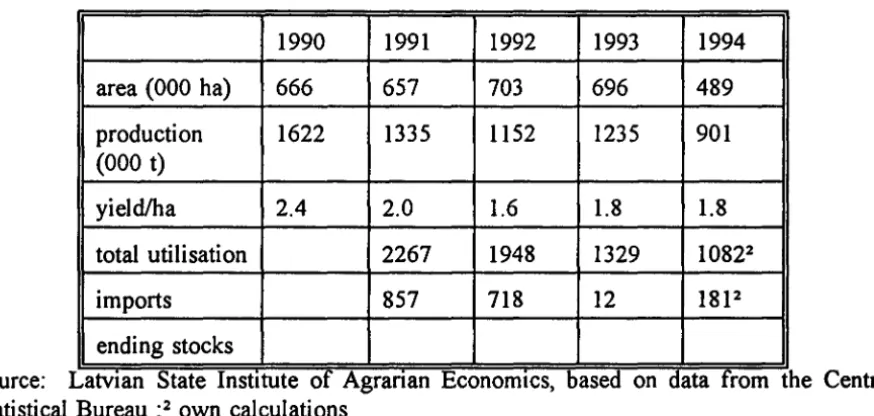
2. 5.1
Cereals
the drop in cereal prices, following the 1993 harvest. This made cereal production less attractive and even unprofitable, so that a large percentage of arable land was taken out of production. In 1994 the total area planted to cereals reached only 489 000 ha, 30% less than in 1990.
Within the cereals sector a shift in production can now be observed. The barley area which used to account for more than 50% of total cereals has declined to less than two thirds of its former level whereas, the area of higher yielding wheat _ and rye (for human consumption) is increasing.
Yields and overall
~
.r=
600
g
4000
200
0
I
Cereal production
I
1989 1990 1991 1992 1993 1994
~Barley
ElliiiWheat IIIII!Rye lilll!Others
production are nevertheless declining due to a reduction in the use of fertilizers, pesticides and other inputs. The average grain yield contracted from an average of 2.4 t/ha to 1.8 tlha in 1994. Total grain production similarly contracted to less than two thirds of its former level.
Latvia still remains a net importer of cereals but due to massive destocking in the livestock sector the downwards trend in cereals consumption has been even more pronounced than for production. Feed grain consumption contracted tremendously. In 1994 it reached only 50% of the level in 1990. Grain imports contracted accordingly, whilst per capita consumption of grain and grain products showed some increase, so that despite a declining population. human consumption of cereals stayed relatively stable,
Until 1991 grain prices were officially regulated. Despite the price deregulation which then followed, the National Grain Monopoly "Latvia Labiba" has used its dominant market position to enforce a certain price level. As a consequence, in 1992 and early 1993, grain prices in Latvia were far above the level of the two other Baltic Republics and attracted (black market) imports. This together with reduced demand lead to high stocks, increasing import pressure and to protectionist measures. Otherwise the high price levels for cereals aggravated the difficulties of the livestock sector. From 1993 however, prices for cereals contracted, leading to large unsaleable stocks and indebtedness in the processing industry. Average prices for wheat ranged from Lats 54-66 (ECU80-98) per ton for the 1994 harvest.
The Latvian Grain Board as it currently exists was established in 1993. Its main purpose is to assure a certain control over the sector and especially to prevent black market activities. Enterprises engaged in the trade and marketing of grain have to be registered and imports and exports have to be licensed. In addition, the grain board organises the procurement for the national grain reserve and is responsible for guaranteed minimum prices. At present these are below the market price level.
Due to the fact that data on trade and consumption are rather weak, the supply balance for cereals (see Annex) should be considered as only a rough estimate.
'I
I
I
·I
·I .II
II
I
Table 2.3
Summary table cereal production Latvia
1990 1991 1992 1993 1994
area (000 ha) 666 657 703 696 489
production 1622 1335 1152 1235 901
{000 t)
yield/ha 2.4 2.0 1.6 1.8 1.8
total utilisation 2267 1948 1329 10822
imports 857 718 12 18P
ending stocks
Source: L atvtan State Institute of A ranan Economics
g
based on data from t he Central Statistical Bureau ;2 own calculations2.5.2 Fodder crops
2.5.3 Potatoes
The total area planted with potato varied around 80.000 ha, the annual harvest being around one million tons. In 1994 both the potato area and harvest declined due to bad weather conditions. Potato yields vary between 12 and 14 tlha. Around one third of potato production is used for feed purposes.
After liberalisation the production of potatoes increasingly switched to small scale farms. National statistics indicate that in 1993 household plots accounted for 64% of the total potato harvest, while a further 28% was produced by small scale peasant farms .. Under present conditions these farms can operate with nearly no visible labour costs, meaning that despite being labour intensive crop, they can not only produce for their own needs, but also to provide some additional income. The statutory companies have consistently reduced their potato production.
Seed potatoes have traditionally been an important export commodity and it is possible that exports of seed potatoes to the FSU will be resumed.
1990
area (000 ha) 80
production 1016
(000 t)
yield tJ ha 12.7
consumption 1189
of which feed 444
of which 309
[image:29.568.83.511.311.567.2]human
Table 2.4
Potato production
1991 1992
82 97
944 1167
11.5 12.0
1039 1120
318 344
309 305
Source: L Statistical Bureau
atvtan State Institute of A ranan Economtcs g
2.5.4 Sugar beet
1993 1994
88 70
1272 994
14.5 14.2
1400
351
308
based on d ata from t he Central
Production of sugar beet is concentrated in the southern districts with greater soil fertility. The area planted with sugar beet has been relatively constant at between 12 and 15.000 ha. Sugar yields and sugar content are relatively low. The exceptional high sugar production of 1992
contracted to its former level. In the last few years production of refined sugar from domestically grown sugar beet accounted for only one third of internal consumption, so that imports remain relatively high and are expected to continue to be so.
Table 2.5
Sugar beet Production
1990 1991 1992 1993 1994
area (000 ha) 15 15 25 12 12
production 439 378 463 298 228
(000 t)
yield t/ha 29.3 25.2 18.5 24.8 24.9
sugar 31 35 36 26 16
production
consumption 128 128 107 93 92
Source: States Committee for Statistics
The sugar market in Latvia is still monopolized. There is an annual tender issued giving rights to the whole domestic sugar production and to assure the total supply of the Latvian market. In return the enterprise winning the tender must guarantee a fixed price for Latvian sugar beet. The British company "Man" has for the past two years held the production rights in Latvia.
2.5.5 Fresh vegetables
The cultivation of vegetables increased mainly on household plots and has helped to improve the nutrition of many families, whereas professional production in large scale farms has dropped in recent years.
1990
area {000 ha) 11
production 169 (000 t)
human consum ption
[image:31.566.74.528.157.348.2]Yield tlha* 14.2
Table 2.6 Fresh vegetables
1991 1992
13 19
209 251
184 197
15.1 17.4
1993 1994
19 18
285 223
184
147.8 12.8 atvtan State Institute of A rarian Economtcs, based on data of Central
Source: L g
Bureau.; .yiels based on open air production
2. 5. 6 Flax Fibre and Linen Oil
Statistical
Production of flax fibre has a long tradition in the Baltic States but for the time being the planted area is rather low and neither the yields nor the quality appear to have been maintained. Flax production might have some potential in the Eastern parts of Latvia with poorer soils. However it is questionable whether production of linen and linen oil can become more than a niche product.
2 S. 7
Permanent Crops
Fruit and Berries
1990
area (000 ha) 25
production 23 (000 t)
consumption
[image:32.563.66.496.82.240.2]Yield t/ha 1
Table 2.7 Fruit and berries
1991 1992
22.9 18
100 66
114 112
4.4 3.7 Source: La
Bureau.
tvtan State Institute of A ranan Economics g
2. 6 Livestock
1993 1994
18 18
118 34
161
6.6 1.9
based on data of Central Statistical
The livestock sector used to be the most important sector of Latvian agriculture and was closely linked to the markets of former Soviet Republics. In the years before independence, the livestock sector accounted for roughly 55% of total agricultural output; 28% being meat production, 23% being dairy production and 4% egg production3• Due to destocking in recent
years, the importance of the livestock sector production may however have declined.
During the Soviet era, a large proportion of animal feed was imported at very low prices from other republics of the FSU. In contrast an important part of the meat production was exported, mainly to Russia. Approximately 25% of total beef and pork production, 20% of poultry production and more than 40% of butter production were exported. Mter independence and the deterioration of commercial links with Russia, imported cereals became more expensive, leading to higher costs of production. Exports of meat and dairy products to Russia consequently dropped.
2. 6.1 Milk and Milk Products
Dairy production now accounts for roughly one fifth of total agricultural output. Production in 1994 dropped below 1 million tonnes which is only 55% of the level of 1990. Cow numbers dropped by nearly 40%, although the yield per cow remained relatively stable (2900 kg in 1994).
As a result of the liquidization of many of the large scale farming units, the whole dairy sector was subject to major disorganisation and many of the large cow herds were dissolved. The difficult economic situation, resulting from very low milk prices and delayed payments (up to six months) by the processing industry added to the problem. As a result, milk production was no longer profitable for commercial farming. Between 1990 and 1994, the percentage of milking cows kept in individual farms (typically with only one or two animals),
increased from 30% to 75%. As cow herds thus contracted, milk quality deteriorated due to the unavailability of cooling equipment on the individual farms. The percentage of milk collected consequentlye declined. The on-farm use of milk on the other hand gained importance. In 1994, the decline in cow numbers appeared to have bottomed out and a certain tendency towards larger cow herds and more specialisation in the individual farms can be observed. In the medium term, herds are expected to reach between 20 and 30 cows per farm. This would also provide scope for the necessary investments to be made and to increase milk yields.
Before independence more than 90% of milkproduction was collected and processed. Since production far exceeded domestic demand, an important share of dairy products, especially butter, were exported mainly to Russia. In 1990 about 25.000 t of butter were exported mainly to Russia. Trade volumes deteriorated significantly after independence and in 1993 exports might have been no more than 5000 t. Product quality does not generally meet Western standards, so that the opportunities for new markets, except for milk powder, cannot at present be easily found. In addition, internal consumption of butter decreased due to strong competition from cheaper margarine.
[image:33.568.62.508.425.692.2]Farm gate prices for raw milk in 1993 ranged between L VL 0.08 (ECU 0.053) per litre for extra class and L VL 0.05 (ECU 0.033) for third class milk, i.e. less than 20% of the equivalent EU farm gate price. These prices did not cover production costs, at least for commercial farmers. In 1994 prices increased and ranged between L VL 0.066 (ECU 0.09) and L VL 0.09 (ECU 0.13), leading to better profitability for the milk sector.
Table 2.8
Production of milk and dairy products
1990 1991 1992 1993 1994e
Milk production (000 t) 1893 1741 1478 1157 937
dairy cows 535 531 482 351 312
(000 heads)2
yield per cow 3400 3205 2793 2741 2923
(kg/head)
butter production 43.6 38.3 31.8 18.8 8.8
(000 t)
SMP production 5.6 7.1 5.4 2.7 0.8
(000 t)
cheese production 24 21 15 14 9
(000 t)
2.6.2 Beef
Beef meat production is also an important sector of Latvian agriculture in terms of both domestic consumption and export and is closely connected with the dairy sector. Until now beef meat was mainly a by-product of milk production and special breeds for meat production were rarely used.
Total production of beef and veal amounted to 125.000 t in 1990 of which one quarter was exported, mainly to Russia. In 1994 production fell to only 68.000 t, and exports contracted equally. The cattle inventory showed a decline from 1.4 million animals in 1990 to 551.000 animals in 1994. The problems which have been evident in the dairy sector have also led to reduced production and exports of beef meat. New market outlets are difficult to establish and due to the poor sanitary conditions of slaughterhouses, exports to the EU do not appear possible for the moment.
Prices for beef meat are below those of world market and still far below the price of pork meat. This is at least partly due to the low quality of meat resulting from the slaughtering of older cows during the destocking process, but the low price level also reflects consumer preference for pig meat.
Table 2.9
Beef meat production
1990 1991 1992 1993 1994e
cattle (000 head)2 1439 1383 1144 678 551
meat production 125 132 120 107 68 (000 t)
consumption 68 94 74 79 683
(000 t)
exports2 57 58 64 37 29
(000 t)
imports (000 t) 4
ending stocks
Sourc es: State Committee or Statistics and own calculatiOns
[image:34.557.47.466.365.602.2]2 exports have been calculated as exportable surplus. They do not refer to official trade
2.6.3 Pork
Before independence pigmeat production was concentrated on large scale farms. With an annual production of about 138.000 tin 1990 pig meat production even exceeded the level of beef meat production. But 1993 and 1994 witnessed a sharp decline in production to only 54.000 t.
Apart from the difficulties presented by the transition process, the pig sector has also had to face the handicap of high cereal prices, which however have not led to correspondingly high pigmeat prices. Hence the profitability of the sector has deteriorated. The inadequacies of the processing industry added to the problem and indeed remains a major obstacle for improvement. At present the bulk of commercial pig meat production is concentrated in three large scale production units, which have around 100 000 pigs each. Individual farmers with around 100 pigs per farm account for the remaining commercial production. Otherwise an important number of pigs are kept in household plots but mainly for on farm consumption or for direct marketing. Official statistics may not completely take account of this situation. Partly due to increasing prices for pig meat and lower prices for cereals, the situation in the pig sector began to improve in 1994 and pig numbers stabilized.
The drop in production has been followed by a drop in exports. Exports nearly ceased in 1993 while in 1994 Latvia became a net importer of pork, mainly from Denmark and Germany. The overvalued currency may also have played a role in this development.
The average farm gate price for live weight pig meat increased in 1994, reaching about Lat 706/t (ECU 1061) compared to Lat 518 (ECU 726) in 1993. An increase in the profitability of pig meat production is therefore expected.
1990
pig numbers 1401
(000 head)
meat production 138
(000 t)
consumption 93
(000 t)
exports2 (000 t) 9
imports (000 t)
ending stocks
Table 2.10 Pork production
1991 1992
1246 867
126 101
83 69
10 13
1993 1994
482 501
68 54
64 63
0 0
4 12
Sourc es:source: Latvtan State Institute of AJ ranan Economics, based on data of g C
Statistical Bureau. 2 own calculations
2. 6.4 Poultry
The poultry sector has witnessed the sharpest decline in production in recent years. Between 1990 and 1994 production and exports of poultry meat fell to one-fourth of its former level, while the production of eggs halved to around 20.000 t by 1994. Poultry meat production is concentrated in a very few large scale enterprises, whereas there is only one big commercial egg producer accounting for aproximately 80% of total production volume. Apart from production for on farm use, small scale farms do not play a major role in poultry production, partly due to problems with salmonella. It seems to be unlikely, that poultry production will recover very rapidly in the coming years.
1990
number of 10321 animals (0000)
meat production 40 (000 t)
[image:36.556.53.482.232.396.2]egg production 46 (000 t)2
Table 2.11
Poultry production
1991 1992
10395 5438
33 21
43 33
1993 1994
4124 3662
13 11
21.8 20.2
Sourc e: Latvtan State Institute of A ranan Economics based on data from Central Stati g
Bureau; 2 1 egg
=
56gSheep
stical
Sheep meat and wool production is of minor importance. Total production does not exceed 4000 t per year. The sheep inventory declined from 160.000 heads in 1990 to 86.000 in 1994.
2. 7 Forestry
Forests cover 44% (2.81 million ha) of Latvia, two thirds of which are conifer, mainly pine. The forest area increased largely in recent decades as the agricultural area reduced. The timber is mainly used for paper production and for construction purposes but domestic manufacturing capacities, such as paper-mills and saw-mills are missing. 30% of the forest area remains state property.
Many of the newly established individual farms have an important share of forest land, which provides them with both, heating material and the possibility of receiving some additional m come.