This is a repository copy of
Variance Based Sensitivity Analysis of IKrIKr in a Model of the
Human Atrial Action Potential Using Gaussian Process Emulators
.
White Rose Research Online URL for this paper:
http://eprints.whiterose.ac.uk/118258/
Version: Accepted Version
Proceedings Paper:
Chang, E.T.Y., Coveney, S. and Clayton, R.H. orcid.org/0000-0002-8438-7518 (2017)
Variance Based Sensitivity Analysis of IKrIKr in a Model of the Human Atrial Action
Potential Using Gaussian Process Emulators. In: Pop, M. and Wright, G., (eds.) Functional
Imaging and Modelling of the Heart 2017, Proceedings. 9th International Conference on
Functional Imaging and Modeling of the Heart, FIMH 2017 , June 11-13, 2017, Toronto,
ON, Canada. Lecture Notes in Computer Science, 10263 (10263). Springer, Cham , pp.
249-259. ISBN 9783319594477
https://doi.org/10.1007/978-3-319-59448-4_24
[email protected] https://eprints.whiterose.ac.uk/
Reuse
Unless indicated otherwise, fulltext items are protected by copyright with all rights reserved. The copyright exception in section 29 of the Copyright, Designs and Patents Act 1988 allows the making of a single copy solely for the purpose of non-commercial research or private study within the limits of fair dealing. The publisher or other rights-holder may allow further reproduction and re-use of this version - refer to the White Rose Research Online record for this item. Where records identify the publisher as the copyright holder, users can verify any specific terms of use on the publisher’s website.
Takedown
If you consider content in White Rose Research Online to be in breach of UK law, please notify us by
Variance Based Sensitivity Analysis of
I
K rin a
Model of the Human Atrial Action Potential
using Gaussian Process Emulators
Eugene T. Y. Chang1,2, Sam Coveney3, and Richard H. Clayton1,2
1
Insigneo institute of in-silico medicine, University of Sheffield, Sheffield, UK 2
Department of Computer Science, University of Sheffield, Sheffield, UK 3
Department of Physics and Astronomy, University of Sheffield, Sheffield, UK [email protected]
This is an author self-archive of conference proceedings published in Pop, M., Wright, G. A. Eds. Functional Imaging and Modelling of the Heart 9th International Conference, FIMH 2017, Toronto, ON, Canada, June 11-13, 2017, by Springer International Publishing. Full
proceedings are available athttp://www.springer.com/gp/book/9783319594477,
and the DOI of the final published version of this contribution is
DOI:10.1007/978-3-319-59448-4 24.
Abstract. Cardiac cell models have become valuable research tools, but biophysically detailed models embed large numbers of parameters, which must be fitted from experimental data. The provenance of these param-eters can be difficult to establish, and so it is important to understand how parameter values influence model behaviour. In this study we exam-ined how model parameters influence the repolarising currentIK rin the Courtemenache-Ramirez-Nattel model of the human atrial action poten-tial. We used a statistical approach in which Gaussian processes (GP) are used to emulate the model outputs. A GP emulator can treat model inputs and outputs as uncertain, and so can be used to directly calculate sensitivity indices. We found that 3 of the 10 parameters influencingIK r had a strong influence onAP D70,AP D90, and DomeVm. These three parameters scale the magnitude of theIK rgating variable time constant and the voltage dependence of the steady state activation curve, and these mechanisms act to modify the amplitude ofIK rduring repolarisa-tion. This study highlights the potential value of statistical approaches for investigating cardiac models, and that uncertainties or errors in pa-rameters resulting from attempts to fit experimental data during model development can ultimately affect model behaviour.
1
Introduction
represent not only changes in transmembrane potential resulting from movement of ions through the cell membrane, but also the diffusion, storage, release, and uptake ofCa2+within the cell [5]. Typically, cardiac cell models are a stiff,
non-linear system of coupled ordinary differential equations, and are solved using a numerical scheme to obtain time series of membrane voltage, intracellularCa2+
concentration, and other quantities of interest.
Each of the equations involve parameters; for equations describing trans-membrane current flow through ion channels, pumps, and exchangers these pa-rameters typically include a maximum current density per unit membrane area, and other parameters that regulate the dynamic behaviour of the current. The parameters are fitted from experimental data often following the approach pio-neered by Hodgkin and Huxley [6]. Many models take a modular approach to building the full suite of equations representing transmembrane current flow, with re-use of parameters from older models and experiments. The provenance of these parameters is not always easy to establish [11], yet the influence of un-certain parameters on model behaviour is difficult to assess because of model complexity.
Recent studies have begun to address this problem by examining the sen-sitivity of model outputs such as action potential duration (APD) to variable model parameters [2,16]. These studies have concentrated on maximum conduc-tances of ion channels, but even with this subset the potential parameter space to explore is vast. Although cardiac cell models are relatively cheap to compute, a comprehensive exploration of very high dimensional parameter space remains computationally demanding.
An alternative approach is to build a statistical model (anemulator or meta-model), which acts as a fast running surrogate for the original model or simu-lator. This approach has been used to examine models of systems including atmospheric pollution [8] and galaxy formation [17], where the emulator is a Gaussian process (GP) [13]. A particular advantage of a GP emulator is that the simulator parameters, or inputs, can be treated as uncertain so that they are represented by a distribution rather than a fixed value. Using Gaussian (nor-mal) distributions allows direct calculation of expected mean and variance of an output given uncertainty in the inputs. The proportion of output variance that is accounted for by variance in each input is then a first order sensitivity index [13]. Furthermore, the main effect of model inputs can be directly calculated, showing how a single input affects an output given specified distributions on the other inputs. This approach has been used to examine cardiac cell models, where inputs were ion channel maximum conductances and outputs were features of the action potential [3,7].
The rapidly inactivatingK+ currentI
2
Methods
2.1 CRN Model Inputs and Outputs
The equations describing theIKr current in the CRN model [4] are given below. The current densityIKr is given by
IKr =
gKrxr(Vm−EK)
1.0 + exp
V
m+Kr1 Kr2
. (1)
Where the gating variablexr varies between 0 and 1, and is given by
dxr dt =
xr∞−xr τxr
; (2)
where the gating variable time constantτxr and steady state activationxr∞
depend on transition ratesαxr andβxr;
αxr =Kr3
Vm+Kr4
1.0−exp
−Vm+Kr4 Kr5
, (3)
βxr =Kr6
Vm−Kr7
exp
Vm−Kr7 Kr8
−1.0
, (4)
τxr= 1.0
αxr+βxr
, (5)
xr∞=
1.0 + exp
−Vm+Kr9 Kr10
−1
. (6)
Each of the 10 parameters labelledKr1toKr10appear as numbers without
units in the original formulation, and in this study we examined variation in the range 0.5×to 1.5×these values as shown in shown in Table 1. The maximum conductancegKr was set to a baseline value of 0.0294 nS/pF and EK was set to -86.7653mV for fixed intracellularK+ concentration, as described below.
We identified seven outputs that describe features or biomarkers of the action potential, based on previous work [2,3], and these are illustrated in Fig 1.
2.2 Implementation of CRN Model
The CRN model equations were implemented in Matlab (Mathworks, CA), us-ing code automatically generated from the CellML repository (http://cellml. org). The cell models were solved using the Matlabode15stime adaptive solver for stiff systems of ODEs, with tolerances set to 10−6. The CRN model does not
properly balance intracellular ion concentrations [18], so we fixed [N a+]i and
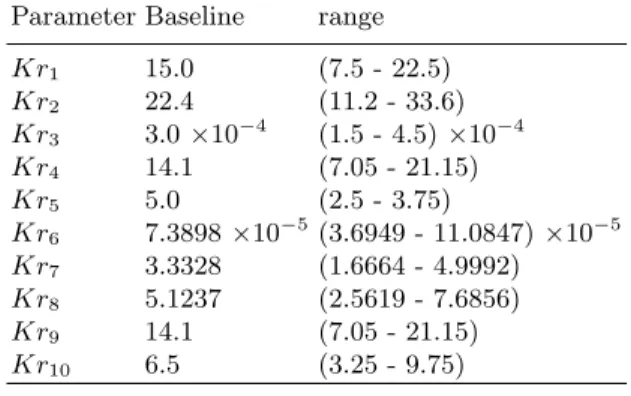
Table 1. Baseline values for each input, and range over which each input was varied for design data.
Parameter Baseline range
Kr1 15.0 (7.5 - 22.5)
Kr2 22.4 (11.2 - 33.6)
Kr3 3.0×10
−4
(1.5 - 4.5)×10−4
Kr4 14.1 (7.05 - 21.15)
Kr5 5.0 (2.5 - 3.75)
Kr6 7.3898×10⁻⁵ (3.6949 - 11.0847)×10−5
Kr7 3.3328 (1.6664 - 4.9992)
Kr8 5.1237 (2.5619 - 7.6856)
Kr9 14.1 (7.05 - 21.15)
Kr10 6.5 (3.25 - 9.75)
0 100 200 300 400 500 600
Time (ms) -80
-60 -40 -20 0 20 40 60
Voltage (mV)
max Vm
dome Vm notch Vm
rest Vm max dVm/dt
APD90 APD70
Fig. 1. Action potential features
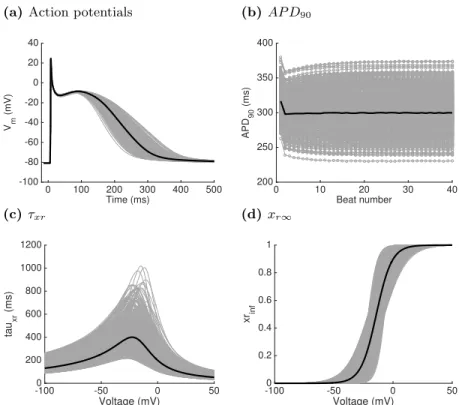
2.3 Emulator Design Data
For fitting and evaluating the GP emulators, we obtained design data comprising a set of 500 simulator runs. For each run, a value for each input was selected from the range shown in Table 1, using Latin hypercube sampling to ensure an even distribution of points in the input space. To achieve a stable action potential duration, each simulator run included 40 stimuli of strength -2.0 nA
(a)Action potentials
0 100 200 300 400 500 Time (ms)
-100 -80 -60 -40 -20 0 20 40
Vm
(mV)
(b)AP D90
0 10 20 30 40
Beat number 200
250 300 350 400
APD
90
(ms)
(c) τxr
-100 -50 0 50
Voltage (mV) 0
200 400 600 800 1000 1200
tau
xr
(ms)
(d)xr∞
-100 -50 0 50
Voltage (mV) 0
0.2 0.4 0.6 0.8 1
xr inf
Fig. 2. Design data showing (a) final action potential out of a sequence of 40; (b) stabilisation ofAP D90 during the 40 beat sequence; (c) and (d) voltage
dependence of steady state activationxr∞and gating variable time constant τxr for each set of inputs. Bold lines indicate the model behaviour for baseline values of the inputs, grey lines show design data.
2.4 Sensitivity Analysis
First order sensitivity indices produced from a GP emulator represent the pro-portion of total output variance that is accounted for by variance in each input [13]. We assumed that inputs and outputs could be described by a normal dis-tribution, with the mean of each input set to the baseline value and variance set to 0.01 of the range shown in Table 1.
3
Results
3.1 Emulator Fitting and Evaluation
been withheld to ensure anonymity of the authors.GP emu UQSA(available from
http://doi.org/10.5281/zenodo.215521). For each output, the 500 design
data were separated into a training set of 450 simulator runs and a test set of 50 simulator runs. Emulator hyperparameters were fitted to the training set with a maximum likelihood approach described previously [3], using thefmin l bfgs b
optimisation function available in the Python SciPy package. Fitting was re-peated five times to ensure that local maxima were avoided, and the fit with greatest likelihood was selected. The test set was then used to compare outputs predicted by the emulator against those produced by the simulator for the same set of inputs. The difference between emulator and simulator outputs was sum-marised using the Mahanalobis distance, which for a test set of 50 runs has a reference distribution with mean 50 and standard deviation 10.5 [1].
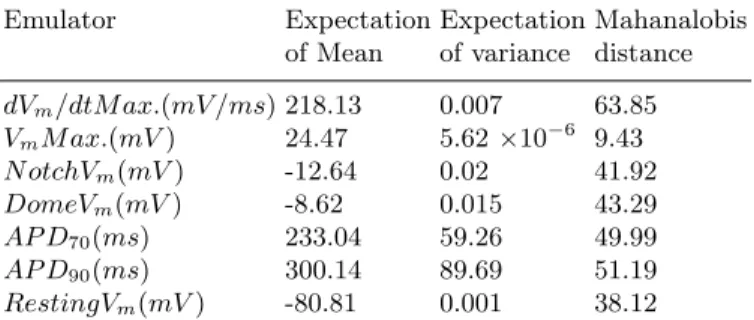
Table 2.Fit and evaluation of emulator for each output.
Emulator Expectation Expectation Mahanalobis
of Mean of variance distance
dVm/dtM ax.(mV /ms) 218.13 0.007 63.85
VmM ax.(mV) 24.47 5.62×10⁻⁶ 9.43
N otchVm(mV) -12.64 0.02 41.92
DomeVm(mV) -8.62 0.015 43.29
AP D70(ms) 233.04 59.26 49.99
AP D90(ms) 300.14 89.69 51.19
RestingVm(mV) -80.81 0.001 38.12
We considered a Mahanalobis distance between 30 and 70 (i.e. ± 2 SD) to indicate a well fitted emulator, and the only emulator that did not meet this criterion was VmM ax.. The was not surprising, since IKr predominantly influences repolarisation, and inspection of the design data showed a change of only±0.06mV in VmM ax.arising from inputs varied across the full range.
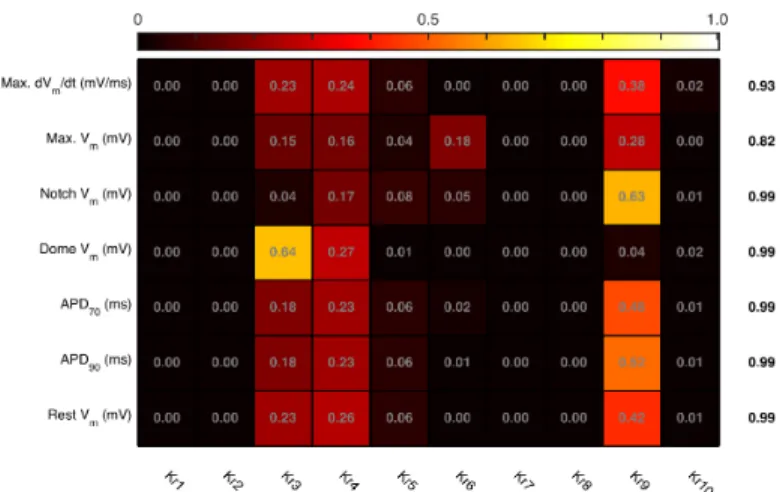
3.2 Sensitivity Indices
The first order sensitivity indices were obtained using GP emu UQSA and are shown in Fig 3. Each row shows the relative contribution of each input, and the sum of these contributions is shown in the column to the right of the main figure. For six of the emulators, the sum of sensitivity indices was close to 1.0, indicating that interaction effects are negligible. The sum of sensitivity indices for theVmM ax.emulator was lower, indicating additional variance arising from either the relatively poor fit or possible interactions.
Fig. 3. Sensitivity indices for each combination of input and output. The column to the right is the sum of sensitivity indices for each output. Inputs Kr3 and Kr4 scale the magnitude and voltage dependence of gate activation (equation 3), and input Kr9 scales the voltage dependence of steady state activation (equation 6).
DomeVm. The main effect is the change in the expected mean of the emulator output as one input changes while all others are assigned a fixed distribution with mean 0.5 and variance 0.01 (in normalised units). These plots show that increasing all three inputs acts to decrease APD.
(a) AP D70
0 0.5 1
Normalised input
-40 -20 0 20 40
Main effect APD70 (ms)
Kr3 Kr4 Kr9
(b)AP D90
0 0.5 1
Normalised input -40
-20 0 20 40 60
Main effect APD90 (ms)
Kr3 Kr4 Kr9
(c) DomeVm
0 0.5 1
Normalised input -1
-0.5 0 0.5
Main effect DomeV (mV)
Kr3 Kr4 Kr9
Fig. 4. Main effects of inputsKr3,Kr4, andKr9 on (a)AP D70, (b)AP D90,
and (c) domeVm. Each input is plotted on a normalised scale corresponding to the range in Table 1.
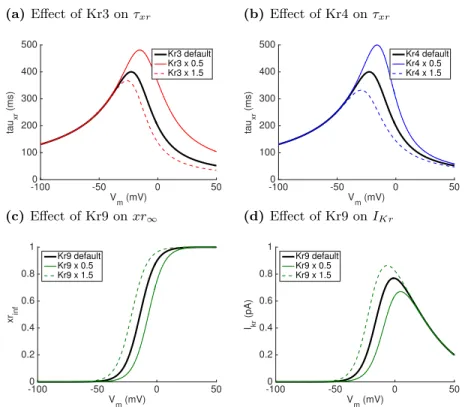
3.3 Insight into model mechanism
Kr3,Kr4, andKr9 by 0.5 and 1.5 on the voltage dependence ofτxr,xr∞, and
steady state IKr is shown. An increased Kr3 and Kr4 resulted in a shorter activation gate time constant, while an increased Kr9 resulted in a leftward shift in the voltage dependence of xr∞, and consequently an increased IKr at voltages close to 0mV.
(a)Effect of Kr3 onτxr
-100 -50 0 50
V
m (mV)
0 100 200 300 400 500 tau xr (ms) Kr3 default Kr3 x 0.5 Kr3 x 1.5
(b)Effect of Kr4 onτxr
-100 -50 0 50
V
m (mV)
0 100 200 300 400 500 tau xr (ms) Kr4 default Kr4 x 0.5 Kr4 x 1.5
(c) Effect of Kr9 onxr∞
-100 -50 0 50
V
m (mV)
0 0.2 0.4 0.6 0.8 1 xrinf Kr9 default Kr9 x 0.5 Kr9 x 1.5
(d)Effect of Kr9 onIK r
-100 -50 0 50
V
m (mV)
0 0.2 0.4 0.6 0.8 1 Ikr (pA) Kr9 default Kr9 x 0.5 Kr9 x 1.5
Fig. 5. Effect of multiplying inputs (a)Kr3 and (b) Kr4 by 0.5 and 1.5 on voltage dependence ofτxr, and effect of multiplyingKr9 by 0.5 and 1.5 on (c)
xr∞, and (d)IKr calculated using steady state values ofxr,xr∞. Bold lines
show baseline model output.
(a)
0 100 200 300 400 500
Time (ms) 0
10 20 30 40
I Kr
(pA)
Default Kr3 x 0.5 Kr3 x 1.5 Kr4 x 0.5 Kr4 x 1.5 Kr9 x 0.5 Kr9 x 1.5
(b)
0 100 200 300 400 500
Time (ms) 0
2 4 6 8 10 12 14
I Ks
(pA)
Default Kr3 x 0.5 Kr3 x 1.5 Kr4 x 0.5 Kr4 x 1.5 Kr9 x 0.5 Kr9 x 1.5
(c)
0 100 200 300 400 500 Time (ms)
-100 -80 -60 -40 -20 0 20 40
V m
(mV)
Default Kr3 x 0.5 Kr3 x 1.5 Kr4 x 0.5 Kr4 x 1.5 Kr9 x 0.5 Kr9 x 1.5
4
Discussion and Conclusions
In this study we have focussed on how the dynamical behaviour of a single ion channel depends on parameters (or inputs) that are fitted from experimental data. We have used GP emulators to calculate sensitivity indices, and have iden-tified three inputs that have the greatest influence on model outputs. This study builds on previous work that has studied how maximum ion channel conductance influence model outputs [2,3,15,16], and another study that has investigated how the dynamics ofIN ainfluence model behaviour [14]. Taken together, these stud-ies show that tools developed for other modelling communitstud-ies can be valuable for examining computationally intensive cardiac models, and that uncertainty or errors in fitting cardiac cell model parameters may have an important influence on model behaviour. The present study highlights a number of directions for future research, and these are discussed below.
Several different approaches have been adopted for sensitivity analysis of cardiac models, and these include partial least squares regression [9,16] and a population of models [15]. In this study we chose to construct GP emulators to examine the properties of the IKr formulation in the Courtemanche model because this approach has already shown promise for analysis of complete car-diac cell models [3,7]. One advantage of GP emulators over other techniques is that the emulator can treat model inputs and outputs as uncertain quantities. Under the assumption that inputs and outputs have a normal distribution then is it possible to directly calculate an output distribution given distributions on model inputs, and this approach is computationally very efficient compared to a more standard Monte Carlo method [3]. Another benefit from a fast-running surrogate of a computationally demanding model is that a large number of model runs can be used to identify sets of model parameters that are consistent with experimental observations, a technique called history matching [17].
To fit the GP emulators, we generated design data by varying each of the inputsKr1 toKr10 in the range 0.5×to 1.5×their baseline value. The baseline values of these inputs are subject to constraints; for example Kr2,Kr3,Kr5,
Kr6, andKr10 should be positive and non-zero. The range of model inputs over which we trained the emulators was selected so that we could undertake sensitiv-ity analysis without breaking the model. However, it is possible that sensitivities are different outside this range. We also note that the effect of varying inputKr9 on the voltage dependence of steady state IKr shown in Fig 5(d) results in a curve that no longer fits the experimental data shown in Figure 3 of [4]. History matching of the IKr formulation to new experimental data, given our finding thatKr3,Kr4, andKr9 have a strong influence on model behaviour, would be an interesting future direction and may be more computationally efficient than other approaches [10].
ex-changers [9]. A useful extension of this approach and the present study would be to combine analysis of maximum conductances with model inputs that control ion channel dynamics.
Acknowledgements: This work was funded by the UK EPSRC through grant
number EP/K037145/1.
References
1. Bastos, L.S., O’Hagan, A.: Diagnostics for Gaussian Process Emulators. Techno-metrics51(4), 425–438, (2009)
2. Britton, O.J., Bueno-Orovio, A., Van Ammel, K., Lu, H.R., Towart, R., Gallacher, D.J., Rodr´ıguez, B.: Experimentally calibrated population of models predicts and explains intersubject variability in cardiac cellular electrophysiology. Proceedings of the National Academy of Sciences of the United States of America 110(23), E2098–105, (2013)
3. Chang, E.T.Y., Strong, M., Clayton, R.H.: Bayesian Sensitivity Analysis of a Car-diac Cell Model Using a Gaussian Process Emulator. PLoS ONE10(6), e0130252, (2015)
4. Courtemanche, M., Ramirez, R.J., Nattel, S.: Ionic mechanisms underlying hu-man atrial action potential properties: insights from a mathematical model. The American Journal of Physiology275, H301–H321, (1998)
5. Fink, M., Niederer, S.A., Cherry, E.M., Fenton, F.H., Koivumaki, J.T., Seemann, G., Thul, R., Zhang, H., Sachse, F.B., Crampin, E.J., Smith, N.P.: Cardiac cell modelling: Observations from the heart of the cardiac physiome project. Progress in Biophysics and Molecular Biology104, 2–21, (2011)
6. Hodgkin, A., Huxley, A.: A quantitative description of membrane current and its application to conduction and excitation in nerve. Journal of Physiology (London)
117, 500–544, (1952)
7. Johnstone, R.H., Chang, E.T.Y., Bardenet, R., de Boer, T.P., Gavaghan, D.J., Pathmanathan, P., Clayton, R.H., Mirams, G.R.: Uncertainty and variability in models of the cardiac action potential: Can we build trustworthy models? Journal of Molecular and Cellular Cardiology96, 49–62, (2015)
8. Lee, L.A., Carslaw, K.S., Pringle, K.J., Mann, G.W., Spracklen, D.V.: Emulation of a complex global aerosol model to quantify sensitivity to uncertain parameters. Atmospheric Chemistry and Physics11(23), 12253–12273, (2011)
9. Lee, Y.S., Hwang, M., Song, J.S., Li, C., Joung, B., Sobie, E.A., Pak, H.N.: The contribution of ionic currents to rate-dependent action potential duration and pat-tern of reentry in a mathematical model of human atrial fibrillation. PLoS ONE
11(3), 1–17, (2016)
10. Loewe, A., Wilhelms, M., Schmid, J., Krause, M.J., Fischer, F., Thomas, D., Scholz, E.P., D¨ossel, O., Seemann, G.: Parameter Estimation of Ion Current Formu-lations Requires Hybrid Optimization Approach to Be Both Accurate and Reliable. Frontiers in Bioengineering and Biotechnology3, 209, (2015)
13. Oakley, J.E., O’Hagan, A.: Probabilistic sensitivity analysis of complex models: a Bayesian approach. Journal of the Royal Statistical Society: Series B (Statistical Methodology)66(3), 751–769, (2004)
14. Pathmanathan, P., Shotwell, M.S., Gavaghan, D.J., Cordeiro, J.M., Gray, R.a.: Un-certainty quantification of fast sodium current steady-state inactivation for multi-scale models of cardiac electrophysiology. Progress in Biophysics and Molecular Biology 117(1), 1–15, (2015)
15. S´anchez, C., Bueno-Orovio, A., Wettwer, E., Loose, S., Simon, J., Ravens, U., Pueyo, E., Rodriguez, B.: Inter-subject variability in human atrial action potential in sinus rhythm versus chronic atrial fibrillation. PLoS ONE9(8), e105897, (2014) 16. Sarkar, A.X., Christini, D.J., Sobie, E.a.: Exploiting mathematical models to illu-minate electrophysiological variability between individuals. Journal of Physiology (London)590(Pt 11), 2555–67, (2012)
17. Vernon, I., Goldstein, M., Bower, R.G.: Galaxy formation: a Bayesian uncertainty analysis. Bayesian Analysis5(4), 619–669, (2010)