A~ncu
tura
~iruation an~ Pro~~ect~
in
t~e
Central and Eastern
turo~ean Countrie~
·· .... Slovenia·
- . '
· . _ ·.: -:· · ·: ::· 6sterreich . ' '
' . ' . .
. ' . ' . . ~ ' ' .
:-.·
:~< ·:-.
:<~>-. Cratie . . . ~ . . . " . ' .:::~-:~ .. :~~·~:·:·:~·:::~.:·:
' ' . o • o ~ I ' o •
' . ' ... -. . . • ' ' < ~ ' • • • ' • ' • • • • • • • ' ' ' ' . -. . ~ . . . . . . . -. . .
. . . -. . . . ~ . . ' . . . ' ' . .
' ~ ' . ' ' . . . ~ .
EUROPEAN COMMISSION
m
DIRECTORATE-GENERAL FOR AGRICULTUREm
Working Document-....
-
>
..
w
UJ
(.)
. . . .
-. - . ' .
. . . . '
. .
. .
-' . '
' ' a . '
• • • +
. ' '
' ~ . .
. . . ' . ' . .
European Commission
Directorate General for Agriculture (DG VI)
Working Document
Agricultural situation and prospects in the
Central and Eastern European Countries
Slovenia
This report has been prepared by DG VI in close collaboration with Dr. Emil Erjavec, assistant professor of the Biotechnical Faculty of the University of Ljubljana and Dr. Jernej Turk of the Agricultural Institute of Slovenia, and with the help of Professor Maurizio Merlo of Padova University as advisor. Assistance was given by DG II and DG lA.
The production of this report would not have been possible without the valuable cooperation in answering our questions of Ms Irena Oresnik from the Statistical Office of the Republic of Slovenia, of Dr Peter Stanovnik and Mr. Boris Majcen from the Institute for Economic Research and of the staff from the Institute of Macroeconomic Analysis and Development .
The manuscript was prepared by Bruno Buffaria, with the assistance of Eric Willems. The authors accept full responsibility for any errors which could still remain in the text.
CONTENTS
Foreword
. Executive summary
1 - General Overview
1.1 1.2 1.3 1.4 1.5 1.6
Geography, climate and demography
Historical background
Socio-economic background
Macro-economic data
New economic framework
Trade
2 - Agriculture
2.1 Agriculture in the Slovenian economy
2.2 Land use
2.3
2.4
2.5
2.6
Structure of agricultural output
Agricultural production and .consumption
2.41 Arable crops
2.42 Permanent crops and horticulture 2.43 Pasture and meadows
2.44 Livestock
Forestry
Agriculture C;tnd environment
3 -Farm and agri-industry structure
3.1 3.2 3.3 3.4 3.5 Farm structures Production costs Land market
Recent evolution of the "socially owned" and co-operative sectors
Up-stream and down-stream sectors
4- Support system
5- Agriculture trade
5.1
5.2
5.3
Evolution of agricultural trade flows
6 - Outlook, prospects and problem
Annexes
Glossary/ Abbreviations List of tables
Bibliography
Phare assistance to Slovenia's agriculture Composition ofNational Parliament Tables
37
Foreword
The European Union has expressed its intention to offer membership to those countries in central and eastern Europe with which it has an association agreement (see box below). Agriculture has been identified as an important issue for future accession, due to its relative size in some of the Central and Eastern European Countries (CEECs) and to the difficulties there might be in extending the Common Agricultural Policy in its current form to these countries.
A series of ten country reports on the agricultural situation and prospects in the CEECs has been prepared by the services of the European Commission in collaboration with national experts and with the help of scientific advisers. The ten countries covered are Bulgaria, the Czech Republic, Hungary, Poland, Romania and Slovakia, which are associated to the European Union through the Europe Agreements, and Estonia, Latvia, Lithuania and Slovenia, which are in the process of being associated.
The country reports attempt to provide an objective analysis of the current situation in agriculture and the agro-food sector in the CEECs and an assessment of the developments to be expected in the medium term.
The closing date for data was end of April 1995.
Extract conclusions Copenhagen summit of 22-23 June
1993
"The European Council today agreed that the associated countries in Central and Eastern Europe that so desire shall become members of the European Union. Accession will take place as soon as an associated country is able to assume the obligations of membership by satisfying the economic and political conditions required.
Membership requires that the candidate country has achieved stability of institutions guaranteeing democracy, the rule of law, human rights and respect for and protection of minorities, the existence of a functioning market economy as well as the capacity to cope with competitive pressure
and market forces within the Union. Membership presupposes the
About the data ....
The data used in this country report are derived from a CEEC dataset established by DG
VI in cooperation with other services of the European Commission and with external · experts. Data have been selected after a number of analyses carried out by both external
research institutes• and. DG VI services. They originate from various· sources: F AO, OECD, World Bank, United Nations, USDA, national statistics, economic institutes and the European Commission (DG II, Eurostat).
The main objective was to obtain a dataset which was as coherent as possible, offering a good comparability of data.
For the ~gricultural data, the starting point of the analysis was the work carried out by
Prof. Jackson (Institute for Central and East European Studies, Katholieke Universiteit Leuven, Belgium), who compared figures from OECD, FAO and the national statistics of Poland, Hungary, the Czech Republic, Slovakia, Bulgaria and Romania. The conclusion of this study was that the F AO was the most reliable source because these data were
standardized, which was not the case for the two other sources.
Moreover, DG VI services compared FAO and USDA data and although for the crop sector there were no important differences, this was not the case for the animal sector where big discrepancies were apparent. This is due to different methodological approaches and also to different coefficients used to transform live animal weight in carcass weight.
In generai the FAO data for agriculture were used, but for certain countries and/or for certain products, and in particular for the most recent years, the figures were adjusted or replaced by data from other sources, after discussion with country specialists and with F AO statisticians. In such cases, F AO coefficients and standards were used to avoid a break in the time series.
Despite all efforts to create a coherent, reliable and up to date dataset, all figures presented in this report should be interpreted with care. Significant changes in data collection and processing methods have sometimes led to major breaks in historical series as the countries concerned have moved from centrally planned to market economies. One general
impression is, according to some experts1
•2, that these problems may have led to
overestimate the decline in economic activity in general and of agricultural production in particular in the first years of transition, data from 1989 and before being somewhat inflated and data after 1989 underrecording the increase in private sector activity.
1 - M. JACKSON and J. SWINNEN (1995) : A statistical analysis and survey of the current situation
of agriculture in the Central and Eastern European Countries, report to DG I, European Commission.
- W.J. STEINLE (1994) : First Study on Data Collection on '"Visegrad • Countries and ECO
Countries, Empirica Delasasse, Eurostat.
2 S. TANGERMANN and T. jQSUNG (1994): Pre-accession agricultural policies for central Europe
Executive summary
1. The apparent economic importance of Slovenian agriculture is low since it consistently accounts for only 5% of GDP and 10% of employment. Nevertheless, during the phase of accession to independence it played and continues to play an important social buffer role.
2 This role of social absorber (occupation of the unemployed, urban/rural balance) at the time of economic crisis is dependent on the permanence of a land structure where small agricultural holdings are dominant.
3. The development of agriculture is confronted with the following elements: 50% of Slovenia is covered by forest
less th.an 43% of its area is agricultural land of which 70% is in mountainous regtons
at the moment, nearly 80% of the farmers are "part time".
4. In the period before independence, agricultural prices were fixed with respect to the most competitive holdings of the "socially owned" sector. This arrangement did not, paradoxically, lead to changes in agricultural structures and to a conGentration of holdings. This structural inertia can be explained at least partly by the very high percentage of part-time farmers with off-farm income.
5. Confronted with this situation, the Slovenian government intends to encourage the
development of agricultural holdings of a viable economic size. It is unlikely that the land
situation could be resolved by the encouragement of a .practically non-existent agricultural land market. The former "socially owned" holdings represent only 8% of total UAA and the privatization process will return around 50% of this area to its former owners.
6. Measures currently under discussion stress the development of a "multi-purpose agriculture": quality agricultural and food production, safeguarding the environment and landscapes, defence of ground water-tables, promotion of agri-tourism, etc.
7. Even with its proviso of minimal environmental impact, Slovenian agriculture has the potential to greatly increase productivity. Slovenia already has a well-developed extension service which is playing an important role in the modernisation process.
8. It is difficult to predict the outcome of the restructuring and privatization of the food-processing industry from the former "socially owned" sector. But the existence of dynamic and competitive companies will support the development of Slovenian agriculture in the short term, as well as exports of some products (milk, beef, poultrymeat, wine). In effect, the GATT commitments are not constraining, except for poultry, since most exports are unsubsidized.
9. Outlook 2,000. The growth of the Slovenian economy (+5% per year until 2,000) will have a strong impact on both farm structures and on production levels. However, changes in the price hierarchy of different agricultural products will also have an incidence on the production systems of agriculture holdings.
eKRANJ
, ....
14
....
.LJUBLJANA
HPIC1plll
.0.11
Main
economic
figures
of
SLOVENIA
Main
tlvars
and
waterways
•
major
town
(>
30000
Inhabitants)
SOURCE:
Geographical
data
:
EUROSTAT-OISCO
Attribute
data
:
1 General overview
1.1 Geography. climate and demography
Slovenia lies on the south eastern fringes of the Alps at the meeting point of the Alpine range, the Mediterranean and South-East Europe.
With a total area of 20,250 square kilometres, Slovenia is two thirds the size of Belgium. Though the territory is rather small, there is a great variety of natural conditions for agriculture: from Mediterranean, karstic and alpine to subpanonic. Less than 43% of the area (0.86 mio ha) is agricultural land, ofwhich 0.25 mio ha is arable. Forests cover more than 50% of Slovenia, well above the European average, and around 70% of the total agricultural area is in unfavourable hilly and mountainous regions.
Slovenia's climate is quite varied going from sub-mediterranean to alpine (minimum average temperature range: -3°C to +5°C, maximum average temperature range: 17°C to 24°C). Average annual rainfall (1981-90) varies from 800 to 2600 mm, depending on the regton.
The Slovenian population is relatively homogenous. Italian- and Hungarian-speaking minorities represent less than 1% and inhabitants from other former Yugoslavian Republics less than 10%. According to 1994 figures, 1.95 mio people live in Slovenia, with an
average density of 97 per km2 (similar to Austria). More than half the population live in
the countryside; only 2 towns have more than 100,000 inhabitants, Ljubljana (280,000) and Maribor (110,000).
The population has been decreasing slightly for the last three years. Births in 1993 of 10.1 per 1000 (the same as Germany) are 30% lower than the 1980-84 average and 20% lower than the 1985-89 average. Life expectancy is 69.4 years for males and 77.3 years for females "(average 1992-1993), against 67.2 and 75.1 respectively 10 years earlier. Causes of death are mainly circulatory diseases (45%) and cancer (23%).
Of the total population, 69% are of working age, 20% are under working age (15 years) and 11% over the retirement age. The structure of the Slovenian population is a little younger than EUR-15, where the figures are 67%, 18% and 15% respectively. However, if the recent trend continues, the structures will soon be the same. The age structure of family members on the farms is quite similar to that of the overall population.
1.2
Historical background
On the disintegration of the Austro-Hungarian empire, in 1918, the Slovenians joined with Serbia and Croatia to form an independent and single state which acquired the name of Yugoslavia in 1929. Two regions with a Slovenian-speaking population were not integrated into this whole:
a part of Carinthia which became Austrian after a referendum in 1920;
the west of Slovenia ( 400,000 inhabitants) which became Italian after the signature of the treaty ofRapallo with Italy in 1920.
During the Second World War Yugoslavia was occupied by Germany, Italy, Hungary and Bulgaria. This war, which combined the World War, a civil war with ethnic massacres in Bosnia and Croatia, and a national and social liberation war, caused more than 1 million deaths in the Yugoslav population (of about 16 million inhabitants). The resistance of the Yugoslav partisans, which brought together the aspirations of the various Yugoslav peoples, allowed the liberation of the country from nazism without any particular support from the Soviet army. At the end of the war, the communist resistance led by Tito proposed to give birth to a new concept of Yugoslavia: the Yugoslav Federation, whose
constitution of1946 embodied a completely original socialism3
•
Slovenia became one of the six constituent republics of the Yugoslav Federation. The territorial relationship between Italy and Yugoslavia was complicated at a later date when in 1954, following the London treaty, 47 km of coast (including the Koper port) were conceded to Slovenia, while at the same time Trieste remained Italian. A community of around 50,000 Slovenians thus became Italian, whereas lstria, where an Italian speaking community resided, was incorporated into Slovenia and Croatia.
Slovenia was the most prosperous republic of Yugoslavia (it is generally agreed that, with 8.4% of the Yugoslav population, Slovenia contributed 18.2% of the former Yugoslav Federation's GDP) and the most orientated towards Western Europe. The democratization process started after Tito's death and accelerated after 1988, leading to the first free elections in April 1990. These gave rise to the victory of a straight centre coalition (DEMOS) and the election to the presidency of the republic of Milan Kucan, an ex-communist. In a referendum in December 1990 a resounding majority (88%) voted for independence. This was declared on 25 June 1991 and a new constitution adopted on 23 December 1991. All civil freedoms are guaranteed by the Constitution, including freedom of religion and of expression. Since then all Member States of the EU have recognized Slovenia.
After the adoption of the new Constitution, new institutions gradually evolved :
a national Parliament of 90 delegates, democratically elected according to a
3 But neither then, nor later, was the principle ofmulti-partism introduced, even if
proportional system with a minimum threshold of3.4%;
a national Council of 40 members, representing the social and economic sectors as well as local authorities.
The latter assembly has the role of controlling legislative power by means of a suspensive veto (forcing the Parliament to re-discuss and revote) and by the possibility of organizing, under certain conditions, referenda on laws newly approved by the national Parliament.
The elections held on 6 December 1992 confirmed the presidency of Milan Kucan (with 63% of the votes) and led to the formation of a centre-left coalition government, which is still in place at the time of writing (May 1995).
Slovenia aspires to being recognized as a reliable political and economic partner. It has initiated the process enabling it in the long term to become a member of the European Union. At the international level it has been admitted to the United Nations (18 May 1992) and become a member of the Il\1F (14 December 1992) as well as the EBRD (23 December 1992) and the World Bank (25 February 1993). Slovenia is also· one of the signatory countries of the GATT agreement and founder member of the WTO.
1. 3 Socio-economic background
Natural resources are. few (mainly wood and inefficiently exploited hydroelectric potential), so the country's development depends primarily on the skills and training of the
population. Already before independence (arising from the rupture of Yugoslavia)
Slovenia was characterized by two specifics:
a largely open economy, a unique phenomenon for a country with a socialist state
economy. Slovenia was considered the most developed republic of former
Yugoslavia.
a small proportion of its population was drawn from other Yugoslav republics. At the time of independence, it was enough to reside at least 2 years in Slovenia to gain Slovenian citizenship.
Moreover, Slovenia practised the most successful form of market socialism, an experiment very far removed from the authoritarian socialism of the other Central and Eastern European countries. Besides a private sector of micro-enterprises (farmers and craftsmen) there existed forty-six large "socially owned" companies which developed horizontal and vertical integration oftheir economic functions and occupied a major part of the Yugoslav economy.
Neither public-sector organisations, nor private companies, co-operatives nor charities, these economic associations, the "property" of civil society, were directed by managers responsible for the economic health of these groups. They could be composed of several
4 The next elections are planned or autumn 1996. '
fi
hundred companies or establishments. Although these "socially owned" associations had no right to buy others companies, there was always a certain competition among the forty-six. Thus, market forces had at least a limited impact in regulating companies.
The break-up of the Socialist Federation of Yugoslavia in 1991 was the result of the debilitating effect of the adoption at the beginning of the eighties of a project for political centralization and a liberal economic policy, under the influence of the IMF. For Slovenia, it represented the nadir of the economic crisis that had started at the beginning of the 80's. This was certainly the worst crisis Slovenia has faced since the Second World War.
Nevertheless, Slovenia presents numerous assets for the future of its economic development:
a GDP per capita exceeding 7 000 US$ and a GDP per capita at purchasing power parities of9 500 US$ in 1994;
a low level of debt, weighing little on public finance;
the existence of a developed banking system (able to collect savings and to supply loans and credits);
the existence of networks of companies, mainly small and medium enterprises, with autonomous management (Yugoslav "self-management"), which are not dissimilar to those of a capitalist market economy;
experience and knowledge of external trade;
a dynamic economic structure for a long time open and orientated towards the exterior;
a geo-economic situation, at the regional crossroads of economic flows between "East" and "West", favourable to the- development of tourism.
1.4 Macro-economic data
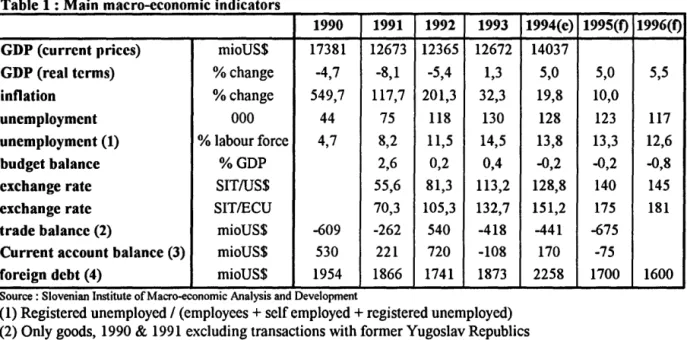
Table 1 :Main macro-economic indicators
1990 1991 1992 1993 1994(e)
GDP (current prices) mioUS$ 17381 12673 12365 12672
GDP (real terms) %change -4,7 -8,1 -5,4 1,3
inflation %change 549,7 117,7 201,3 32,3
unemployment 000 44 75 118 130
unemployment (1) % labour force 4,7 8,2 11,5 14,5
budget balance %GDP 2,6 0,2 0,4
exchange rate SIT/US$ 55,6 81,3 113,2
exchange rate SITIECU 70,3 105,3 132,7
trade balance (2) mioUS$ -609 -262 540 -418
Current account balance (3) mioUS$ 530 221 720 -108
foreign debt (4) mioUS$ 1954 1866 1741 1873
Source : Sloveman Inst1tute of Macro-econom1c Analys1s and Development
(1) Registered unemployed I (employees+ self employed+ registered unemployed)
(2) Only goods, 1990 & 1991 excluding transactions with former Yugoslav Republics
14037 5,0 19,8 128 13,8 -0,2 128,8 151,2 -441 170 2258 1995(t) 5,0 10,0 123 13,3 -0,2 140 175 -675 -75 1700
(3) Goods & non-factor services, 1990 & 1991 excluding transactions with former Yugoslav Republics
(4) Total foreign debt (only allocated debt) without reallocation of the Yugoslav debt
The Slovenian economy, which had entered a period of recession in the early eighties, suffered the full effects of the break-up of the former Yugoslav Federation. GDP fell by 17% in real terms between 1990 and 1992.
The reasons for this decline can be found in the transition process towards a market economy, and the collapse of economic flows in the direction of the other republics of the Yugoslav Federation, as well as the direct and indirect effects of the wars in Croatia and Bosnia.
The beginnings of a tum-around occurred in 1993, although industrial production continued to fall. The real growth rate was 1.3% in 1993, as foreseen by government forecasts. The current growth estimate for GDP is 5.0% for 1994, demonstrating an acceleration of this trend, which should be maintained over the next two years.
Similarly, investment has accelerated since 1993. Gross fixed investment became positive again in 1993, accounting for 18.3% of GDP and marking a growth rate of 12.8%. In 1994 it reached 19.8% ofGDP, corresponding to a growth rate of 15o/o. In 1995 the share of investment in GDP should increase by 1%.
Industrial production {38.1% ofGDP) grew in 1994 (+6.4%) for the first time in 4 years, supported by substantial internal and external demand. Metals, textiles, shoes and chemicals account for 45% of manufactured production. The timber industry and electrical and electronic components constitute the two other important sectors of manufactured goods production.
Accounting for more than 56% of GDP, services assume a leading importance in the Slovenian economy; financial services, trade, transport and communications are the principal sectors.
The growth in tourism is currently more than 9%, but as yet only 75% of the level reached in 1990.
Table 2 : Evolution of GDP
1990 1991 1992 1993 1994(e) 1995(1) 1996(1)
GDP %change -4,7 -8,1 -5,4 1,3 5,0 5,0 5,5
agric GDP %change -1,6 -3,4 -5,9 -3,7 1,6 2,5 3,0
industry GDP %change -10,2 -11,3 -11,6 -2,6 6,4 5,1 5,6
services GDP %change -0,4 -6,3 -1,2 4,0 4,2 5,1 5,9
% agric/GDP % 5,2 5,4 5,3 4,9 4,9 4,7 4,6
o/o industry/GDP % 41,8 44,6 40,5 38,4 38,1 38,8 38,8
o/o services/GDP % 53,0 50,0 54,2 56,7 56,9 56,5 56,6
Source : Sloveman Institute of Macroeconomtc Analysts and Development
The restructuring of companies, which preceded the "privatization" process, resulted in a huge increase in unemployment between 1990 (4.7%) and 1993 (14.5%). However, the
existence of a network of dynamic small and medium enterprises made it possible to contain this phenomenon to a slight fall to 13.8% in 1994. Moreover, the unemployment
rate based on ILO criteria was only 9% in 1994. In addition, the existence of an
underground economy probably results in an over-estimation of the real unemployment rate and/or under-employment. With economic growth and restructuring of companies, this trend towards falling unemployment should continue in 1995 and 1996.
Slovenia already fulfils two of the Maastricht Treaty convergence criteria for participation in Economic and Monetary Union. The public debt accounts for only 30% of GDP and, until recently, the budget deficit was practically non-existent.
Since 1994; however, a small budget deficit has appeared as the consequence of increased budgetary expenditure. Public loans agreed in 1994 increased by 20%. During the last two years {1993, 1994) the rate of public debt has increased sharply and should increase again when the debt of the ex-Yugoslav Federation is distributed between the various Republics (in theory resolved at the meeting of the Paris Club in July 1993). According to some estimates this would have brought the level of the debt to 2,744 Mio US$ at 31.12.94.
Having inherited extremely high inflation at the time of independence (550% in 1990, 117% in 1991, 201% in 1992), an inflation reduction policy brought it down to 3 2% in 1993. However, the declared objective of 13% for 1994 could not be achieved, inflation still reaching 20%. In 1995, inflation may go no lower than 10%.
Nevertheless, monetary policy remains indisputably a success for the Slovenian government. The new Tolar instituted in October 1991 on the basis of 1 Tolar for 1 Dinar appreciated quickly and became convertible, whereas central reserves reached 1200 million US$ at the end of 1992. The Tolar has remained remarkably stable and lost only 5.8% in relation to the ECU in 1994.
After falling for three years, household incomes started to increase again in 1993. This had a strong impact on the revival of household consumption, which grew by more than 10%. In this context, the signature of a social pact between employers and employees, under the government's aegis, had great importance for the control of inflation. This agreement sanctioned the beginnings of an effective decoupling between the increase in wages and the rhythm of inflation. Inflationary tensions are nevertheless ongoing and will be reabsorbed only over several years.
The balance of payments on the current account reflects the deterioration of the economic situation in 1991 and the successive reorientation of economic trade flows (exports of goods, transport and tourism). As from the following year a reconstitution of the central reserves occurred. The weak surplus of 1993 reflected the trade deficit. The balance of payments on the current account thus depends directly on the competitiveness of the service sector. The satisfactory level of the central reserves arises from the low volume of industrial imports. However, this could be called into question either by a loss of relative competitiveness by the Slovenian economy or an increase in imports connected with the modernization of the Slovenien economy.
(3)
ratio on exports of less than 3 8%, Slovenia is in a more favourable situation than the majority of Central and Eastern European countries.
1.5 New economic framework
During the last two years Slovenia has adopted the principal laws (modelled on those of its western neighbours) allowing the economy to be liberalized and a market economy to flourish.
Nevertheless, a law on foreign investment is still in preparation; its adoption is foreseen for 1995. In the same way, the new "Customs Law" and the Combined Nomenclature is in stage of preparation. The new tariff system will align Slovenian external protection on that of the EU. A substantial legislative effort has already been made to adopt a tax system similar to that of EU members. However, value-added tax (VAT) will not be introduced before 1996.
A law on standardization was approved, to allow the adoption of Community standards before the end of 1995, and a coordination office for the integration of the "acquis communautaire" into Slovenian legislation should be operational at the end of 1995.
After a relatively slow start, the modernization programmes of the banking and privatization sectors is advancing apace. In October 1992 the largest companies (including 98 in a loss-making situation) passed under the control of the Agency for Restructuring and Privatization and the Development Fund. By the end of January 1995, 44 of these had been privatized and 15 had been closed down. The others are being restructured, to enable them to be privatized in 1995.
The other companies of the former "socially owned" sector, approximately 2,200 and mainly small and medium enterprises, have all presented their privatization plan to the Agency for Restructuring and the major portion of them should be able to be privatized by the end of 1995.
Thirty-four banks are currently present in Slovenia. The Ljubljanska Banka dominates the landscape, with almost 70% of the market. Far behind is the SKB Banka, a private bank which aims to occupy 15% of the banking market. The remainder of the sector is occupied
by small provincial banks. It should be noted that four foreign banks (three Austrian and
one French) are already installed in Slovenia.
1.6 Trade
Slovenia pursues a very active commercial policy, which led it to conclude free trade agreements with the countries of the Visigrad groups and finally to become a member of
CEFT A, as well as to start negotiations with Romania and the Baltic States.
Slovenia became a member of GATT in September 1994 and was the first of the new
5
The agreement with Poland is still in negotiation.
members of GATT to join the WTO as a founder member.
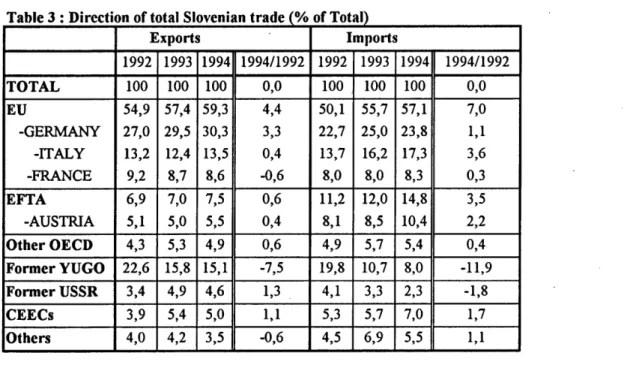
Trade has been entirely reoriented in less than 4 years, the EU replacing the ex-Yugoslav Republics as most important trading partner. The latter now occupies only a secondary .place (15% of total trade). The European Union (EUR 15) accounts for 65% of Slovenian exports and provides the same percentage of imports to Slovenia (65% in 1994). The business sector generally expects only a weak development of trade with the CEEC and ex-Soviet Union, but thinks that a stabilization of the political situation in the Balkans would allow a redirection of trade towards that region.
The commodity structure of imports is dominated by investment goods (machinery and
transport equipment), by intermediate goods and raw materials. Imports (consumer,
intermediate and investment goods) are increasing rapidly and the trade balance for goods alone has been negative since 1993.
The trade surplus, although remaining clearly positive in 1994, is closely dependent on the services sector.
Exports tend to account for more than 50% of the GDP, confirming the degree of openness of the Slovenian economy.
Table 3 : Direction of total Sloven ian trade (o/o of Total)
Exports Imports
1992 1993 1994 1994/1992 1992 1993 1994 1994/1992
TOTAL 100 100 100 0,0 100 100 100 0,0
EU 54,9 57,4 59,3 4,4 50,1 55,7 57,1 7,0
-GERMANY 27,0 29,5 30,3 3,3 22,7 25,0 23,8 1,1
-ITALY 13,2 12,4 13,5 0,4 13,7 16,2 17,3 3,6
-FRANCE 9,2 8,7 8,6 -0,6 8,0 8,0 8,3 0,3
EFTA 6,9 7,0 7,5 0,6 11,2 12,0 14,8 3,5 -AUSTRIA 5,1 5,0 5,5 0,4 8,1 8,5 10,4 2,2 OtherOECD 4,3 5,3 4,9 0,6 4,9 5,7 5,4 0,4 FormerYUGO 22,6 15,8 15,1 -7,5 19,8 10,7 8,0 -11,9 Former USSR 3,4 4,9 4,6 1,3 ' 4,1 3,3 2,3 -1,8
CEECs 3,9 5,4 5,0 1,1 5,3 5,7 7,0 1,7
2
Agriculture
2.1 Agriculture in the Slovenian economy
Agriculture, in the strict meaning of the term, occupies a limited place in the Slovenian economy (4.9% of GDP and 10.7% of employment in 1993) and its relative weight is decreasing. The balance of agrifood trade is traditionally negative. These few macro-economic data do not, however, properly illustrate the significant role played by the whole agrifood sphere of rural Slovenia (agriculture, forestry, food production, rural tourism and other services) in the economy and in the structure of Slovenian society.
T bl 4 I a e : mpo rt ance o agr1cu f . ltu re
1990 1991 1992 1993 1994(e) 1995(f) 1996(f)
GDP %change -4,7 -8,1 -5,4 1,3 5,0 5,0 5,5
agric GDP %change -1,6 -3,4 -5,9 -3,7 1,6 2,5 3,0
industry GDP %change -10,2 -11,3 -11,6 -2,6 6,4 5,1 5,6 senrices GDP %change -0,4 -6,3 -1,2 4,0 4,2 5,1 5,9
share agric/GDP % 5,2 5,4 5,3 4,9 4,9 4,7 4,6
share aglemploym. % 10.7
share agri-food/exp. % 6.4 4.6 4.7
share agri-food/imp. % 8.5 8.1 8.2
Source: Sloveman Inst1tute ofMacroecononuc analys1s and Development
The Slovenian countryside seems to have succeeded in buffering the social tensions created by the economic crisis. Less than a quarter of the population resides in the four towns of more than 3 0 000 inhabitants, and more than half the population resides in rural communes.
Although the agricultural system seems to be changing slowly, Slovenia is actively preparing for the progressive integration of its agriculture and its food industry into a market economy. These macro-economic indicators measure both its degree of harmonization with the European Union and the distance between the two.
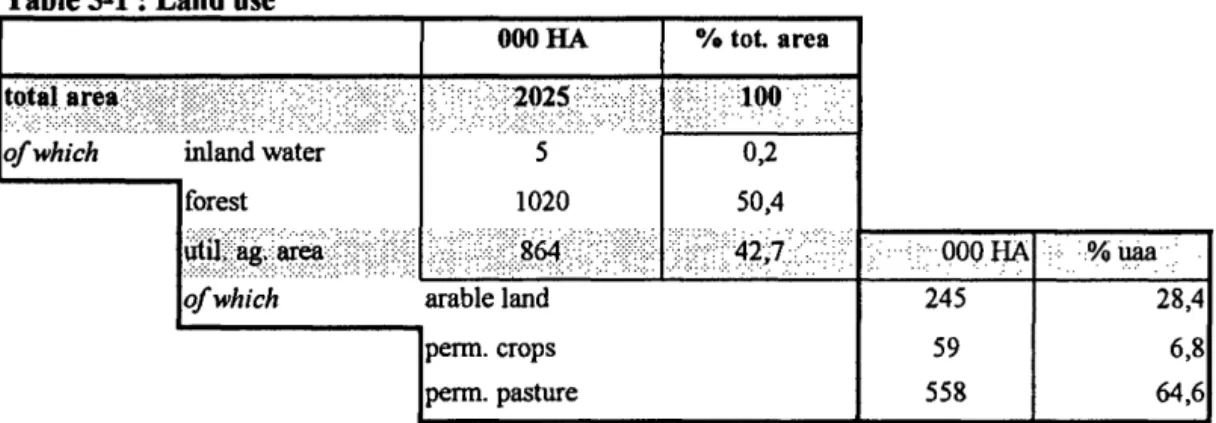
2.2 Landuse
Woods and forests cover more than half the Slovenian territory, with 1,020,000 hectares. Of the 864 000 hectares of agricultural land, more than 70% is located in mountain and hill areas, with almost two-thirds being permanent pasture and less than 30% arable land. These data illustrate the difficult conditions which Slovenian agriculture has to contend with.
Table 5-1 : Land use
OOOHA 0/o tot. area
total·area,'\:}:):(:\:::::::=:::::-:::-:::=-: ····.-.. ,.,., .... : · · · ::i+·l02S:·: ... , . .. 1oo· -·' ..
. :.-:,., ; :.:,:.; .. ,;,;.:,:.;.;:;. ::'.':?:\)/}/:':.: .:::: .. : .. : ·. : :·.: :':":; .::::- .• ·.: :- :·:.-:; :"::::· .. ::·.:,·: .,. ... :. .·'((-::<· .. : : .. :· : ...
of which inland water forest
5
1020
0,2
50,4
~i(·~::'~
.': ': . ·::· ; ..
)::::::-r:r:::;:::::?t~64?:.:·r .. ,,., ... ,. :\-::/:i+.:::47;t;::'::.':'.:::<· ·. · · .. :.:-:: .._ooo.IJA ..
:-:-:-:-:-:-;.::-::.-.:-:: . :- ·<· ... : ...__..-...__----.;----.; ... ._.;.,_----.;..;.;.;...;.;_-t-_ _ _ _ _ _ _ _ r - - - 1
of which arable land 245
penn. crops
penn. pasture
59
558
28,4
6,8
64,6
The use of arable land has been remarkably stable for more than ten years, being almost
exclusively occupied by cereals (50%), fodder (30%) and potatoes (12%). The other
arable crops are of lesser importance in land use terms.
Table 5-2 : Allocation of Arable Area
1989 1990 1991 1992 1993 1994
Annual <:rops OOOha 247 247 246 245 245 245
cereals OOOha 123 123 120 118 120 112
%arable 50,5 50,9 50,0 49,3 50,2 45,7
-wheat OOOha 43 43 42 43 44 42
%cereals 34,3 34,6 34,3 35,2 35,5 38,4
-maize OOOha 65 66 64 62 62 51
%cereals 52,5 52,2 52,2 51,1 50,3 53,6
-barley OOOha 7 7 8 8 9 8
%cereals 5,6 6,0 6,4 6,7 7,4 7,0
%arable 1,0 1,0 1,0 1,0 1,0 0,8
fodder OOOha 72 72 71 71 73 73
%arable 29,1 29,1 28,9 29,0 29,7 29,8
potatoes OOOha 30 30 31 30 29 23
%arable 12,3 12,2 12,5 12,4 11,9 9,4
sugar beet OOOha 4 4 4 3 3 s
%arable 1,4 1,5 1,5 1,3 1,4 2,0
oUseeds OOOha 2 3 2 2 2 3
%arable 0,9 1,1 0,9 0,9 0,8 1,1
dry pulses OOOha 8 7 7 7 5 3
%arable 3,2 2,8 2,8 2,9 2,0 1,2
Pennanent crops
hops OOOha 2 2 2 2 2 2
orchards OOOha 36 36 36 35 35 35
2.3 Structure ofagricultural output
While total agricultural output remained relatively stable between 1989 and 1993, there was a marked shift from the animal to the crop sector. Over the same period Gross Agricultural Output (GAO) was also stable, except for 1992 when it was affected by drought.
T bl 6 St a e
.
.
rue reo agncu ra outpu tu f . ltu I t t1989 1990 1991 1992 1993
GAO vol. index 99,3 103,5 100,4 89,9 97,4
crops vol. index 108,1 106,6 101,8 79,0 100,3 livestock vol. index 96,3 98,4 101,5 92,8 93,6
share crops/GA 0 % 37,8 47,1 49,5 45,6 52,0
share livest.IGA 0 % 62,2 52,9 50,5 54,4 48,0
ag. tools prices 1989 = 100 100 657 1,864 7,641 19,308
chemicals for agr. prices 1989 = 100 100 591 2,267 9,374 19,527
ag. producer prices 1989 = 100 100 799 1,737 5,006 7,148
retail food price 1989 = 100 100 517 1,103 3,370 4,237
agric.production index 1986 = 100 95.7 99.7 99.6 94.1 90.8
Since 1989, input prices have increased much faster than producer prices. This cost-price squeeze will continue in future, mainly due to the increase of input prices. Moreover, the possibility for producer prices to increase is limited, because the upward trend of retail food prices has been - and is - much more gradual than that of producer prices.
2. 4 Agricultural production and consumption
2. 41 Arable crops.
Cereals
The main cereals grown in Slovenia are wheat of bread-making quality, com for animal feed and, to a lesser extent, barley.
T bl 7 1 C a e - : erea s supply a ance I b I
Cereals 1981-85 1989 1990 1991 1992 1993 1994 (e)
area (OOOha) 127 125 123 120 118 120 Ill*
yield (tlha) 3.7 4.3 4.7 4.7 3.6 3.8 5.1
production (OOOt) 475 527 578 558 426 455 564
consumption NA NA NA NA 952 1041
o.w. feed use 221 237 234 206 303 325
exports NA NA NA NA 1 1
imports NA NA NA NA 498 479
self-sufficiency (o/o) 48 54
* The difference of area between 1993 and 1994 is due to a change in methodology
Yields, which increased progressively from 1970 to 1985, increased again by 15% between 1985 and 1990. After 1990, the combined effect of the reorganisation of agriculture and the repeated droughts of 1992 and 1993 led to a standstill in yield progression. Increased yields in 1994, however, show that the upward trend was only briefly interrupted, now averaging 0.1 tlha/year. On the external side, it should be noted that imports are at a level comparable with production.
T bl 7 2 Wh a e - : eat supply a ance I b I
Wheat 1981-85 1989 1990 1991 1992 1993 1994 (e)
area (OOOha) 46 43 43 42 43 44 42
yield (tlha) 3.4 3.9 4.6 4.3 4.2 3.8 4.3
production* (OOOt) 155 167 200 181 178 168 182
conswnption NA NA NA NA 330 307
o.w. feed use** 25 30 27 27 49 50
exports NA NA NA NA 0 0
imports NA NA NA NA 162 140
self-sufficiency (%) 51 59
• Production : almost exclusively for human consumption • • Animal feed use : mainly imported wheat
T bl 7 3 M . a e - : aaze SUPPlY I b I a ance
Maize 1981-85 1989 1990 1991 1992 1993 1994 (e)
area (OOOha) 61 65 66 64 62 62 ' 51
yield (tlha) 4.5 5.0 5.1 5.2 3.4 4.0 6.3
production (OOOt) 278 324 338 336 207 249 325
conswnption NA NA NA NA 453 527
exports NA NA NA NA 1 0
imports NA NA NA NA 205 203
selfsufficiency (%) 55 62
Fodder
The following table gives a summary presentation of the fodder area (72,000 ha) and its location. With the intensification of dairy production systems the production of maize silage is increasing ( +5,000 ha between 1989 and 1992).
Table 7-4 : Structure of fodder crops in Slovenia (1993)
Crops Harvested area o/o Location inSiovenia
Grass and clover 26,258 36% Flat areas, hills
Maize silage 36,358 50% Flat areas, hills
Fodder beet and carrot 6,296 9% North-East flat
Others 3,792 5%
Potatoes
The relative importance of this crop is due to the special nature of Slovenian farms (which produce to a very large extent for own-consumption and/or for direct sales on local · markets) and to the possible dual use of potatoes for animal feed and human· consumption. Much easier to produce, collect and store (without any technical means) than feed grains, they are directly usable for feeding pigs on small holdings. The sharp decrease of potato area (-23% between 1992 and 1994) could be explained by:
the fall in potato prices in 1992
the fall in feed-grain prices in Slovenia due to the liberalisation of imports the on-going specialisation of Slovenian holdings.
But this did not lead to a fall in production. As with cereals, potato yields are on the increase again after the difficulties of 1992-1993, mentioned above.
T bl 7 5 P a e - : otato supply a ance I b I
Potatoes 1981-85 1989 1990 1991 1992 1993 1994
area (OOOha) 33 30 30 31 30 29 23
yield (tlha) 13,9 12,0 13,7 13,8 12,1 12,6 17,5
production (OOOt) 461 365 412 425 368 367 402
consumption NA NA NA NA 378 398
o.w. feed use 73 83 85 74 108 130
exports NA NA NA NA 1 13
imports NA NA NA NA 12 9
self-sufficiency(%) 97 101
Sugar beet and sugar
The area under sugar beet remained relatively stable, despite a cyclical change between 1989 and 1993. The increase in yield was significant between 1985 and 1990 (+29%). Yields peaked during the years '89, '90 and '91 and, though once more on the increase, have not yet reached this level again.
T bl 7-6 S a e : uear supply a ance I b I
Sugar beet 1981-85 1989 1990 1991 1992 1993 1994
area (OOOha) 5 4 4 4 3 3 5
yield (t/ha) 37,7 46,5 45,5 45,1 30,6 37,9 44,4
production (OOOt) 170 164 167 166 97 133 222
Sugar
production (OOOt) 42.0 55.6 49.6 37.0 41.4 44.5
consumption 75.2 72.0 72.0
exports 3.9 2.8 0.2
imports 42.1 33.4 27.7
kg/per capita 37.7 36.1 36.1
selfsufficiency (%) 49 53 62
2.42 Permanent crops and horticulture
The area under permanent crops is mainly represented by hops, grapes for -wine and fruit production. These crops are marginal in terms of utilized area but not in economic terms: hops and wine have an important place in agri-food exports and, along with fruit production, are located on modernised holdings.
Hops
Traditionally produced for export, hop production has been organised since 1945 by the Hop Growers Co-operative Society from the Celje region, where production is located. This specialised co-operative was set up for the purpose of buying-in the hops produced, and their sale on domestic and foreign markets. During the last ten years, the quality of
Slovenian hops has much improved. Exports have always been very important and
represent nine-tenths of production. The USA was the biggest importer of Slovenian hops from 1948 to 1963 (1/3 of annual exports) and after 1963 West Germany took its place.
T bl 8 1 H a e - : ops supply a ance I b I
Hops 1981-85 1989 1990 1991 1992 1993 1994 1995(t) area (OOOha) 2.388 2.489 2.485 2.456 2.398 2.450 2.420 2.400
yield (tlha) 1.66 1.31 1.41 1.53 1.41 1.43 1.44
production (OOOt) 3.959 3.256 3.510 3.771 3.395 3.510 3.500 3.500
consumption 1.021 0.400 0.300 0.300 0.300
exports 2906 2.995 3.210 3.200 3.200
imports
-
-
-
-
-
-
-
-Wine
(4)
T bl 8 2 a e - :
w·
me supply a ance I b IVineyards 1981-85 1989 1990 1991 1992 1993 1994
area (OOOha) 19 20 20 20 20 21 22
yield (tlha) 5.4 4.6 5.6 5.4 6.1 6.2 6.0
production (OOOt) 104 92 112 108 124 128 131
grapes for wine 71 74 76 74 83 93 95
Wine
production (hi) (*) 709 629 769 749 832 877 893
yield (hVha) 36,6 31,8 38,3 37,2 40.6 42.6 40.6
Stock variation 194 47
Utilisation 810 820
Market prod. (hi) 485 506 521 516 554 635 685
exports 150 139
imports 278 123
Vcapita 40.6 41.1
selfsutliciency 108 109
(*) production =market production+ "farm made & consumed" production
Fruit and vegetables
Fruit and vegetable production is relatively marginal, in terms of both area and quantity produced. However, a distinction has to be made between fruit and vegetables. According to the Slovenian Statistical Office, the area planted to vegetables - mostly cabbages, carrots, tomatoes, onions, garlic - represents around 40,000 ha, mainly in small private gardens or on plots belonging to small farmers.
In contrast, the production of fruit - mainly apples, pears and to a lesser extent peaches - is market oriented, located on modernised holdings or holdings in which investments are being made. Production tends to cover consumption and the surplus is exported. The fruit sector has developed and become specialized in the same way as wine production, at least for apples and pears, which are the most important crops.
T bl 8 3 A I a e - : ~pp1e suppl I b I y a ancc
Apples 1981-85 1989 1990 1991 1992 1993 1994
production (OOOt) na 31 36 44 51 52 66
consumption 39 46
exports 13 17
imports 6 5
losses 5 9
kg/capita 19.7 22.9
T bl 8-4 P a e : ear suppl) I b I a ance
Pears 1989 1990 1991 1992 1993 1994
production (OOOt) NA na na 6 9 5 9
consumption 4 6
exports 1 3
imports 1 2
losses 1 1
kg/capita 2.2 3.0
T a e - : eac supply a ance bl 8 5 P h I b I
Peaches 1989 1990 1991 1992 1993 1994
production (OOOt) 6 7 5 7 9 10 11
consumption 14 17
exports 0 0
imports 5 7
losses 1 1
kg/capita 7.1 8.6
2. 43 Meadows and pasture
Meadows and pastures are of great quantitative importance. 310.000 ha of permanent meadows and 248.000 ha of pastures ensure stable fodder production, and occupy a central place in the production system of the small family holding, where mixed
livestock-farming predominates. An increasing transfer of meadows and pastures to forest can be
observed in the alpine region. This loss is only marginally compensated by a more intensive use of other fodder areas, as the clearing of small wooded plots is not authorized.
T a e bl 9 M d : ea ows an pastures d
Hanrested meadows Pastures and others meadows TOTAL
Area 1991 311,543 247,763 559,306
1993 309,002 248,972 557,974
Hay Production 1991 1,282,964 1,598,784
1993 906,569 1,121,252
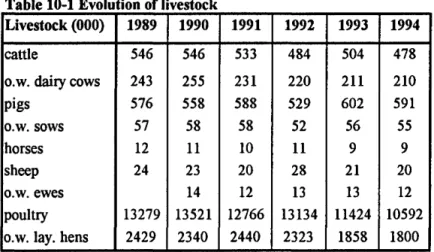
2. 44 Livestock
Table 10-1 Evolution of livestock
Livestock (000) 1989 1990 1991 1992 1993 1994
cattle 546 546 533 484 504 478
o.w. daily cows 243 255 231 220 211 210
pigs 576 558 588 529 602 591
o.w. sows 57 58 58 52 56 55
horses 12 11 10 11 9 9
sheep 24 23 20 28 21 20
o.w. ewes 14 12 13 13 12
poultry 13279 13521 12766 13134 11424 10592 o.w. lay. hens 2429 2340 2440 2323 1858 1800
Red meat producing livestock (cattle) and the poultry sector have both seen big reductions, a result of the collapse of traditional exports to former Yugoslavia. The pig sector shows an opposite trend: the herd is increasing.
Milk and milk products
Between 1989 and 1993, dairy livestock and production decreased (respectively by 13% and 8%), a combined effect of the lost markets of former Yugoslavia and the droughts of 1992 and 1993. This contraction was accompanied by a proportional fall in sales to dairies, which account for only 60% of net milk production. This figure reflects the importance of local sales and of own-consumption on the small individual holding. Milk yield per cow is increasing rapidly and deliveries to the dairies have grown substantially since the beginning of 1994, which suggests that this year marks the reversal of the downward trend. According to the regions, deliveries have increased by between 8% and 12%. Both bacteriological quality and fat protein content show remarkable improvement to levels close to the EU average. This is the result of the new development of specialisation in the dairy sector, a process supported by the extension service. Milk production is traditionally a surplus sector.
T bl 10 2 M.lk a e
-
: I supply a ance I b I1989 1990 1991 1992 1993 1994(e)
Dairy cows (000) 243 255 231 220 211 210
Yield kg/cow 2475 2340 2789 2640 2610 2676
Fluid milk Net production* (000 t) 601 597 643 581 550 562
deliveries 355 354 331 365
consumption 456 486
exports llO 90
imports 17 14
kg/capita 229 244
selfsu1Iuciency (%) 120 116
• Excluding non human consumption (for calves)
The 1991 census showed that 71.000 holdings (45%) had dairy cows, but fewer than 12.500 had a total production higher than 10 000 litres a year. Milk production is not a sector where the big holdings of the former "socially owned" sector occupy an important place (3% of dairy livestock and 8% of production), although here yields are definitely higher than on the individual holdings.
Beef
Beef and veal production is primarily on family holdings, where more than 90% of the herd are located, and in general linked to milk production. Production constraints - soil and weather conditions, the holding's structure and potential profitability - strongly influence the choice of type of farming by the small individual holding, and this especially applies to beef production. The cattle population decreased by more than 12% between 1985 and 1993, and this trend accelerated in 1994. The greater attractiveness of pig production has led to an on-going process of decapitalisation of beef herds on some family holdings.
T bl 10 3 B a e
-
: ee supp f I b I ty a a neeBeef/veal 1989 1990 1991 1992 1993 1994
Cattle (x 000) 546 546 533 484 504 478
slaughters (x 000) 181 214 200 140 149 139
average weight (kg) 275 266 254 272 255 252
production (OOOt) 50 57 51 38 38 35
consumption 40 42
exports 5 4
imports 6 11
kg/capita 20.3 21.4
Pigmeat
T bl 10-4 p· a e
.
.
12 supply a ance I b I1989 1990 1991 1992 1993 1994
Pig numbers (x 000) 576 554 588 529 602 591
slaughters (OOOt) 811 785 731 501 545 558
average weight (kg) 76 79 79 81 86 87
production (x 000) 62 62 58 41 47 48
consumption NA NA NA NA 71 73
exports NA NA NA NA 0 0
imports NA NA NA NA 24 25
kg/capita 36.4 37.6
Pig production illustrates well the structural duality of Slovenian agriculture. The 8 former "socially owned" holdings are responsible for around 45% of production and can produce up to 100. 000 pigs a year. Small holdings fatten about fifteen pigs and, exceptionally, a hundred Two-thirds of this family production supplies subsistence farming or direct sales, only one-third passing through the slaughterhouses to meet the
traditional distribution chains.
While the Ministry tends to encourage pig production on family holdings, rece1wng public finance at subsidized rates is conditional on there being a minimum fodder surface for feeding the pigs and on the existence of a manure area.
Poultry
The drop in poultry numbers and in laying hens (respectively -20% and -25%) has had a direct impact on production : -37% for poultry meat.
This is mainly attributable to the collapse of the former Yugoslav markets.
T bl a e 10 5 P
-
: ou try supp It I b I 1, a ancePoultry 1989 1990 1991 1992 1993 1994
slaughters (Mio) 56 55 53 40 32 28
average weight (kg) 1.3 1.3 1.4 1.4 1.5 1.6
production (OOOt) 73 74 72 55 48 46
consumption 30 33
exports 20 14
imports 2 1
kg/capita 14.9 16.6
hen eggs (OOOt) 24 24 27 26 25 26
Poultry production appears to be even more concentrated than pig production: 90% of poultry meat and more than 60% of eggs come from companies in the "socially owned"
sector. Production is mainly carried out by private farmers with an integrated relationship to that sector. Poultry represents an important source of income for the small farmer. Egg production is orientated towards export, the principal market being Austria.
2.5 Wood and Forests
Forests cover more than half of Slovenia, i.e. 1,020 million hectares. Ownership is both public (38%)- state and local authorities- and private (68%). Small holdings prevail; there are some 290,000 private forest owners of whom around 60% are farmers. The average size ofwoodland property in private ownership is 2.7 hectare, with 85% being smaller than 5 ha and 50% less than 1 ha.
The steady growth in tree stock, as well as the annual increment in timber production, is due to a forest economy based on sustainable management (wood-clearance is forbidden) under public control.
The effect of the woodland restitution process will be a considerable increase in the
number of private owners. Forests are environmentally important and key to the Slovenian eco-system. The wood industry (sawnwood, woodpulp and wood-based panel) depends on the forest sector.
During the eighties, timber consumption in Slovenia was 3. 5 to 3. 8 mio m3 per year, with a
self-sufficiency of 70%. The transition to a market economy and a new state (loss of former Yugoslav markets) has considerably affected the forest sector and the timber industry : the number of workers in forestry has declined and the sawmill industry is being restructured.
T bl 11 E . a e : stamatc d avcra~c annua cuttm~ ~ or t e per10 h . d 1991 2000
-
1000 3' m
Total Coniferous Broad-leaved
Total 3,018 1,732 1,286
State forest 1,323 822 501
Private forest 1,695 910 785
In future, forest resources will continue to be managed in a sustainable way and be the main supplier of a restructured timber industry.
2. 6 Environment and rural areas
The relationship between environment and rural areas is seen as a key issue for the future development of Slovenia.
The main environmental problems deriving from agriculture are confined to the areas producing the pollution. In those areas intensive agriculture is leading to ground water and surface water contamination by pesticides and fertilizers. This specifically applies to large pig holdings and the Celje region, where hops are grown.
Various typical and fragile eco-systems (e.g. karstic region, alpine valleys ... ) have in general been preserved from deterioration.
The Ministry of Agriculture and Forestry is promoting environmentally-friendly agriculture, for example through their program to encourage smaller-scale pig production. Nonetheless, environmental pressures on rural areas exist, mainly due to:
pollution from industrial sites
waste (mainly urban) treatment problems
Surprisingly, Slovenia has one of the highest per capita emission rates in Europe of the key air pollutants, due to the presence of three lignite-fuelled power stations, to the use of lignite for domestic heating, and to badly controlled industrial sources. This air pollution is also causing damage to forests.
An Environmental Protection Act, covering all the aspects of the environment concerned, was adopted in 1993. Now there is an urgent need for the Act to be followed by an Action Plan, defining a programme of activities to ensure that environmental improvement and regulation proceed in an optimal manner.
3 Farm and agri-industry stn1cture
In the immediate post-war period, the former Yugoslavia followed the Soviet-type command economy. This manifested in arrangements being made for a planned official socialist economy and the collectivization of agriculture.
However, the expulsion of Yugoslavia from the Cominform in 1948 led to an institutional reorientation from 1950. Construction began of a new model of decentralized socialist. economy, based on "social property and self-management". In 1953, the collectivization of agriculture was officially given up.
Nevertheless, since 1948, the place of agriculture in the Slovenian economy and society has continued to decline. Its share in employment passed from 54% in 1948 to 10.7% in 1993.
In Slovenia, farms belong either to the private sector - the family farms- or to the former "socially owned" sector - the "socially owned" holdings.
In the upstream and downstream sectors there are co-operatives which are similar to Western European co-operatives and a social sector made up of 'fifty food-processing companies.
3.1 Farm structure
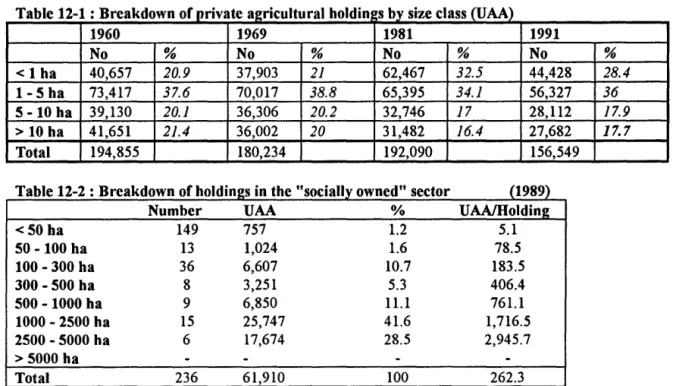
A particular feature of Slovenia is the dualistic land structure, where approximately 90% of the UAA is occupied by small private agricultural holdings and 8% of the UAA is exploited by big "socially owned" farms.
This is the result of the Land Property Law of May 1953, which limited the size of private farms to 10 hectares for arable land (or 15 hectares in other cases). The "socially owned" holdings were especially focused on the main arable crops, hops and intensive animal production (pigs and poultry), whereas private holdings were mostly involved in cattle and dairy production.
Table 12-1 : Breakdown of private aericultural hold in s by size class (UAA)
1960 1969 1981 1991
No % No % No % No %
< 1 ha 40,657 20.9 37,903 21 62,467 32.5 44,428 28.4
1-5 ha 73,417 37.6 70,017 38.8 65,395 34.1 56,327 36
5-10 ha 39,130 20.1 36,306 20.2 32,746 17 28,112 17.9
> 10 ha 41,651 21.4 36,002 20 31,482 16.4 27,682 17.7
Total 194,855 180,234 192,090 156,549
Table 12-2 :Breakdown of holdin2s in the "socially owned" sector (1989)
Number UAA % UAA/Holding
<50ha 149 757 1.2 5.1
50-100 ha 13 1,024 1.6 78.5
100-300 ha 36 6,607 10.7 183.5
300-500 ha 8 3,251 5.3 406.4
500-1000 ha 9 6,850 11.1 761.1
1000-2500 ha 15 25,747 41.6 1,716.5
2500-5000 ha 6 17,674 28.5 2,945.7
> 5000 ha
-
-
-
-Total 236 61,910 100 262.3
The economic development of the private sector was, until 1970, blocked by a combination of elements, in particular :
limited access to the inputs needed for the running of a modem holding (fertilizers, crop protection products and agricultural machinery)
the absence of a market for agricultural land
a poorly-developed training and education system for farmers
the non-existence of a coherent system of remunerative prices for the private sector.
From the seventies, a movement of service cooperatives accessible to the private holdings was developed, alongside the "socially owned" sector. These multi-purpose cooperatives had the primary function of making available fertilizers, pesticides, seeds and new technology to the farmers, as well as organizing the concentration of cereals and milk supplies, running an extension service and distributing subsidized bank loans.
After thirty years of development, the co-operative sector and the "socially owned" sector have assumed a structure more and more comparable to that of the movements of agricultural cooperation in Western Europe. Before independence, approximately 65,000
Slovenian farmers, accounting for half of the U AA, had formed economic links with this
For many of the very small private farms, the income from agriculture is not- and has not been in the past - the main source of income. This is an essential characteristic of Slovenian agriculture, favouring the development of pluriactivity and keeping an important share of the population in rural areas. This balanced rural development, an important aspect of Slovenian society, has played the role of social buffer in certain periods. This role seems to have been very important between 1990 and 1993. As far as the "socially owned" holdings are concerned they were - and still are - clearly more productive than the private farms. In effect, they occupy an important share in apparent economic flows: 30% of the marketed production from less than 8% of the UAA.
After independence a reform of agriculture was launched, with the following main points:
an end to the limitation on the maximum area of farms;
the extension service was split from the co-operative sector and integrated into the Ministry of Agriculture and Forestry, henceforth financed by the Agricultural Budget;
on 30 May 1993 the State Fund for Agricultural Land and Woodland was instituted, to which the land of the "socially owned" sector was transferred;
currently, the Fund rents or grants concessions of land for which it has responsibility; generally the existing occupants are accorded leasing agreements if they can show that they exploit the land suitably. Agricultural holdings pay rent for this land. Nevertheless, after five years, 41% of this land will be returned to
previous owners (i.e. farmers, church, etc.). Almost 59% of the arable land
exploited by the "socially owned" sector will remain in the Fund at the end of the denationalization and privatization process, for which agricultural holdings will continue to pay rent.
The agricultural census of 1991 showed that the average private holding has an area of 5. 9 ha, including 3.2 ha of agricultural land and 2.5 ha of arable land; the average herd is less than five head of cattle or three cows per holding. Less than 12% of farmers depend exclusively on farming for their income.
Any major change in the share of production between private farms and "socially owned" holdings is not yet visible.
The following table shows a comparison between the family farms sector and the former
"socially owned" sector. For a better comparability, only holdings according to the
EUROSTAT definition have been taken into account under the heading "family farms"; the smaller one are registered as "others".
Table 12-3: Comparison of "socially owned" and private sectors (1991- 1993)
FAMILY FARMS SOCIAL SECTOR OTHERS(***)
(*} (**}
FARMS 111951 203
UAA (000 ha) 464 62
% of total UAA 53,8 7,1
Average UAA (ha) 4,1 303,0
Arable land (000 ha) 166 29
% of total Arab. land 67,5 11,9
wheat yield 3,9 5,9
Penn. pasture (000 ha) 279 26
% of total Penn. past. 50,1 4,7
Cattle (000) 434 43
%Cattle 91,0 9,0
Dairy Cows (000) 205,2 6,5
% of Dairy Cows 96,9 3,1
Milk Production (000 hi) 492,6 40,4
% of Milk Production 92,4 7,6
milk yield 2,4 6,2
Pig population (000) 351 241
% Pig population 59,3 40,7
Sheep population (000) 18,8 0,7
% Sheep population 96,3 3,7
Poultry (000) 1206 9386
%Poultry 11,4 88,6
%Hen eggs 39,2 60,8
(*)Family farms according to EUROSTAT definition of agricultural holdings.
(**)Enterprises & cooperatives in socially owned, cooperative and mixed ownership.
337
39,1
50
20,6
253
45,3
(***)Land ownership by other holdings below EUROSTAT standards, alpine pastures, set aside.
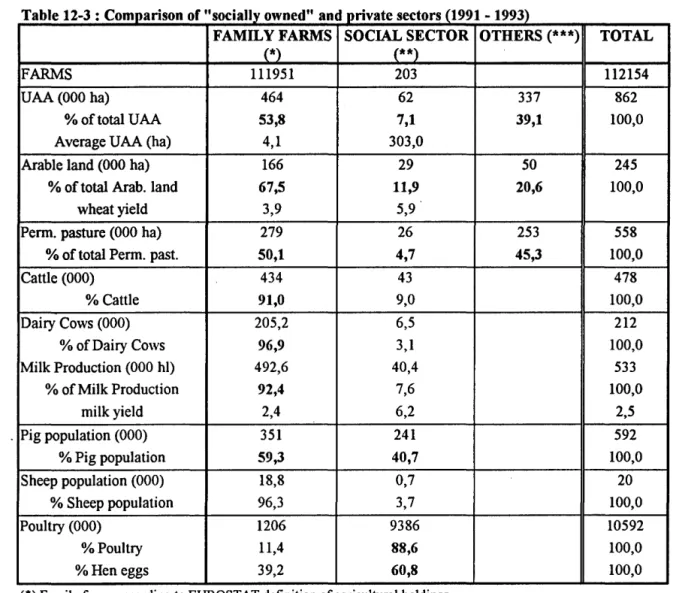
3. 2 Production costs
TOTAL
112154
862
100,0
245
100,0
558
100,0
478
100,0
212
100,0
533
100,0
2,5
592
100,0
20
100,0
10592
100,0
100,0