This is a repository copy of Prediction of alkaline earth elements in bone remains by near infrared spectroscopy.
White Rose Research Online URL for this paper: http://eprints.whiterose.ac.uk/110415/
Version: Accepted Version
Article:
Cascant, Mari Merce, Rubio, S, Gallello, Gianni et al. (3 more authors) (2017) Prediction of alkaline earth elements in bone remains by near infrared spectroscopy. Talanta. pp.
428-434. ISSN 0039-9140
eprints@whiterose.ac.uk https://eprints.whiterose.ac.uk/ Reuse
This article is distributed under the terms of the Creative Commons Attribution-NonCommercial-NoDerivs (CC BY-NC-ND) licence. This licence only allows you to download this work and share it with others as long as you credit the authors, but you can’t change the article in any way or use it commercially. More
information and the full terms of the licence here: https://creativecommons.org/licenses/
Takedown
If you consider content in White Rose Research Online to be in breach of UK law, please notify us by
1 PREDICTION OF ALKALINE EARTH ELEMENTS IN BONE REMAINS BY NEAR INFRARED 1
SPECTROSCOPY 2
Mari Merce Cascant, Sonia Rubio, Gianni Gallello*, Agustín Pastor, Salvador Garrigues and 3
Miguel de la Guardia. 4
Department of Analytical Chemistry, University of Valencia, 5
50 Dr. Moliner Street, research building 6
46100 Burjassot, Valencia, Spain. 7
* Corresponding author 8
9
Abstract 10
An innovative methodological approach has been developed for the prediction of the 11
mineral element composition of bone remains. It is based on the use of Fourier Transform 12
Near Infrared (FT-NIR) diffuse reflectance measurements. The method permits a fast, 13
cheap and green analytical way, to understand post-mortem degradation of bones caused 14
by the environment conditions on different skeletal parts and to select the best preserved 15
bone samples. Samples, from the Late Roman Necropolis of Virgen de la Misericordia 16
street and En Gil street located in Valencia (Spain), were employed to test the proposed 17
approach being determined calcium, magnesium and strontium in bone remains and 18
sediments. Coefficients of determination obtained between predicted values and 19
reference ones for Ca, Mg and Sr were 90.4, 97.3 and 97.4, with residual predictive 20
deviation of 3.2, 5.3 and 2.3, respectively, and relative root mean square error of 21
prediction between 10 and 37%. Results obtained evidenced that NIR spectra combined 22
with statistical analysis can help to predict bone mineral profiles suitable to evaluate bone 23
2 Keywords: NIR, multivariate statistics, alkaline earth elements, buried bones, diagenesis, 25
soil. 26
27
28
1. Introduction 29
Bone is composed of 50 to 70% mineral, 20 to 40% organic matrix, mainly collagen, 5 to 30
10% water, and less than 3% lipids. The mineral content of bone is mostly hydroxylapatite 31
[Ca10(PO4)6(OH)2], with small amounts of carbonate, magnesium, and acid phosphate, with
32
missing hydroxyl groups that are normally present [1]. Under physiologic conditions, 33
hydroxylapatite is the only stable mineral in bones and is composed of 38% of calcium and 34
18% of phosphorous, with trace of sodium (0,6%), magnesium and small amount of other 35
elements [2]. The number of ionic substitutions possible in biological apatite is smaller 36
than in geologic apatites due to the limited number of available elements in the body. 37
Among the substituting ions that are known and/or reported in bone and tooth mineral 38
are F-, Cl-, Na+ , K+ , Fe2+, Zn2+, Sr2+, Mg2+, citrate, and carbonate [3]. 39
Minerals are ingested from food or involuntary absorbed from the environment. Chemical 40
composition of bones mineral is commonly employed to investigate pathologies, nutrition, 41
injuries and other bioarchaeological and forensic issues. 42
The mineral composition of bones can be post-mortem modified by post-depositional 43
processes, called as well diagenesis, and since many decades researchers have been 44
intensively studied these natural mechanisms. Some authors have evaluated post-mortem 45
soil contamination in bones [4-9]. Other authors have studied diagenesis and degradation 46
3 Calcium, oxygen and hydrogen are major constituents of mineral bones as hydroxylapatite 48
[14]. Strontium is a non-essential trace element that competes to replace calcium[15]and 49
has been linked to food consumption habits [16]. The soil composition and environmental 50
conditions play a crucial role in diagenesis, affecting the element concentration of the 51
buried bones. 52
The general aims of this study has been to develop a low cost, clean and fast strategy to 53
understand how post-mortem degradation in bones caused by the environment could 54
affect different skeletal parts and define an approach to select the best preserved bone 55
samples. Therefore, a method for the determination of mineral elements in bone remains 56
has been developed employing Fourier Transform Near Infrared (FT-NIR) spectroscopy by 57
using chemometric tools as principal component analysis (PCA) and Partial Least Square 58
(PLS). Inductively-Coupled Plasma Optical Emission Spectroscopy (ICP-OES) results have 59
been used as reference data to create prediction models. 60
ICP-OES has been commonly used as an accurate procedure to determine mineral 61
elements in soils and bones [17-21]. ICP-OES technique is very useful for multi-element 62
analysis. However it requires a previous sample digestion and dissolution, involving the 63
use of strong acids and providing non-degradable wastes. A green alternative to the 64
aforementioned technique could be infrared (IR) spectroscopy which provides fast 65
spectral acquisition, a cheap acquisition and maintenance cost and a sustainable method, 66
since it does not use reagents and can be employed directly on solid samples. 67
4 tool for the determination of major components of bones and sediments including 69
mineral elements. 70
Fourier Transform infrared (FT-IR) spectroscopy of bones has been used for various 71
applications as collagen determination, bone crystal size, some carbonates and crystalline 72
structure [22-25], and geochemical taphonomy [26] and as screening tool for diagenetic 73
alteration [27, 28]. On the other hand, only few studies have employed NIR for soils [29] 74
and bones analysis [30] in archaeological contexts. 75
76
In the present study, two hundred seventy one samples obtained from at least 78 77
individuals, have been analyzed. Samples belong to adult and young individuals and are 78
from the Late Roman Necropolis of Virgen de la Misericordia Street [19] and en Gil Street 79
[31], both located in the city of Valencia (Spain). The Late Roman burial rite consisted in 80
inhumation. At this sites, the tombs belong to the period from the I century A.D. until the 81
beginning of the V century A.D. 82
Bone samples were collected from femur, tibia, humerus, radius and parietal bones, which 83
were classified as cortical bones, and ribs as spongy bones. Furthermore, bone samples 84
from the outer bone layer and soil samples were analyzed. Outer bone layer samples were 85
obtained from the external bone surface directly in contact with the sediments. Principal 86
Component Analysis (PCA) was applied to identify bone samples with a well preserved 87
elemental composition. Therefore for the first time Partial Least Square (PLS) regression 88
models were built to predict the concentration of calcium, magnesium and strontium in 89
5 91
2. Materials and methods 92
2.1. Sample collection 93
94
Bone samples were collected from 78 different individuals, sampling around 5 cm of each 95
bone and the weight of the collected sample ranged between 15 and 20 grams depending 96
on the type of bone. Bones as femur, tibia, humerus, radius and parietals, mainly 97
98
The first 2 mm of bone directly in contact 99
with the sediments was called external part of bones and was obtained employing a 100
bistoury to scrape. All bones were sampled avoiding the osteometric points, and the 101
sampling was carried out using a cutting toll and a micro spoon spatula. 102
To provide reproducible and comparable results compatible with the sensitivity of the 103
analytical methods employed and so appropriately relate NIR obtained data with the 104
reference method data all samples were previously mineralized in a muffle furnace, 105
(temperature programme employed: I. 30min at 150 oC; II. 1o/min up to 450 oC; III. 24h at 106
450 oC; IV. 30 oC), and pulverized and homogenized withan agate mortar 107
108
A total of 243 samples from Virgen de la Misericordia were analysed. Bone samples were 109
divided in three groups: i) internal part of bones, composed by the internal part of cortical 110
and spongy ones (95 samples), ii) external part of bones, composed by the first external 111
6 in contact with the bones (54 samples). Additionally following the mentioned 113
classification, 28 samples from En Gil internal part of bones (8 samples), external part of 114
bones (10 samples) and sediments (10 samples) were also analyzed. 115
116
2.2. Apparatus and methods 117
F Fourier transform near infrared
118
spectrometer, model Multipurpose Analyzer (MPA) from Bruker (Bremen, Germany), 119
equipped with an integrating sphere was employed. This instrument is equipped with a 120
NIR source, a quartz beamsplitter and PbS detector. For instrumental and measurement 121
control as well as for data acquisition, Opus 6.5 software from Bruker was used. 122
123
References values about the mineral composition of samples were determined by using an 124
Optima 5300 DV ICP-OES Perkin Elmer (Norwalk, CT, USA) equipped with an autosampler 125
AS 93-plus and a cross flow nebuliser. Samples were previously calcinated inside a muffle 126
furnace Biometa Lenton ECF 12145A (Lanera, España) and acid digested using a heating 127
plate Ika C-Mag HS7. 128
129
2.3. Reference method 130
The digestion method was developed modifying the process described by Gallello et al. 131
2013 and 2014 [19] and consisted in addition to 0.5 g of mineralized sample of 1:1 HCl and 132
HNO3 (using 37 % HCl and 69 % HNO and digested in a water bath at
133
7 measure Mg and Sr. Solution (C) was obtained to analyze Ca by diluting 1:2000 solution 135
(A). Concentrations of HCl and HNO3 have been maintained constant in all solutions. A
136
multi-element stock solution containing Ca, Mg and Sr at a concentration of 100 µg ml-1 137
was employed for the preparation of the calibration standards in 50 ml volumetric flasks. 138
To avoid the obstruction of the nebulizer system samples were filtered employing filter 139
paper (WhatmanTM N.1 of 70mm). Concentrations ranging between 0 and 20 µg ml-1 140
were used for Ca, Mg and Sr. Standards were obtained from Sharlab S.L. (Barcelona, 141
Spain). The standard error of readings during the analysis ranged from 0 % to 2 % for the 142
major elements considered. Bone ash NIST 1400 and soil GBW07408 were used as 143
standard reference materials for evaluating the accuracy of the analytical method and Re 144
was used as internal standard. Mineral element content of studied samples, determined 145
by reference method, varied between 72 and 421 mg g-1 for calcium, 998 and 10964 µg g-1 146
for magnesium and, 102 and 2100 µg g-1 for strontium. 147
148
2.4. NIR procedure 149
Pulverized mineralized samples were placed in clear glass vials of 11 mm internal diameter 150
and 25 mm height to directly obtain their NIR spectra by diffuse reflectance in Kubelka 151
Munk units. Spectra were collected between 14000 and 4000 cm-1 by averaging 50 scans 152
and using an optical resolution of 4 cm-1. A background spectrum was acquired before 153
each series, from the closed integrating sphere using the same instrumental conditions 154
than those employed for samples measurement. Three measurements of each sample 155
8 good reliability. The average of the triplicate spectra of each sample was employed for 157
data exploration and to build the chemometric models. 158
159
2.5. Chemometric data treatment 160
Data treatment was carried out using in-house written functions employing Matlab 161
8.3.0.532 (R2014a) from Mathworks (Natick, MA, USA) being employed for Principal 162
Analysis Components (PCA) and Partial least squares (PLS) regression model, the PLS 163
Toolbox 7.5.2 from Eigenvector Research Inc. (Wenatchee, WA, USA). 164
PCA applied to IR spectra was used as data exploration; based on the distance between 165
samples the evaluation of their similarity. PLS models were applied to spectral data to 166
develop prediction models for Ca, Mg and Sr. These calibration models were developed 167
based on the statistically inspired modification of the PLS method (SIMPLS) algorithm 168
[32]. To select the most appropriate sample calibration set, Kennard Stone (KS) 169
algorithm [33] was used, thus selecting a representative subset to ensure training 170
samples spread evenly throughout the sample space. For building the best PLS models, 171
different spectral regions and spectra pre-treatments were tested as multiplicative 172
scatter correction (MSC), standard normal variation (SNV), a Savitzky-Golay first (FD) and 173
second derivative (SD), and mean center (MC) also combination of them. The 174
performance of PLS-NIR models was evaluated according to the root mean square error 175
of cross validation and prediction (RMSECV and RMSEP) values, the coefficient of 176
determination for prediction (R2pred), relative root mean square error of prediction 177
9 ratio between standard deviation (SD) of the prediction set and the RMSEP values [34]. 179
Generally, RPD value greater than 3.0 is considered adequate for analytical purposes with 180
excellent prediction accuracy, between 2.5 and 3.0 implies that the model has a good 181
precision and between 2.0 and 2.5 indicates that the model has an approximate 182
precision. A value for the RPD between 1.5 and 2.0 reveals a possibility to distinguish 183
between high and low values and a RPD 1.5 indicates that the calibration is not usable 184
[35]. T LV -validation
185
using leave one out sample in order to obtain the minimum value of RMSECV. 186
187
3. Results and discussion 188
3.1. FT-NIR spectra 189
Figure 1 shows, in Kubelka Munk units, the averaged NIR spectra of a) internal part, b) 190
external part of bones and c) sediment samples, considered in this study without any data 191
pre-treatment, in the region between 9000 and 4000 cm-1. These sample spectra present 192
differences in the intensity and position of certain bands, but all show absorption bands 193
around 7200 and 5220 cm 1 related to combination vibrations of H O H bend and O H 194
stretch of water. The main difference which presents internal bones is the weak vibration 195
which appear near 4655 cm1 (without a clear assignment) and the absorption near 6977 196
cm-1 assigned to the first overtone of the stretching vibrations of OH group in 197
hydroxyapatite [36], that is higher than in external part of bones. In the case of the 198
sediment samples, the aforementioned band is absent. Additionally, at 5278 cm-1, internal 199
10 related to apatite [30]. On the other hand, in sediment samples it is present a band at 201
7070 cm1 related to the first overtone of the O H stretch vibration in metal O H [37]. 202
Moreover, vibrations bands near of 4530 cm 1 are due to clay minerals, like smectite and 203
illite, and the band at 4265 cm 1 is associated with the contribution of calcite [37], which 204
decreases in intensity in external bone. In the case of internal part of bone samples, the 205
band located at 4265 cm 1 not appears and the band at 4530 cm1 is less intense than in 206
external part of bones. So that, in external part of bones appear typical bands of sediment 207
samples related with metal-OH (7070 cm 1), calcite (4265 cm 1) and clay minerals (4530 208
cm 1), and lower bands of hydroxyapatite (6977 cm1) and apatite (5278 cm 1). 209
Degradation of hydroxyapatite in external part of bones is a great indicator of diagenetic 210
process. Sediments around bones are crucial role to conservation of them, and sediments 211
analysis should be carried out in order to assess their contribution to the modification of 212
the bone chemical composition. 213
214
215
3.2. Data Exploration by PCA 216
Before building the calibration models, PCA was used for exploratory data analysis to 217
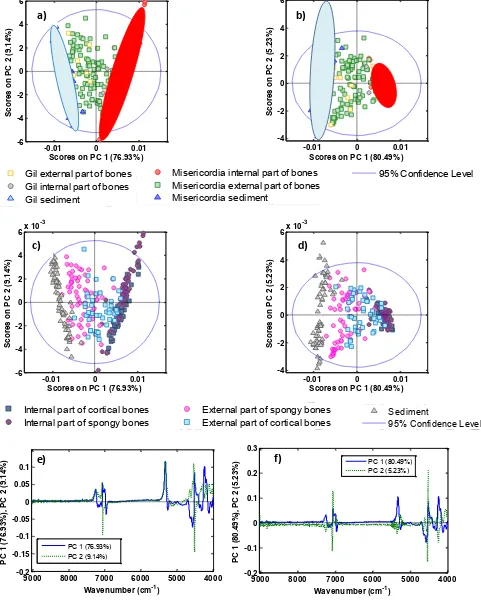
study the spectral differences between considered samples. Figure 2 presents the scores 218
plot for first and the second principal components obtained from PCA for Misericordia and 219
En Gil Necropolis, after a) FD and MC and b) MSC, FD and MC pre-treatment, being 220
selected the region from 9014 to 4000 cm-1. In Figure 2a, the two first principal 221
11 explained variance, being 76.93 and 9.14% for PC1 and PC2, respectively. In the scores 223
plot, there is not a clear-cut grouping of samples, but it can be appreciated that sediment 224
samples spectra are clearly different from those of internal part of bone samples and that, 225
external part of bone samples are located between sediment and internal part of bone 226
ones in the direction of PC1. In Figure 2b, it can be seen that the scores plot for first and 227
the second principal components after MSC, FD and MC pretreatment, represent 85.72% 228
of the explained variance (PC1 corresponds to 80.49% and PC2 corresponds to 5.23% of 229
the variance). It can be seen that internal part of bone samples are located towards the 230
right of the PC1 and sediment samples are dispersed in the left. External part of bone 231
samples are situated between these two groups in the direction of PC1. Moreover, PCA 232
indicates that samples derived from En Gil are similar to Misericordia samples, and 233
because of that samples from Misericordia can be used as calibration set to predict 234
alkaline earth elements in En Gil samples. 235
The aforementioned PCAs were built using differentiated internal and external parts of 236
bones in both, spongy and cortical remains. Figure 2c presents the scores plot after FD and 237
MC and Figure2d after MSC, FD and MC pretreatment. No differences were detected 238
between internal parts of cortical and spongy bones. However if we look at the external 239
part of bones, spongy group is located near to sediment samples, and external part of 240
cortical bones are located close to internal part of bones because spongy tissues are more 241
susceptible to diagenesis than cortical [38] due to the fragility and porosity of their 242
12 identified in the corresponding loading plots (Figure 2e and 2f) with a clear identification 244
of bands around 7000 cm-1 and between 5500 and 4000 cm-1. 245
246
So, it can be concluded that PCA analysis using NIR spectra data provides a fast and green 247
tool to identify changes caused by the environment in bone samples. These results 248
indicate that external part of bones suffer an increased degradation produced by 249
diagenetic factors than internal part of bones, especially in the case of spongy bones 250
external part due to their high porosity. Consequently, conclusions about identification of 251
biogenetic signals using major element ratios could change depending of the bone class 252
evaluated. To avoid mistakes, the use of PCA analysis, as exploratory method, permits a 253
prior selection of samples, not affected by diagenetic processes, to be used in different 254
bioarchaeological and forensic studies involved in bone analyses. Additionally, PCA is a 255
good indicator to test if the calibration set contains the validation samples in order to be 256
used in PLS models without errors due to extrapolation of data. 257
258
3.3. PLS-NIR models 259
To build PLS models, Misericordia samples were divided into a calibration and a validation 260
subset with 183 and 60 objects, respectively, using K-S algorithm for the training set 261
selection, composed by 62 external part of bones, 70 internal part of bones and 51 262
sediment samples. 263
The main characteristics of calibration and validation sets selected for the three elements 264
13 processing strategies were assayed to build the best models and to evaluate their 266
prediction capability. For all elements, regions selected were those between 9014 and 267
4000 cm-1. To build PLS-NIR models using the selected spectral range, 3, 4 and 4 LVs were 268
employed for Ca, Mg and Sr, respectively, in order to minimize the RMSECV, explaining 269
89.1 %, 90.8 % and 88.5 % of the total variance of the X data block and 92.4%, 95.0% and 270
90.4% of the Y data block, respectively. For Ca and Mg, FD with a window of 11 points and 271
a second order polynomial, and MC treatment were adopted as signal pre-processing. For 272
strontium, MSC, FD and MC were chosen. Additionally, concentration data were mean 273
centered as well in all cases. Outliers can be identified by Q residual versus the Hotelling 274
T2 values, being removed 2 samples from the calibration set of Ca, Mg and Sr and 2 275
samples from the validation set of Ca and Sr and only one sample of Mg, prior to do the 276
calculations and validation of the final PLS models for those elements. Figure 3a shows the 277
regression between PLS-NIR predicted values for Ca, Mg and Sr and those obtained by the 278
reference ICP-OES method. It can be seen that calibration and validation sample points 279
were closely distributed near the optimum regression line between predicted and 280
measured values for the three elements, obtaining high coefficients of determination for 281
calibration (R2cal), cross validation (R2CV) and prediction (R2pred) in all elements. The 282
prediction capability of PLS-NIR models were good for all elements, obtaining RRMSEP 283
values of 10%, 15% and 19% for calcium, magnesium and strontium, respectively. The 284
most important calibration and validation parameters of the developed PLS-NIR models 285
are summarized in Table 2. 286
14 It can be seen that samples of internal part of bones contain higher calcium (368 ± 24 mg 288
g-1) and strontium (1306 ± 235 µg g-1) levels and lower magnesium content (1393 ± 175 µg 289
g-1) than external parts (with 261 ± 47 mg g-1of Ca, 844 ± 203 µg g-1 of Sr and 5599 ± 1684 290
µg g-1 of Mg) and sediment samples (with 133 ± 17 mg g-1of Ca, 239 ± 60 µg g-1 of Sr and 291
8165 ± 858 µg g-1 of Mg). As aforementioned, in physiologic conditions, hydroxylapatite is 292
composed of 38 % Ca, with traces of Mg and small amounts of other elements like Sr, 293
indicating that internal part of bones are intact looking at Ca values that are around 294
the38%. Mg enrichment in external part of bones indicates that this element is probably 295
incorporated into the bones from sediments during diagenesis process. 296
External part of bones, especially in the case of spongy bone remains are more sensitive to 297
diagenetic processes caused by the environment indicating that degradation not affects in 298
the same extent different skeletal parts. Due to the fact that spongy bones have higher 299
porosity and thinner cortex than cortical bones, the first type is less resistant to diagenetic 300
factors suffering chemical changes. 301
302
Results obtained by PLS-NIR models indicated that NIR spectroscopy has a good potential 303
to predict alkaline earth elements content in bone remains. As mentioned this method has 304
many advantages over the conventional employed analytical techniques because it is 305
quick, inexpensive, non-destructive for pulverized samples and does not require the use of 306
chemical reagents nor solvents. 307
308
15 To evaluate the PLS-NIR prediction capability of models built to predict Ca, Mg and Sr 310
concentrations in bones and sediments, an independent validation set, not employed 311
during the calibration step, was used. For this propose external part, internal part of 312
bones and sediment samples of En Gil Necropolis were used as external set. The mean, 313
concentration range and standard deviation for the concentration of analysed elements 314
employed for prediction set are summarized in Table 1. Predicted values of the analytes 315
versus those obtained by the reference methods are shown in Figure 3b and the most 316
important calibration and prediction parameters of the developed NIR-PLS models are 317
summarized in Table 2. Acceptable RRMSEP values were obtained for calcium and 318
magnesium with 15% and 11%, respectively, and for strontium a value of 37% was 319
obtained, with correlation coefficients of 90.4, 97.4 and 97.4, and RPD values of 3.2, 5.33 320
and 2.3, respectively. These results demonstrate a good predictive capability of the PLS-321
NIR models developed to evaluate alkaline earth elements in bones and sediment 322
samples. 323
324
Furthermore it must be indicated the PLS models were made from bone samples of 325
different origin, and date of those of the training set, confirming the feasibility of our 326
innovative methodological proposal for the evaluation of alkaline earth elements in 327
archaeological remains. 328
329
The obtained results indicate a good predictive capability for Mg in samples that not 330
16 37%, respectively, being thus limited as a screening tool. Especially for Sr the high relative 332
error of 37% is probably due to the lower levels of this element found in some samples 333
not compatible with the sensitivity of NIR. 334
335
336
4. Conclusions 337
Fourier Transform Near Infrared (FT-NIR) provides a fast, cheap and green analytical 338
method for the prediction of the content of calcium, magnesium and strontium in buried 339
bone and sediment samples, and it could be very useful to understand post-mortem 340
changes of bones caused by the environment which can affects different skeletal parts 341
and for selecting bone samples with well preserved biogenetic signals. PCA has shown that 342
the alkaline earth element profile of bone and soil samples, as expected, is clearly 343
different. Furthermore the external surface of spongy bones is more similar to the soils 344
than to the surface of cortical bones. This confirm that the outer bone layer of spongy 345
bones is more altered than the cortical surface and the presence of Ca, Mg and Sr is 346
similar to that of soil samples of the studied sites. Therefore it can be concluded that 347
environmental factors have a main impact on spongy tissues, which are more susceptible 348
to diagenetic processes, than on the cortical bones. It is indicated in the NIR spectra by the 349
loss of apatite band (the main bone compound) and the presence of clay bands especially 350
on spongy bone surface. 351
A milestone in the study of bone remains is settled in this work by the development of 352
17 and Sr contents in bones remains and soils samples. Ca and Sr contents were found to be 354
higher in the internal part of bone samples, opposite to Mg contents that were higher in 355
the external bone surface and soils, and lower in internal part of bones. Our developed 356
methodological approach combines NIR spectroscopy and statistical analysis and this 357
allowed us to predict bone alkaline earth mineral composition opening a new perspective 358
for the identification of better preserved samples in bioarchaeological studies and forensic 359
science investigations. 360
Regarding the limitations of the study it must be noticed that it was based only on the 361
mineral part of skeletal remains which were treated thermally and pulverized before 362
measurements thus losing information from the organic part of bones and soils. 363
Additionally, the lack of sensitivity of NIR spectroscopy seriously affected the capability of 364
these measurements to be employed for trace element determination and just important 365
elements present as major components of bones, like Ca, Mg and Sr could be determined. 366
367
Acknowledgements 368
Authors acknowledge the financial support of Generalitat Valenciana (Project PROMETEO 369
II/2014/077) and Ministerio de Economia y Competitividad-Feder (Projects CTQ 2014-370
52841-P and CTQ 2012-38635). M.C acknowledges the FPI grant (BES-2012-055404) 371
provided by the Ministerio de Economia y Competividad of the Spanish government. 372
The authors would like to thanks all the students of Chemistry and Archaeology which 373
have contributed to the realization of this study. 374
18 376
References 377
[1] B. Clarke, Normal bone anatomy and physiology, Clin. J. Am. Soc. Nephrol. 3 (2008) Suppl 3, 378
S131 139. 379
[2] J. Burton, Bone chemistry and trace element analysis. in M.A. Katzenberg, S.R. Saunders 380
(Eds.) Biological anthropology of the human skeleton. 2nd ed. John Wiley & Sons, Inc., 381
Hoboken, NJ (2008) 443 460. 382
[3] B. Wopenka and J. D. Pasteris, A mineralogical perspective on the apatite in bone, Mater. Sci. 383
Eng. C, 25 (2005) 131 143. 384
[4] R. E. M. Hedges and A. R. Millard, Bones and Groundwater: Towards the Modelling of 385
Diagenetic Processes, J. Archaeol. Sci., 22 (1995) 155 164. 386
[5] R. E. M. Hedges, Bone diagenesis: an overview of processes, Archaeometry, 44 (2002) 319 387
328. 388
[6] W. Querido, A. L. Rossi, and M. Farina, The effects of strontium on bone mineral: A review on 389
current knowledge and microanalytical approaches, Micron, 80 (2016), 122 134. 390
[7] J. B. Lambert, L. Xue, and J. E. Buikstra, Inorganic analysis of excavated human bone after 391
surface removal, J. Archaeol. Sci., 18 (1991) 363 383. 392
[8] F. Donald Pate and J. T. Hutton, The Use of Soil Chemistry Data to Address Post-mortem 393
Diagenesis in Bone Mineral, J. Archaeol. Sci., 15 (1988) 729 39. 394
[9] J. Zapata, C. Pérez-Sirvent, M.Martínez-Sánchez, and P. Tovar, Diagenesis, not biogenesis: 395
Two late Roman skeletal examples,Sci. Total Environ., 369 (2006) 357 368. 396
[10] I. Reiche, L. Favre-Quattropani, Calligaro, T. J. S., H. Bocherens, L. Charlet, M. Menu, Trace 397
element composition of Archaeological Bones and postmortem alteration in the burial 398
environment. Nuclear Instruments and Methods. Physics Research B 150 (1999) 656-662. 399
[11] I. Reiche, L. Favre-Quattropani, C. Vignaud, H. Bocherens, L. Charlet, M. Menu, A multi-400
analytical study of bone diagenesis: the Neolithic site of Bercy (Paris, France). Meas. Sci. 401
Technol. 14 (2003)1608-1619. 402
[12] T.H. Schmidt-Schultz, M. Schultz, Intact protein molecules in archaeological bones Bone 403
matrix as a treasure chest of ancient diseases and living conditions. American Journal of 404
Physical Anthropology. Annual Meeting Issue l999, Wiley-Liss, p. 230. 405
[13] T. A. Surovell and M. C. Stiner, Standardizing Infra-red Measures of Bone Mineral 406
Crystallinity: an Experimental Approach, J. Archaeol. Sci., 28(2001) 633 642. 407
[14] F. Ignac, G. Gopinath, and V. der W. Hans, Radionuclide and Hybrid Bone Imaging. Springer 408
19 [15] M. L. Carvalho and A. F. Marques, Diagenesis evaluation in Middle Ages human bones using 410
EDXRF, X-Ray Spectrom., 37 (2008) 32 36. 411
[16] D. Guimarães, A. A. Dias, M. Carvalho, M. L. Carvalho, J. P. Santos, F. R. Henriques, F. Curate, 412
and S. Pessanha, Quantitative determinations and imaging in different structures of buried 413
human bones from the XVIII-XIXth centuries by energy dispersive X-ray fluorescence 414
Postmortem evaluation, Talanta, 155 (2016) 107 115. 415
[17] G. Gallello, J. Kuligowski, A. Pastor, A. Diez, and J. Bernabeu, Biological mineral content in 416
Iberian skeletal cremains for control of diagenetic factors employing multivariate statistics, J. 417
Archaeol. Sci., 40(2013) 2477 2484. 418
[18] A.-F. Maurer, M. Gerard, A. Person, I. Barrientos, C. R. del, V. Darras, C. Durlet, V. Zeitoun, M. 419
Renard, and B. Faugère, Intra-skeletal variability in trace elemental content of Precolumbian 420
Chupicuaro human bones: The record of post-mortem alteration and a tool for palaeodietary 421
reconstruction, J. Archaeol. Sci., 38 (2011) 1784 1797. 422
[19] G. Gallello, J. Kuligowski, A. Pastor, A. Diez, and J. Bernabeu, Chemical element levels as a 423
methodological tool in forensic science, J Forensic Res, 6 (2014) 1000264. 424
[20] A.-F. Maurer, A. Person, T. Tütken, S. Amblard-Pison, and L. Ségalen, Bone diagenesis in arid 425
environments: An intra-skeletal approach, Palaeogeogr. Palaeoclimatol. Palaeoecol., 416 426
(2014) 17 29. 427
[21] S. Dal, L. Maritan, D. Usai, I. Angelini, and G. Artioli, Bone diagenesis at the micro-scale: Bone 428
alteration patterns during multiple burial phases at Al Khiday (Khartoum, Sudan) between 429
the Early Holocene and the II century AD, Palaeogeogr. Palaeoclimatol. Palaeoecol., 430
416(2014) 30 42. 431
[22] S. W. Keenan, A. S. Engel, A. Roy, and G. Lisa Bovenkamp-Langlois, Evaluating the 432
consequences of diagenesis and fossilization on bioapatite lattice structure and composition, 433
Chem. Geol., 413 (2015) 18 27. 434
[23] C. N. Trueman, K. Privat, and J. Field, Why do crystallinity values fail to predict the extent of 435
diagenetic alteration of bone mineral?, Palaeogeogr. Palaeoclimatol. Palaeoecol., 266 436
(2008)160 167. 437
[24] T. J. U. Thompson, M. Islam, K. Piduru, and A. Marcel, An investigation into the internal and 438
external variables acting on crystallinity index using Fourier Transform Infrared Spectroscopy 439
on unaltered and burned bone, Palaeogeogr. Palaeoclimatol. Palaeoecol., 299(2011) 168 440
174. 441
[25] T. J. U. Thompson, M. Islam, and M. Bonniere, A new statistical approach for determining the 442
crystallinity of heat-altered bone mineral from FTIR spectra, J. Archaeol. Sci., 40 (2013) 416 443
422. 444
[26] G. Iliopoulos, N. Galanidou, S. A. Pergantis, V. Vamvakaki, and N. Chaniotakis, Identifying the 445
geochemical taphonomy of the osteological material from Katsambas rockshelter, J. 446
20 [27] L. E. Wright and H. P. Schwarcz, Infrared and Isotopic Evidence for Diagenesis of Bone Apatite 448
at Dos Pilas, Guatemala: Palaeodietary Implications, J. Archaeol. Sci., 23 (1996) 933 944. 449
[28] D. Alfano, A. R. Albunia, O. Motta, and A. Proto, Detection of diagenetic alterations by 450
Spectroscopic Analysis on Archaeological Bones from the Necropolis of Poseidonia 451
(Paestum): A case study, J. Cult. Herit., 10 (2009) 509 513. 452
[29] J. Linderholm and P. Geladi, Classification of archaeological soil and sediment samples using 453
near infrared techniques, NIR News, 23 (2012) 6. 454
[30] D. Thomas, C. McGoverin, A. Chinsamy, and M. Manley, Near infrared analysis of fossil bone 455
from the Western Cape of South Africa, J. Infrared Spectrosc., 19(2011) 151. 456
[31] G. Gallello, S. Silvia, J. Kuligowski, B. Fulvio, M. Francesco, and P. Agustín, Variación química 457
intraesquelética relacionada con la diagénesis en los restos óseos de c/ en Gil (Valencia), 458
SAGVNTVM, 47 (2015) 175 186. 459
[32] S. de Jong, SIMPLS: An alternative approach to partial least squares regression, Chemom. 460
Intell. Lab. Syst., 3 (1993) 251 263. 461
[33] R. W. Kennard and L. A. Stone, Computer Aided Design of Experiments, Technometrics, 11 462
(1969) 137 148. 463
[34] P.C. Williams, D. Sobering, How do we do it: A brief summary of the methods we use in 464
developing near infrared calibrations, A.M.C. Daves, P.C. Williams (Eds.), Near infrared 465
spectroscopy: The future waves, NIR Publications, Chichester, UK (1995) 185 188. 466
[35] W. Saeys, A. M. Mouazen, and H. Ramon, Potential for Onsite and Online Analysis of Pig 467
Manure using Visible and Near Infrared Reflectance Spectroscopy, Biosyst. Eng., 91(2005) 468
393 402. 469
[36] Y. Ning, J. Li, W. Cai, and X. Shao, Simultaneous determination of heavy metal ions in water 470
using near-infrared spectroscopy with preconcentration by nano-hydroxyapatite, 471
Spectrochim. Acta. A. Mol. Biomol. Spectrosc., 96 (2012) 289 294. 472
[37] V. Aranda, A. Domínguez-Vidal, F. Comino, J. Calero, and M. J. Ayora-Cañada, Agro-473
environmental characterization of semi-arid Mediterranean soils using NIR reflection and 474
mid-IR-attenuated total reflection spectroscopies, Vib. Spectrosc., 74 (2014) 88 97. 475
[38] J.B. Lambert, S.M. Vlasak, A.C. Thometz, J.E. Buikstra, A comparative study of the chemical 476
analysis of ribs and femurs in Woodland population, American Journal of Physical 477
Anthropology 59 (1982) 289-294. 478
Graphical Abstract
4000 5000
6000 7000
8000 9000
0.20 0.25 0.30 0.35 0.40 0.45
Wavenumber (cm-1)
K
u
b
e
lk
a
M
u
n
k
Internal bone
100 200 300 400
100 200 300 400
Ca measured (mg g-1)
C
a
p
re
d
ic
te
d
(
m
g
g
Table 1. Concentration ranges of determined mineral elements in calibration, validation and
prediction data sets
Analyte Set Samples Range Mean value SD
Calcium (mg g-1)
Calibration
181 96 - 421 260 100
Magnesium (µg g-1) 181 1050 - 10500 4967 3091
Strontium (µg g-1) 181 153 - 2100 823 486
Calcium (mg g-1)
Validation
58 72 - 400 312 76
Magnesium (µg g-1) 59 1070 - 8500 3226 2545
Strontium (µg g-1) 58 124 - 2010 1058 405
Calcium (mg g-1)
Prediction
26 112 - 421 233 114
Magnesium (µg g-1) 26 998 - 10964 6723 3864
Strontium (µg g-1) 26 102 - 1350 518 442
[image:23.612.80.543.152.368.2]Table 2. Description of the best PLS-NIR models employed for the determination of Ca, Mg and Sr and their main figures of merit.
LV: number of latent variables
RMSEC: Root mean square error of calibration;RMSECV:Root mean square error of cross validation; RMSEP: Root mean square error of
prediction; RRMSEP: Relative root mean square error of prediction; R2 Cal: coefficient of determination of calibration; R2 CV: coefficient
of determination of cross validation; R2 Pred: coefficient of determination of prediction.
Misericordia samples en Gil samples
Element Pre-process LV RMSEC R2 Cal RMSECV R2 CV RMSEP R2 Pred RRMSEP (%) RPD RMSEP R2 Pred Slope Intercept Bias RRMSEP (%) RPD
Calcium
(mg g-1) FD, MC 3 27.5 92.4 29.0 91.6 31.7 83.4 10.2 2.4 35.6 90.4 0.8299 41.4 1.7 15.3 3.2
Magnesium
(µg g-1) FD, MC 4 686.3 95.0 750.2 94.1 496.6 96.3 15.4 5.1 723.7 97.3 0.9504 246.2 -81.3 10.8 5.3
Strontium
4000 5000
6000 7000
8000 9000
0.35 0.40 0.45 0.50
Wavenumber (cm-1)
K
u
b
e
lk
a
M
u
n
k
Sediment
4000 5000
6000 7000
8000 9000
0.25 0.30 0.35 0.40 0.45 0.50
Wavenumber (cm-1)
K
u
b
e
lk
a
M
u
n
k
external part of bone
4000 5000
6000 7000
8000 9000
0.20 0.25 0.30 0.35 0.40 0.45
Wavenumber (cm-1)
K
u
b
e
lk
a
M
u
n
k
[image:25.612.99.458.45.624.2]Internal part of bone
Figure 1. Averaged NIR spectra of mineralized bone and sediment samples comparing a) internal
part, b) external part, and c) sediment samples. Note: Spectra were in Kubelka Munk units in the region between 9000 and 4000 cm-1.
a)
b)
-0.01 0 0.01 -6 -4 -2 0 2 4 6x 10
-3
Scores on PC 1 (76.93% )
S c o re s o n P C 2 ( 9 .1 4 % )
-0.01 0 0.01
-4 -2 0 2 4 6x 10
-3
Scores on PC 1 (80.49% )
S c o re s o n P C 2 ( 5 .2 3 % ) 4000 5000 6000 7000 8000 9000 -0.2 -0.15 -0.1 -0.05 0 0.05 0.1
Wavenumber (cm-1)
P C 1 ( 7 6 .9 3 % ), P C 2 ( 9 .1 4 % )
PC 1 (76.93%)
PC 2 (9.14%)
Figure 2. PLS scores and loadings graphs obtained after different spectra treatments. Score plots
according Misericordia and En Gil Necropolis sample classification after: a) FD and MC, and b)
MSC, FD and MC pretreatment. Score plots on considering the bone parts after: c) FD and MC, and
d) MSC, FD and MC pretreatment. Loadings of PC1 and PC2 after: e) FD and MC, f) MSC, FD and MC pretreatment. 4000 5000 6000 7000 8000 9000 -0.2 -0.1 0 0.1 0.2 0.3
Wavenumber (cm-1)
P C 1 ( 8 0 .4 9 % ), P C 2 ( 5 .2 3 %
) PC 1 (80.49%)
PC 2 (5.23%)
a) b)
-0.01 0 0.01
-6 -4 -2 0 2 4 6x 10
-3
Scores on PC 1 (76.93% )
S c o re s o n P C 2 ( 9 .1 4 % ) c)
-0.01 0 0.01
-4 -2 0 2 4 6x 10
-3
Scores on PC 1 (80.49% )
S c o re s o n P C 2 ( 5 .2 3 % ) d)
External part of cortical bone Sediment
95% Confidence Level Gil sediment
95% Confidence Level Misericordia internal part of bones
Misericordia external part of bones Misericordia sediment
Gil external part of bones Misericordia sediment
Gil external part of bones Gil internal part of bones Gil sediment
95% Confidence Level
Internal part of cortical bones Internal part of spongy bones
Internal part of spongy bones External part of spongy bones External part of cortical bones Sediment
[image:26.612.66.547.31.632.2]0 500 1000 1500 2000 0 500 1000 1500 2000
Sr measured (µg g-1)
[image:27.792.0.792.17.483.2]S r p re d ic te d (µ g g -1 )
Figure 3. Regression between predicted and reference values obtained for the PLS-NIR determination of calcium, magnesium and strontium in
bone remains and sediments
100 200 300 400
100 200 300 400
Ca measured (mg g-1)
C a p re d ic te d ( m g g -1 )
100 200 300 400
100 200 300 400
Ca measured (mg g-1)
C a p re d ic te d ( m g g -1 )
0 500 1000 1500 2000
0 500 1000 1500 2000
Sr measured (µg g-1)
S r p re d ic te d (µ g g -1 )
0 2000 4000 6000 8000 1000012000
0 2000 4000 6000 8000 10000 12000
Mg measured (µg g-1)
M g p re d ic te d (µ g g -1 )
2000 4000 6000 8000 10000 12000 2000 4000 6000 8000 10000 12000
Mg measured (µg g-1)
M g p re d ic te d ( µ g g -1 ) 1:1 Fit sediment calibration set
internal part of bone validation set
external part of bone validation set
sediment validation set
sediment calibration set
internal part of bone prediction set internal part of bone calibration set
external part of bone calibration set
sediment calibration set
sediment prediction set
external part of bone prediction set 1:1