The Aboriginal population of Alice Springs : a demographic study
Full text
Figure

Outline
Related documents
Darwin: Situation of the Royal Darwin Hospital receiving all admissions from the Darwin Health Region (green in Northern Territory map) and high risk referrals from adjacent
6 Aboriginal Medical Services Alliance of the Northern Territory, Submission No 59 to the Senate Community Affairs Legislation Committee, Parliament of Australia, Social
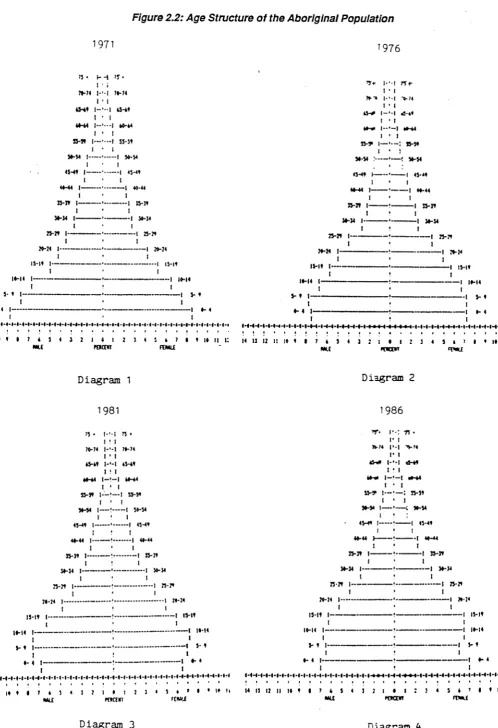
The age distribution of the Aboriginal population was markedly different [2.7% $ 65 years of age, non-Aboriginal 10.7%], and comparable utilisation rates were obtained after
This paper tries to compare the demographic parameters between the National Census years 2001and 2011 and to find growth rate, sex ratio, percentage change of population
: Challenges and strategies for cohort retention and data collection in an indigenous population: Australian Aboriginal Birth Cohort. BMC Medical Research Methodology 2014
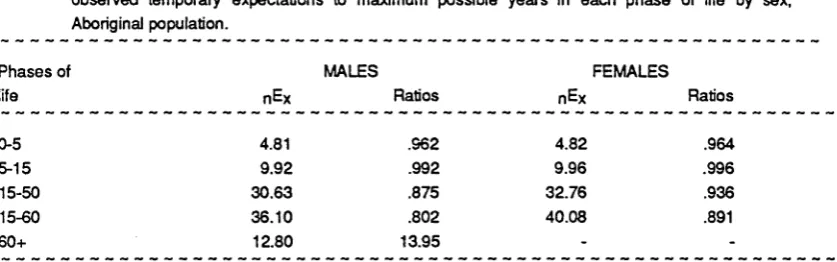
It follows that, if the sex ratio at birth is known, the sex ratio of the population at time t can be estimated from two factors: (i) the ratio of male to female survivorship for
title “ Potentially avoidable, ambulatory care sensitive and non-avoidable hospitalisation admission rates (2000 – 2013) in a population cohort of Aboriginal and non-Aboriginal
For the state and territory population estimates, the distribution of people in same-sex relationships recorded by the 2016 Census is assumed to match the distribution of the
