White Rose Research Online URL for this paper: http://eprints.whiterose.ac.uk/129434/
Version: Accepted Version
Article:
De Simoni, C. and von Bastian, C.C. (2018) Working memory updating and binding training: Bayesian evidence supporting the absence of transfer. Journal of Experimental Psychology: General, 147 (6). pp. 829-858. ISSN 0096-3445
https://doi.org/10.1037/xge0000453
©American Psychological Association, 2018. This paper is not the copy of record and may not exactly replicate the authoritative document published in the APA journal. Please do not copy or cite without author's permission. The final article is available, upon publication, at: http://psycnet.apa.org/doi/10.1037/xge0000453
[email protected] https://eprints.whiterose.ac.uk/ Reuse
Items deposited in White Rose Research Online are protected by copyright, with all rights reserved unless indicated otherwise. They may be downloaded and/or printed for private study, or other acts as permitted by national copyright laws. The publisher or other rights holders may allow further reproduction and re-use of the full text version. This is indicated by the licence information on the White Rose Research Online record for the item.
Takedown
If you consider content in White Rose Research Online to be in breach of UK law, please notify us by
Working Memory Updating and Binding Training: Bayesian Evidence Supporting the
Absence of Transfer
Carla De Simoni
University of Zurich
Claudia C. von Bastian
University of Sheffield
University of Zurich
Author Note
Carla De Simoni, Department of Psychology, University of Zurich; Claudia C. von
Bastian, Department of Psychology, University of Sheffield, United Kingdom.
This work was supported by a grant from the Swiss National Science Foundation (No.
100014_146074) to Klaus Oberauer, and by the URPP “Dynamics of Healthy Aging” of the
University of Zurich. This project was presented at the 14th biannual congress of the Swiss
Psychological Society (SSP/SGP) in Geneva, Switzerland, 2015, at the 57th annual meeting of
the Psychonomic Society in Boston, MA, 2016, and at the Conference of the European
Society for Cognitive Psychology in Potsdam, Germany, 2017. We thank Clara Overkott,
Samuel Winiger, Aline Gaillard, Doris Pfister, Monalisa Stiefel, and Aylin Yantaz for their
assistance with collecting the data. We also thank Emma Blakey for her valuable comments
on a previous version of this article. The data and analysis scripts are available on the Open
Science Framework (https://osf.io/fy5ku). Some of these data have been used in a prior
Correspondence concerning this article should be addressed to Claudia C. von Bastian,
Department of Psychology, Cathedral Court, 1 Vicar Lane, Sheffield S1 1HD. E-mail:
Abstract
As working memory (WM) predicts a wide range of other abilities, it has become a
popular target for training interventions. However, its effectiveness to elicit generalized
cognitive benefits is still under debate. Previous research yielded inconsistent findings and
focused only little on the mechanisms underlying transfer effects. To disentangle training
effects on WM capacity and efficiency, we evaluated near transfer to untrained, structurally
different WM tasks and far transfer to closely related abilities (i.e., reasoning, processing
speed, task switching, and inhibitory control) in addition to process-specific effects on three
WM mechanisms (i.e., focus switching, removal of WM contents, and interference
resolution). We randomly assigned 197 young adults to one of two experimental groups
(updating or item-to-context binding) or to an active control group practicing visual search
tasks. Before and after five weeks of adaptive training, performance was assessed measuring
each of the cognitive processes and abilities of interest with four tasks covering
verbal-numerical and visual-spatial materials. Despite the relatively large sample size, large practice
effects in the trained tasks, and at least moderate correlations between WM training tasks and
transfer measures, we found consistent evidence for the absence of any training-induced
improvements across all ranges of transfer and mechanisms. Instead, additional analyses of
error patterns and self-reported strategy use indicated that WM training encouraged the
development of stimulus-specific expertise and use of paradigm-specific strategies. Thus, the
results suggest that the WM training interventions examined here enhanced neither WM
capacity nor the WM mechanisms assumed to underlie transfer.
Keywords: working memory capacity, updating, binding, cognitive training and
Working Memory Updating and Binding Training: Bayesian Evidence Supporting the
Absence of Transfer
Throughout the 20th century, the prospect of broadly enhancing cognitive abilities
through repetitively practicing a set of tasks has been of central interest for commercial
applications (e.g., the ‘mind training program’ by the Pelmanism Institute of America, 1920)
and academic research (e.g., Ball et al., 2002; Judd, 1908; Kramer, Larish, & Strayer, 1995;
Logie, Baddeley, Mané, Donchin, & Sheptak, 1989; Willis, Cornelius, Blow, & Baltes, 1983).
Over the past 15 years, computerized working memory (WM) training has become a
particularly popular target for training interventions. WM is a capacity-limited system that
provides temporary access to representations needed for ongoing cognitive processes, thereby
building the basis for complex cognition. WM capacity strongly correlates with a wide range
of higher-order cognitive abilities such as reasoning (e.g., Engle, Tuholski, Laughlin, &
Conway, 1999; Friedman, Miyake, Schmeichel, & Tang, 2006; Kyllonen & Christal, 1990;
Oberauer, Süß, Wilhelm, & Wittmann, 2008; Süß, Oberauer, Wittman, Wilhelm, & Schulze,
2002), executive functions (e.g., Friedman et al., 2008; Miyake et al., 2000; Miyake &
Friedman, 2012), and academic achievement (e.g., St. Clair-Thompson & Gathercole, 2006).
Based on the assumption that those correlations reflect overlapping cognitive processes (e.g.,
Kovacs & Conway, 2016), it has been hypothesized that training WM may not only improve
WM capacity but enhances performance also in tasks measuring those related abilities (e.g.,
Klingberg, Forssberg, & Westerberg, 2002; Klingberg et al., 2005). Early studies indeed
reported promising empirical evidence for the transfer of training gains to untrained WM
tasks (i.e., “near transfer”) and even to related abilities (i.e., “far transfer” such as to fluid
intelligence, e.g., Jaeggi, Buschkuehl, Jonides, & Perrig, 2008; Klingberg, Forssberg, &
and meaningful degree” (Sternberg, 2008, p. 6791). More than a decade later, however,
meta-analyses report inconsistent findings, with sometimes significant, sometimes nonsignificant
small far transfer effects (e.g., Au et al., 2015; Melby-Lervåg, Redick, & Hulme, 2016;
Schwaighofer, Fischer, & Bühner, 2015; Soveri, Antfolk, Karlsson, Salo, & Laine, 2017;
Weicker, Villringer, & Thöne-Otto, 2015).
It is yet unclear when and under which circumstances WM training elicits far transfer
effects, as the mechanisms underlying potential transfer effects have been largely neglected in
much of past research (cf. von Bastian & Oberauer, 2014; for notable exceptions, see Gibson,
Gondoli, Johnson, Steeger, & Morrissey, 2012; Hussey et al., 2016; Lilienthal, Tamez,
Shelton, Myerson, & Hale, 2013; Ralph et al., 2017; Waris, Soveri, & Laine, 2015).
Moreover, any meta-analytic findings must be interpreted with caution, as they are based on
studies that often suffered from methodological issues such as evaluating WM training effects
relative to no-contact control groups, using single transfer measures, or low statistical power
(cf. Bogg & Lasecki, 2015; Moreau, Kirk, & Waldie, 2016; Shipstead, Redick, & Engle,
2013). The present study aims to fill this gap by using methodological rigor to systematically
investigate whether and, if so, how WM training affects theoretically derived indicators of
WM capacity and efficiency.
Mechanisms of Transfer
Generally, training-induced broad cognitive improvements can be caused by either
increased WM capacity or enhanced WM efficiency, or a combination of both (for a more
detailed discussion, see von Bastian & Oberauer, 2014). Increased capacity is reflected by
structural changes and should therefore lead to broad transfer manifested in improved
performance across tasks drawing on this capacity-limit. Enhanced efficiency refers to a better
exploitation of the capacity available, for example through the use of strategies or a higher
capacity, the range of transfer that follows from enhanced efficiency depends on how
efficiency was increased: the less material- or paradigm-specific the improvement, the more
transfer should be observed to tasks that draw on the same WM mechanisms. For example,
whereas paradigm-specific strategy-use can be expected to transfer to very similar tasks only
(for reviews, see Lustig, Shah, Seidler, & Reuter-Lorenz, 2009; Morrison & Chein, 2011), a
higher level of automatization should result in transfer to tasks that draw on the same WM
mechanisms (cf. von Bastian & Oberauer, 2014).
To disentangle the effects of enhanced capacity and enhanced efficiency, we based the
present study on the three-embedded-components model of working memory (Oberauer,
2009; Oberauer & Hein, 2012), which is an extension of the model proposed by Cowan
(1995). It assumes three functional levels of information selection, namely the activated part
of long-term memory (aLTM), the region of direct access (RDA), and the focus of attention
(FoA). The aLTM reflects all representations needed for a current task, activated through
perceptual input or spread of activation. In the RDA, a subset of the activated representations
is temporarily bound into new structures. In contrast to the aLTM, the capacity of the RDA is
limited due to interference between simultaneously maintained bindings (Oberauer, 2005).
Lastly, the FoA selects the one item of the RDA that is processed next. According to the
three-embedded components model, increased WM capacity would result in an increased
number of bindings that can be maintained at a time. Furthermore, the capacity to build and
maintain temporary bindings has been hypothesized to be the common limiting factor that
explains the strong correlation between working memory and reasoning (“binding
hypothesis”, cf. Oberauer, Süss, Wilhelm, & Sander, 2007). Thus, increased WM capacity in
terms of a larger number of simultaneously maintained bindings should be reflected in broad
transfer to other WM tasks, reasoning, and other cognitive abilities (e.g., executive functions)
Better WM performance could also reflect a more efficient use of basic WM processes
that enhance the encoding, maintenance or retrieval of an otherwise stable number of
bindings. Here, we focus on three WM mechanisms: enhanced focus switching, removal of no
longer relevant information, and interference resolution. Focus switching refers to the ability
of the FoA to flexibly shift attention between single items held in the RDA. Reducing the
time needed to move the FoA from one item to another increases the time to refresh and, thus,
maintain memoranda (Barrouillet, Bernardin, & Camos, 2004), thereby potentially enhancing
recall performance. There is some evidence that training can indeed reduce the cost in
reaction times (RT) caused by focus switching (e.g., Dorbath, Hasselhorn, & Titz, 2011;
Oberauer, 2006; Verhaeghen, Cerella, & Basak, 2004), but it is yet unclear how these
improvements relate to transfer effects.
Removal of no longer relevant information is the “unlearning or unbinding of an item
from its context” (Ecker, Lewandowsky, & Oberauer, 2014, p. 3). For the proper functioning
of working memory, especially the building of new bindings in the RDA, it is essential that
outdated information is removed because it would otherwise strongly interfere with the
information that is relevant for a current task (Oberauer & Lewandowsky, 2016). More
efficient removal is marked by a reduction in the time it takes to remove the no longer
relevant information.
Finally, interference resolution is the ability to overcome interference among bindings
held in the RDA and is often assumed to be one of the most central mechanisms of transfer
(Au et al., 2015; Hussey et al., 2016; Oelhafen et al., 2013). Interference resolution becomes
important whenever a conflict in information processing occurs. For example, in a recognition
task, conflict occurs when participants are presented with a recent item that, however, was not
part of the current memory set; hence the material is highly familiar yet presently irrelevant.
memory array (cf. Oberauer, 2008). Resolving this interference requires the recollection of the
item and its context (i.e., the whole binding, Oberauer, 2005; see also Szmalec, Verbruggen,
Vandierendonck, & Kemps, 2011). Thus, enhanced interference resolution is reflected by
improved recollection performance.
How Strong is the Evidence for Transfer?
Although methodological issues have been discussed extensively elsewhere (e.g.,
Shipstead et al., 2013), several problems persist in the training literature, such as the inclusion
of no-contact control groups and the measurement of abilities through single tasks (cf. von
Bastian, Guye, & De Simoni, 2018; Guye, Röcke, Mérillat, von Bastian, & Martin, 2016). An
additional pervasive issue is the low power of most WM training studies due to small sample
sizes, with an average group size of n = 20 (Melby-Lervåg et al., 2016). Low statistical power
not only increases the probability of false-negative and false-positive findings (e.g., Button et
al., 2013), but can also inflate effect sizes. For example, in their simulation study, Halsey,
Curran-Everett, Vowler, and Drummond (2015) showed that attempts to detect a true medium
effect (Cohen’s d = 0.50) with low statistical power (n = 30, theoretical power = 48%) yielded
97% of inflated effects sizes, with the significant effect sizes ranging from d = 0.44 to d =
1.23. As the true size of transfer effects is unknown, we can only speculate about the number
of inflated effect sizes in training research; however, meta-analytic effect size estimates are
likely to be overestimated (cf. Bogg & Lasecki, 2015; Dougherty, Hamovitz, & Tidwell,
2015; see also von Bastian et al., 2018).
A suitable alternative approach to evaluate the evidence of training and transfer effects
is the use of Bayesian inference, where the strength of evidence is expressed by the Bayes
factor (BF). The BF is the likelihood of the data under one hypothesis (usually the alternative
hypothesis, H1) relative to the likelihood of the data under the other hypothesis (usually the
allow for quantifying evidence not only for the alternative hypothesis (i.e., the presence of
training and transfer effects) but also for the null hypothesis (i.e., absence of training and
transfer effects). Consequently, BFs are increasingly popular in cognitive training research
(e.g., Dougherty et al., 2015; Goghari & Lawlor-Savage, 2017; Guye, De Simoni, & von
Bastian, 2017; Guye & von Bastian, 2017; Sprenger et al., 2013; von Bastian & Oberauer,
2013). For example, Dougherty and colleagues (2015) recently reevaluated the 20 n-back
training studies included in the meta-analysis by Au et al. (2015) with a Bayesian approach.
Out of the 24 comparisons, 11 (i.e., 46%) contributed only ambiguous evidence (BF < 3),
indicating that the data from these studies were not sensitive enough to support either
hypothesis. Given that the average group size in the included studies was only n = 20, the
ambiguity of the results was probably due to low power. Hence, evidence regarding transfer
effects of WM training is still inconclusive, with large-scale WM training studies contributing
stronger evidence still being needed.
Present Study
In the present study, our goals were to examine (1) the effectiveness of WM training in
eliciting near and far transfer effects and, (2), the specific mechanisms underlying
training-induced improvements in cognitive performance. We compared two WM training
interventions – memory updating and associative binding – to an active control group
practicing visual search. Updating training is amongst the most widely used WM training
interventions (cf. von Bastian & Oberauer, 2014; e.g., n-back tasks: Jaeggi, Buschkuehl,
Jonides, & Perrig, 2008; Lilienthal et al., 2013; Redick et al., 2013, keep-track tasks: Dahlin,
Neely, Larsson, Backman, & Nyberg, 2008; Dahlin, Nyberg, Bäckman, & Neely, 2008,
running-memory tasks: Waris et al., 2015, and memory updating tasks: Linares, Borella,
Lechuga, Carretti, & Pelegrina, 2017; Schmiedek, Lövdén, & Lindenberger, 2010). In
few existing studies having focused on older adults (Bellander et al., 2017; Zimmermann, von
Bastian, Röcke, Martin, & Eschen, 2016). However, according to the binding hypothesis
(Oberauer et al., 2007), a training regimen targeting the ability to simultaneously maintain
multiple bindings directly should maximize chance to observe broad transfer.
To evaluate changes in capacity, we assessed near transfer to the respective other set
of tasks (i.e., binding tasks served as near transfer tasks for updating training and vice versa),
and far transfer to abilities that have been shown to strongly correlate with WM, such as
reasoning (e.g., Friedman, Miyake, Schmeichel, & Tang, 2006; Kyllonen & Christal, 1990;
Oberauer, Süß, Wilhelm, & Wittmann, 2008; Süß, Oberauer, Wittman, Wilhelm, & Schulze,
2002), shifting and inhibition (e.g., Friedman et al., 2009; Miyake et al., 2000; Miyake &
Friedman, 2012), and processing speed (e.g., McAuley & White, 2011; Schmiedek, Oberauer,
Wilhelm, Süss, & Wittmann, 2007). Although both WM training paradigms could increase
the efficiency of all three WM processes we assessed, we assumed that updating training
would put particularly strong demands on focus switching (cf. Oberauer, 2006), followed by
removal of outdated information (cf. Ecker et al., 2014; Ecker, Lewandowsky, Oberauer, &
Chee, 2010), whereas binding training would emphasize more on interference resolution (e.g.,
Oberauer, 2005), followed by removal of outdated information. In addition, we explored two
alternative mechanisms of change that would boost performance in the trained paradigms, but
not transfer to other abilities: systematic shifts in bias towards familiarity-based processing,
and the use of paradigm-specific strategies.
We followed the best practice recommendations for training interventions provided by
recent reviews (e.g., Noack, Lövdén, & Schmiedek, 2014; Shipstead et al., 2012; Simons et
al., 2016; von Bastian & Oberauer, 2014), such as the inclusion of an active control group, the
usage of multiple indicators to measure cognitive abilities, and an adequate sample size. First,
training intervention and those caused by participating in a study (cf. Klingberg, 2010).
Participants of the control group trained visual search tasks, which demand only little WM
(e.g., Kane, Poole, Tuholski, & Engle, 2006; Sobel, Gerrie, Poole, & Kane, 2007) and were
successfully used in previous training studies (e.g., Foster et al., 2017; Harrison et al., 2013;
Redick et al., 2013; von Bastian, Langer, Jäncke, & Oberauer, 2013). To check whether
expectations were similar across the experimental and control training groups (Boot, Simons,
Stothart, & Stutts, 2013), we asked participants to rate their subjective cognitive
improvement. Second, we assessed each cognitive function with four indicators to prevent
task-specific features being responsible for the observation of potential transfer effects (cf.
Noack et al., 2014; Shipstead et al., 2012). Third, our training groups comprised between 59
and 72 participants, thus our group sample sizes were about three times as large as the size of
average treatment groups in WM training research (i.e., n = 20, cf. Melby-Lervåg et al.,
2016).
Method
Participants
We recruited young adults between 18 and 36 years for a "cognitive training study"
through the participant pool of the Department of Psychology of the University of Zurich,
postings at the university campus, and short study presentations in lectures. Inclusion criteria
were German native speaker or high proficiency in German, normal or corrected-to-normal
vision, no color blindness, no current psychiatric or neurological disorders, and no
psychotropic drug use. Participants were reimbursed after posttest completion with CHF 120
(approx. USD 125), or 10 course credits and CHF 20 (approx. USD 21). Moreover,
participants received a bonus of up to CHF 50 (approx. USD 52) depending on the level of
difficulty they achieved during training (cf. von Bastian & Oberauer, 2013). The experimental
compliance with the Helsinki Declaration. All participants gave written consent to taking part
in the study.
As previous studies were likely severely underpowered (cf. Bogg & Lasecki, 2015)
and, hence, probably yielded inflated effect size estimates (Halsey et al., 2015), we refrained
to use those estimates for power analyses. Instead, we aimed to recruit at least three times as
many participants than previous studies (i.e., n = 60 per group). We managed to recruit 241
participants who were randomly assigned to one of the three training groups. The study
followed a double-blind design, hence neither the participants nor the experimenter
conducting pre- and posttests knew to which group participants were assigned to. As
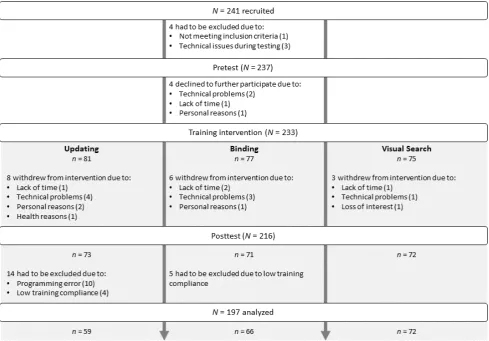
illustrated in Figure 1, N = 233 participants begun with the training intervention of which 216
completed the study. Reasons for the 17 dropouts were lack of time (4), technical problems
(8), personal reasons (3), health issues (1), or loss of interest (1). We had to exclude another
19 participants due to a programming error in the updating training intervention (10) or lack
of compliance as evidenced by performance below chance level in more than five (i.e., 25%)
training sessions (9). The final sample we analyzed consisted of 197 participants. Table 1 lists
the descriptive statistics of the demographic variables. The WM training groups were
comparable to the active control in terms of gender (updating: BFH1 = 1/4.37 ± 0.00%,
binding: BFH1 = 1/4.46 ± 0.00%). Evidence also supported the absence of age differences for
the binding relative to the active control group, BFH1 = 1/3.29 ± 0.00%. It was ambiguous
though for the updating group, BFH1 = 1/1.13 ± 0.00%, with participants in the updating group
Figure 1. Flowchart of participant recruitment and study completion.
Table 1
Participant Demographics
Group
Measure Updating Binding Active Control
Sample size (n) 59 66 72
Gender (f/m) 40/19 45/21 49/23
Age (M, SD) 22.61 (2.97) 24.55 (4.05) 23.81 (4.16)
Note. BFs indicated support for the null hypothesis that there were no group differences as determined by Bayesian Pearson chi-square test (gender) and Bayesian two-tailed t-tests (age).
Design and Materials
Participants completed 20 training sessions of extensive cognitive training over the
course of 5 weeks. Training and transfer effects were assessed by administering a test battery
Training. Participants completed training at their own computer or laptop at home
using Tatool (von Bastian, Locher, & Ruflin, 2012), a Java-based open-source training and
testing tool (www.tatool.ch). After each session, data were automatically uploaded to a web
server running Tatool Online. An experimenter, who was not involved in the collection of
outcome measures, monitored participants’ training performance and served as contact person
during training. As in previous work (von Bastian & Oberauer, 2013; von Bastian et al., 2013;
von Bastian & Eschen, 2016), we aimed to maximize experimental control through automated
online analyses to detect irregularities (e.g., performance below chance level). To increase
individual commitment, participants (1) signed a participation agreement at the beginning of
the study, (2) were made aware of their progress being constantly monitored, (3) received
regular emails (i.e., after 2 and 4 weeks of training) on their training progress, and (4) were
reminded to practice when falling behind their training schedule (i.e., less than four sessions
completed per week).
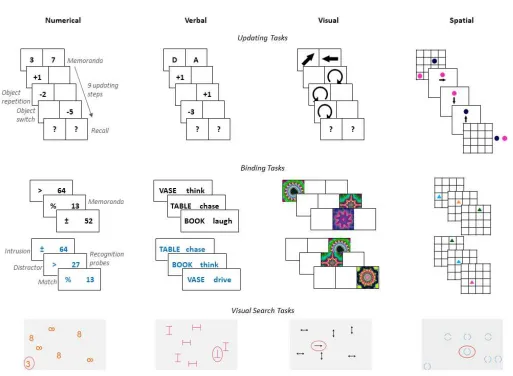
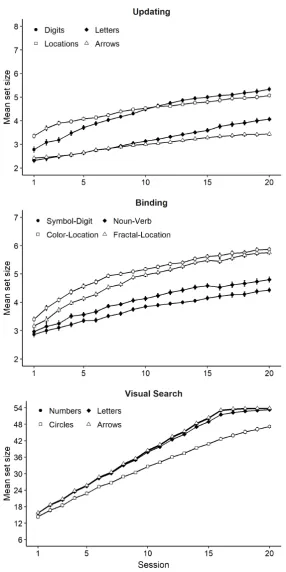
Each group practiced four tasks with varying material (numerical, verbal, visual, and
spatial, see Figure 2 for an illustration and Table 2 for details) for approximately 10 min each
per training session. The order of task administration was randomized for each training
session. For all groups, task duration was restricted to a maximum of 11.25 min so that a
training session did not exceed 45 min. The updating group completed up to 12 trials, the
binding group up to 24 trials, and the active control group up to 100 trials per task and
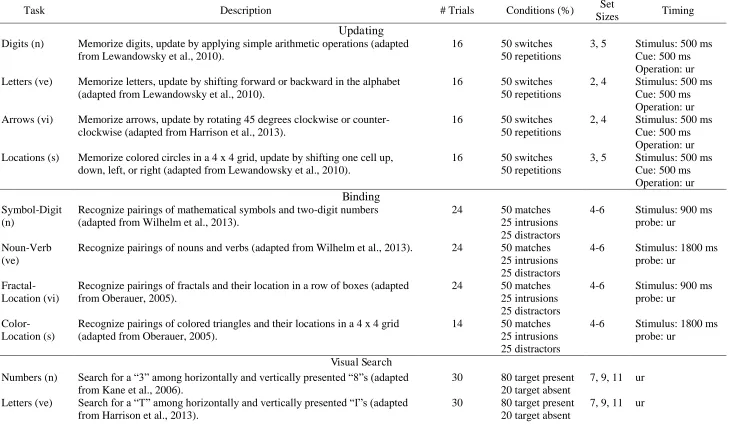
Table 2
Description of the Training and Transfer Tasks
Task Description # Trials Conditions (%) Set
Sizes Timing
Updating
Digits (n) Memorize digits, update by applying simple arithmetic operations (adapted from Lewandowsky et al., 2010).
16 50 switches 50 repetitions
3, 5 Stimulus: 500 ms Cue: 500 ms Operation: ur Letters (ve) Memorize letters, update by shifting forward or backward in the alphabet
(adapted from Lewandowsky et al., 2010).
16 50 switches 50 repetitions
2, 4 Stimulus: 500 ms Cue: 500 ms Operation: ur Arrows (vi) Memorize arrows, update by rotating 45 degrees clockwise or
counter-clockwise (adapted from Harrison et al., 2013).
16 50 switches 50 repetitions
2, 4 Stimulus: 500 ms Cue: 500 ms Operation: ur Locations (s) Memorize colored circles in a 4 x 4 grid, update by shifting one cell up,
down, left, or right (adapted from Lewandowsky et al., 2010).
16 50 switches 50 repetitions
3, 5 Stimulus: 500 ms Cue: 500 ms Operation: ur
Binding
Symbol-Digit (n)
Recognize pairings of mathematical symbols and two-digit numbers (adapted from Wilhelm et al., 2013).
24 50 matches 25 intrusions 25 distractors
4-6 Stimulus: 900 ms probe: ur
Noun-Verb (ve)
Recognize pairings of nouns and verbs (adapted from Wilhelm et al., 2013). 24 50 matches 25 intrusions 25 distractors
4-6 Stimulus: 1800 ms probe: ur
Fractal-Location (vi)
Recognize pairings of fractals and their location in a row of boxes (adapted from Oberauer, 2005).
24 50 matches 25 intrusions 25 distractors
4-6 Stimulus: 900 ms probe: ur
Color-Location (s)
Recognize pairings of colored triangles and their locations in a 4 x 4 grid (adapted from Oberauer, 2005).
14 50 matches 25 intrusions 25 distractors
4-6 Stimulus: 1800 ms probe: ur
Visual Search Numbers (n) Search for a “3” among horizontally and vertically presented “8”s (adapted
from Kane et al., 2006).
30 80 target present 20 target absent
7, 9, 11 ur
Letters (ve) Search for a “T” among horizontally and vertically presented “I”s (adapted from Harrison et al., 2013).
30 80 target present 20 target absent
Arrows (vi) Search for a single-headed arrow among double-headed arrows (adapted from Kane et al., 2006).
30 80 target present 20 target absent
7, 9, 11 ur
Circles (s) Search for a circle with one gap among circles with two gaps (von Bastian et al., 2013).
30 80 target present 20 target absent
7, 9, 11 ur
Removal
Digits (n) Memorize and substitute digits (adapted from Ecker et al., 2010). 18 50 long CTI 50 short CTI
3 Stimulus: 500 ms long cue: 1800 ms short cue: 200 ms substitution: ur Letters (ve) Memorize and substitute letters (adapted from Ecker et al., 2010). 18 50 long CTI
50 short CTI
3 Stimulus: 500 ms long cue: 1800 ms short cue: 200 ms substitution: ur Arrows (vi) Memorize and substitute arrows (adapted from Ecker et al., 2010). 18 50 long CTI
50 short CTI
3 Stimulus: 500 ms long cue: 1800 ms short cue: 200 ms substitution: ur Locations (s) Memorize and substitute colored circles in a 4 x 4 grid (adapted from Ecker
et al., 2010).
18 50 long CTI 50 short CTI
3 Stimulus: 500 ms long cue: 1800 ms short cue: 200 ms substitution: ur Reasoning
Diagramming Relationships (ve)
Identify the Venn diagram out of five options that best describes the semantic relationship between three nouns (e.g., “animals, cats, and dogs” would be best represented by one circle corresponding to “animals”
containing two separate circles for “cats” and “dogs”; Ekstrom, French,
Harman, & Dermen, 1976).
30 - Time limit: 8 min
Letter Sets (ve)
Identify the letter set that deviates from the logical pattern underlying the other four sets (Ekstrom et al., 1976).
30 - Time limit: 14 min
Locations Test (vi)
Based on the logical pattern underlying the spatial distribution of “x”s on rows of dashes, identify at which of five locations the next “x” has to be
placed (Ekstrom et al. 1976).
28 - Time limit: 12 min
RAPM (s) Complete a pattern by choosing 1 out of 8 options (Arthur & Day, 1994; see also Raven, 1990).
28 - Time limit: 15 min
Parity-Magnitude (n)
Classify (1-9, excluding 5) as odd or even, or smaller or larger than 5 (von Bastian et al., 2016).
Single: 2 x 64 Mixed: 129 50 switches 50 repetitions - ur Animacy-Size (ve)
Classify line-drawings of animals and objects as living or non-living, or smaller or larger than a soccer ball (von Bastian et al., 2016).
Single: 2 x 64 Mixed: 129 50 switches 50 repetitions - ur Color-Shape (vi)
Categorize figures according to their color (blue or green) or their shape (round or angular, von Bastian et al., 2016).
Single: 2 x 64 Mixed: 129
50 switches 50 repetitions
- ur
Fill-Frame (s) Classify whether a geometric figure is dotted or striped, or framed or not (von Bastian & Oberauer, 2013).
Single: 2 x 64 Mixed: 129
50 switches 50 repetitions
- ur
Inhibition Number
Stroop (n)
Indicate which of two digits has the higher value. In congruent trials, differences in value and physical size match (i.e., digits with higher value are displayed larger), in incongruent trials they mismatch, and in neutral trials, both digits have the same size (Tzelgov, Meyer, & Henik, 1992).
288 33 congruent 33 incongruent 33 neutral
- ur
Color Stroop (ve)
Indicate the hue of color words. In congruent trials, the hue matches the color word, in incongruent trials it does not, and in neutral trials, colored
“X”s are presented (Stroop, 1935).
288 33 congruent 33 incongruent 33 neutral
- ur
Global-Local (vi)
Indicate whether the small (local) shapes making up a bigger (global) shape are circles or squares. In congruent trials, the local and global shape match (e.g., a circle made up of small circles), in incongruent trials, they
mismatch, and in neutral trials, line drawings of circles or squares are presented (Navon, 1977).
288 33 congruent 33 incongruent 33 neutral
- ur
Simon (s) Indicate the color of a green or red circle presented on the left, right or centrally by pressing the left arrow key for green and the right arrow key for red. In congruent trials, the location of the circle and the location of the response key match (e.g., a green circle is presented on the left), in
incongruent trials they mismatch, and in neutral trials, the circle is displayed centrally (Simon, Sly, & Vilapakkam, 1981).
288 33 congruent 33 incongruent 33 neutral
- ur
Updating training. In the four memory updating tasks (adapted from Lewandowsky,
Oberauer, Yang, & Ecker, 2010), participants had to remember an initial set of
simultaneously presented stimuli. During the updating phase, participants had to transform
individual stimuli (e.g., mentally move previously memorized circles in a grid or applying a
simple arithmetic operation to a digit), enter the result of the transformation, and remember
the result. In half of the trials, a cue indicated which of the stimuli had to be updated next.
Half of the updating steps were switching trials (i.e., the to-be-updated stimulus was different
from the one in the preceding updating step) and the other half were repetition trials (i.e., the
to-be-updated stimulus was the same as the one in the preceding updating step). After nine
updating steps, participants had to recall the most recent result of each stimulus.
Binding training. In the four associative binding tasks (adapted from Oberauer, 2005;
Wilhelm, Hildebrandt, & Oberauer, 2013), participants had to memorize sequentially
presented associations of two elements (e.g., pairings of symbols and digits, or fractals and
their location). In the subsequent recognition phase, each association was randomly probed
with one of the elements given as cue. Of the probes, 50% were positive (i.e., exact matches),
25% were intrusions (i.e., probes that were presented in the current trial, but associated with a
different element or location), and 25% were distractors (i.e., probes not presented in the
current trial).
Active control training. In the four visual search tasks, participants had to search for a
target (e.g., a single-headed arrow) among distractors (e.g., double-headed arrows) and, if the
target was present, to indicate whether it faced up, down, left, or right by pressing the
corresponding arrow key (cf. von Bastian et al., 2013). In target-absent trials, participants had
to press "A" instead. The search display was a warped 7 x 8 grid, generating a scattered
Adaptive training algorithm. Each training task’s difficulty was adjusted to individual
performance. The updating and binding training tasks started with a set size (i.e., number of
memoranda) of two and a maximal response time limit of 3500 ms, and the active control
training tasks with a search display containing six stimuli. The first training session served to
evaluate participants’ individual cognitive performance limit (cf. Guye & von Bastian, 2017).
In each task, participants’ mean accuracy was measured after every 10% of trials (1 trial in the
updating tasks, 2 trials in the binding tasks, and 10 trials in the visual search tasks). If
participants scored at least 85% correct, difficulty was increased, otherwise it remained on the
current level. For the remaining 19 training sessions, participants’ performance was checked
after every 40% of trials (5 trials in the updating tasks, 10 trials in the binding tasks, and 40
trials in the visual search tasks). In the updating and binding tasks, difficulty was adjusted by
decreasing the response time limit by 500 ms for four subsequent level-ups (e.g., when
reaching levels 2 through 5), and by increasing set size by one additional memorandum every
fifth level-up (e.g., when reaching level 6). The response time limit was reset to 3500 ms
whenever the set size was increased and again reduced by 500 ms for the subsequent four
level-ups. In the active control group, level-ups corresponded to an increase in set size (i.e.,
number of stimuli shown in the search display) by one additional stimulus. We refrained from
adjusting response time in the active control group, to minimize demands on processing
speed, which is strongly correlated with WM and reasoning (cf. Schmiedek et al., 2007).
Participants were informed when they reached a higher difficulty level (i.e., “Congratulations,
you achieved the next level”), and they started each session on the highest level they achieved
in the preceding session (cf. von Bastian et al., 2013).
Questionnaires. To examine whether the training groups were similarly motivated
during training, we asked participants after each training session to rate the enjoyment
session (“I tried to do well in today’s training session”; both items adapted from the Intrinsic
Motivation Inventory, IMI, Deci & Ryan, 2015), and the perceived fit between difficulty and
ability (“The difficulty of today’s training session was just right”; cf. von Bastian & Eschen,
2016) on a scale ranging from 1 (does not apply at all) to 7 (does apply very well).
In addition, participants were asked to monitor their learning progress during training
by answering two questions at the beginning of each training session (i.e., "how would you
rate your performance in the last training session?", "how well will you perform in today's
training session?") and one at the end of each session (i.e., "how would you rate your
performance in today's training session?"). These data will be reported elsewhere.
Furthermore, participants completed the German version of the Questionnaire on Current
Motivation (QCM, Rheinberg, Vollmeyer, & Burns, 2001) after training sessions 1 and 10,
and the IMI (Deci & Ryan, 2015) after training session 20. These data have been reported in
Guye et al. (2017). Finally, after training session 20, participants completed a questionnaire
on strategy-use and training-related expectations. Strategy-use was assessed with a
dichotomous item on whether they used strategies to complete the tasks and, if so, to briefly
describe the strategy (primarily) used, and to rate how useful they were on a scale from 1 (not
at all) to 5 (very). To assess training-related expectations, participants reported on a scale
ranging from 1 (not at all) to 5 (very) whether they believed that they improved in the trained
tasks, in the untrained cognitive tasks, and in everyday life.
Pre- and posttest. Before and after the training intervention, we assessed practice,
near and far transfer, and mechanism-specific effects with a test battery of 28 computer-based
tasks. We used the same test battery for pre- and posttest to facilitate between-groups baseline
comparisons, required for investigating the comparability across groups and occasions (cf.
Guye & von Bastian, 2017; von Bastian & Oberauer, 2013; von Bastian & Eschen, 2016). Up
including three short breaks. To control for fatigue and practice effects, half of the
participants in each group completed the test battery in reversed order (i.e., they started with
the forward’s order last task of the last block and finished the test battery with the first task of
the first block, cf. von Bastian & Oberauer, 2013). To familiarize participants with the tasks,
several practice trials were presented before test blocks of pseudorandomized trials. Each
cognitive ability was assessed with four tasks with varying material. Table 2 lists the details
for each task regarding stimuli, conditions, number of trials, set sizes, and timing parameters.
Before the pretest, participants completed a series of questionnaires: NEO-FFI
(Borkenau & Ostendorf, 2008); Need for Cognition (Bless, Wänke, Bohner, Fellhauer, &
Schwarz, 1994), Theories of Intelligence Scale (Dweck, 2000), Grit Scale (Duckworth &
Quinn, 2009), Self-Efficacy Scale (Schwarzer & Jerusalem, 1995), Self-Efficacy to Regulate
Exercise (Bandura, 2006). Findings from these measures are reported in Guye et al. (2017).
Training. To compare practice effects between training conditions, we administered
test versions of the training tasks at pre- and posttest that were identical in structure and
material to the training tasks above. All participants completed the same set of trials. Different
to the training tasks, trials varied regarding set sizes, but with fixed timing parameters. The
proportion of correctly recalled items at the end of each trial served as dependent variable for
the updating tasks. The discrimination parameter d’ from signal detection theory served as
outcome measure for the associative binding tasks. It was computed from subtracting the
z-transformed false alarms to intrusion probes from the z-z-transformed hit rates (cf. Oberauer,
2005). Participants' ability to search through a visual display was measured by the individual
residuals from a simple linear regression model predicting the RTs of target-absent trials from
the RTs of target-present trials (for a similar approach in dual tasks, see Oberauer, Lange, &
Engle, 2004). Hence, for the visual search tasks, better performance was reflected by lower
Near transfer. To assess near transfer, we examined whether participants of the
updating group showed transfer to the binding tasks and vice versa. The mean recall accuracy
of the updating tasks and the discrimination parameter d’ computed from the binding tasks
served as dependent variables.
Far transfer. The four reasoning tasks required participants to either detect a rule
behind a pattern or to integrate information for drawing a conclusion. The proportion of
correctly answered items relative to the total number of items served as outcome measure. In
the four shifting tasks, participants had to categorize bivalent stimuli according to one of two
classification rules as indicated by a cue, which was displayed 150 ms before stimulus onset
(cf. von Bastian, Souza, & Gade, 2016). Each task consisted of five blocks: two single-rule
blocks (only one rule had to be applied, e.g., animacy classification followed by size
classification), a mixed-rules block (two rules switched randomly, e.g., switching between
animacy and size classifications), and another two single-rule blocks in reversed order (e.g.,
size classification followed by animacy classification). Half of the trials in the mixed-rules
block were switching trials (i.e., the rule was different than the one in the preceding trial) and
the other half were repetition trials (i.e., the rule was the same as the one in the preceding
trial; the first trial was excluded from analyses as it constitutes neither a switch nor a
repetition). Switching costs were calculated by subtracting RTs to repetition trials from RTs
to switch trials in the mixed-rules block. Processing speed was measured by the average RTs
in single-rule blocks of the shifting tasks. In the four inhibition tasks, participants were
required to inhibit prepotent responses. These tasks comprised three conditions: a congruent
condition (correct and prepotent response correspond), an incongruent condition (correct and
prepotent response do not correspond) and a neutral condition (no prepotent response
condition were randomly presented within four blocks of 72 trials. Interference costs were
computed by subtracting the RTs to neutral trials from RTs to incongruent trials.
WM processing. To assess focus switching, we used the RTs in the updating steps of
the updating training tasks. Specifically, we computed the RT cost of having to switch
between memory objects in two subsequent updating steps relative to object repetitions by
subtracting RTs to repetition trials from RTs to switch trials (Oberauer & Hein, 2012). Thus,
lower values reflected lower costs of switching the focus, which we interpreted as better
performance.
Removal speed was measured with four modified memory updating tasks modeled
after Ecker et al. (2014). As in the updating tasks, participants had to memorize an initial set
of stimuli. In the subsequent updating phase, however, individual stimuli were substituted by
new ones and participants had to press the space bar (or click a button in the spatial version of
the task, cf. Table 2) as soon as they had memorized the new stimulus. A cue presented for
either 200 ms (i.e., short cue-target interval, CTI) or 1500 ms (i.e., long CTI) indicated which
stimulus was updated next. In contrast to the updating task, this paradigm consisted of
switching trials only (i.e., the to-be-updated stimulus was always different from the one in the
preceding updating step). After 1 to 18 updating steps, participants had to recall the most
recent stimuli. Individual residuals from a simple regression model predicting the RTs of
trials with short CTIs from RTs of trials with long CTIs were used as dependent variables
(Ecker et al., 2010). Thus, lower values reflected more efficient removal from WM.
Finally, interference resolution performance was assessed by the WM training tasks.
From the updating tasks, we extracted the proportion of transposition errors (i.e., recalling an
item from the current trial but at a wrong position). From the binding tasks, we used the
Alternative mechanisms. To analyze the patterns of errors committed in the trained
tasks, we additionally extracted the proportion of extra-list errors (i.e., wrongly recalled items
not in the memory array) in the updating tasks, and the proportion of correct responses to
matching and distractor probes in the binding tasks. As changes in accuracy towards probes in
the binding tasks could reflect systematic shifts in response bias (e.g., saying NO more often
would result in more misses and, so, in lower accuracy in matching probes, but higher
accuracy in intrusion and distractor probes), we computed the criterion C by multiplying the
sum of the z-transformed hit rate and z-transformed false alarm rate by -0.5. Values in the
positive range reflect biases towards saying NO, and values in the negative range reflect
biases towards saying YES. The higher the value, the stronger the bias. Self-reported strategies
were categorized by each author separately, with an agreement rate of 86.18%. Discrepancies
were resolved through discussion.
Analyses
Analyses were undertaken in four steps. First, we evaluated the proposed theoretical
transfer model by fitting a measurement model to the pre- and posttest data. Second, we
examined change over the course of the 20 training sessions in terms of the training level
achieved and motivation. Third, we investigated gains from pre- to posttest for each
experimental group relative to the control group. Specifically, we analyzed (1) practice effects
on the trained tasks, (2) near and far transfer, and (3) changes in the proposed WM
mechanisms of transfer (i.e., focus switching, removal, and resolution of interference).
Finally, to explore alternative mechanisms of change in the trained abilities, we analyzed the
response patterns and participants’ self-reported strategy use. All analyses were conducted in
R (R Core Team, 2015).
Bayesian analyses. We used the “BayesFactor” package (Morey & Rouder, 2015)
compute BFs. BFs range on a continuous scale from 0 to ∞, with a BF of 1 reflecting perfect
ambiguity (i.e., the data support both hypotheses equally). BFs below 1 represent evidence for
the hypothesis in the denominator (typically H0), and BFs above 1 indicate evidence in favor
of the hypothesis in the numerator (typically H1). For example, a BF of 10 in favor of the H1
means that the data are ten times more likely under H1 than H0. To facilitate interpretation,
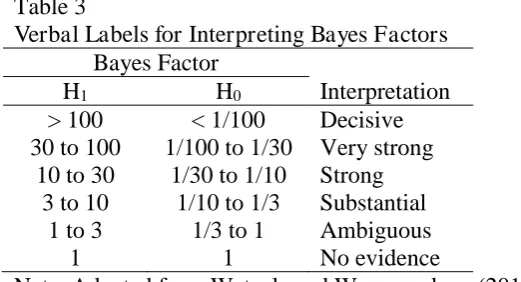
[image:28.595.64.325.268.409.2]Table 3 lists verbal labels adapted from Wetzels and Wagenmakers (2012).
Table 3
Verbal Labels for Interpreting Bayes Factors
Bayes Factor
H1 H0 Interpretation
> 100 < 1/100 Decisive 30 to 100 1/100 to 1/30 Very strong
10 to 30 1/30 to 1/10 Strong 3 to 10 1/10 to 1/3 Substantial
1 to 3 1/3 to 1 Ambiguous
1 1 No evidence
Note. Adapted from Wetzels and Wagenmakers (2012).
Baseline comparisons, training performance and motivation, and gains from pretest to
posttest were analyzed with Bayesian linear mixed-effects (LME) models across each of the
four tasks measuring the same ability using the lmBF() function of the BayesFactor package.
LME models have the advantage that they simultaneously account for multiple sources of
variance in the data. Two types of effects are distinguished in LME models: fixed effects
(e.g., variance from experimental conditions or predictors) and random effects (e.g., variance
from individual differences). We included participant and task as crossed-random effects
(Baayen, Davidson, & Bates, 2008) to account for the fact that both participants and tasks
included in our study are random samples drawn from larger populations. Hence, although
this procedure does not specifically model latent change, it does allow for analyzing effects
Guye & von Bastian, 2017; von Bastian & Eschen, 2016; von Bastian & Oberauer, 2013;
Zimmermann et al., 2017).
Confirmatory factor analysis (CFA). To investigate the relationship between the
measured cognitive abilities at pre- and posttest, we conducted a latent-variable CFA using
the “lavaan” package (Rosseel, 2012). We examined model fit evaluating the chi-square
statistic ( 2), the comparative fit index (CFI), the root mean-squared error of approximation
(RMSEA) and its 90% confidence interval (CI), and the standardized root mean-squared
residual (SRMR). Good fit is indicated by values above .95 for CFI, values less than 0.06 for
RMSEA, and values below .08 for SRMR (Hu & Bentler, 1999).
Data preprocessing. Only RTs of correct responses were analyzed. RTs being 3
median absolute deviations away from the overall median (Leys, Ley, Klein, Bernard, &
Licata, 2013) or shorter than 200 ms were defined as outliers and excluded from analyses. To
reduce positive skew of speed-based outcome measures, we log-transformed RTs. All
dependent variables were z-transformed across the three groups. To eliminate variance due to
the two different orders of test administration in pre- and posttest, we arbitrarily selected one
order as the reference condition and corrected the data of the other order for the mean
difference between the two orders for each variable (cf. von Bastian & Druey, 2017; von
Bastian & Oberauer, 2013).
Missing data. For each task, we excluded participants who showed signs of
non-compliance (i.e., mean accuracy below chance level and proportion of RTs below 200 ms > M
proportion + 3 SD). This concerned individuals in 13 tasks at pretest and 17 tasks at posttest
(see Table A1 in the Appendix). As these data were not missing at random, we refrained from
imputing those data and instead excluded the affected participants listwise from analyses
including those measures. Seven participants (1 in the active control and 6 in the binding
participants) or 18 (1 participant) sessions. Only participants with complete training data sets
were included in the analyses of training progress and motivation. Three participants (one of
each group) did not complete the questionnaire at the end of training; hence, these participants
were excluded from the analyses of training-related expectations strategy usage.
Results
Data and scripts for running the analyses are available on the Open Science
Framework (https://osf.io/fy5ku). Descriptive statistics and reliabilities for each outcome
measure as a function of group and time are listed in Table A2 in the Appendix; between-task
correlations at pretest and posttest are listed in Table A3 in the Appendix.
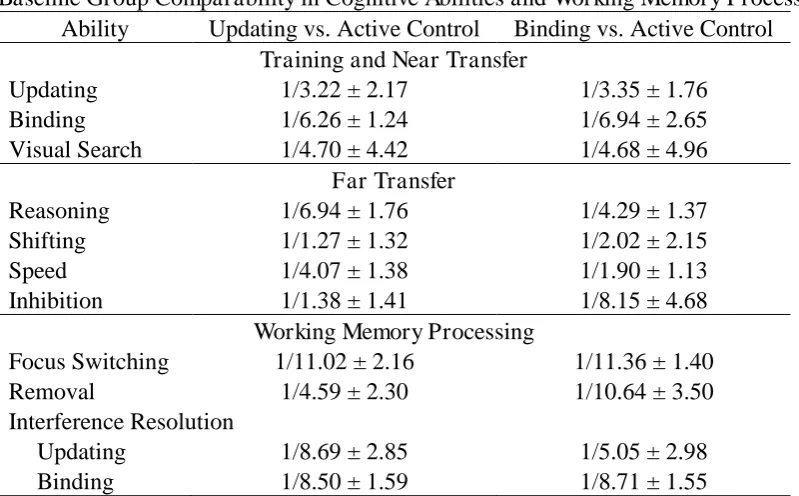
Baseline Comparability
We compared pretest performance of each experimental group with the active control
group for each ability (Table 4). The evidence consistently supported the absence of baseline
differences but was ambiguous in some instances. Specifically, at pretest, the active control
group tended to show larger shifting switch costs than both experimental groups, longer RTs
in the speed tasks than the binding group, and to slightly larger interference costs in the
inhibition tasks than the updating group. Moreover, evidence consistently supported the
absence of baseline difference in all updating response types, binding probe types, and
binding bias (BFH1 ≥ 1/3.41) but was ambiguous for updating extra-list errors, BFH1 ≥ 1/2.02 ±
1.96%, with extra-list errors tending to be higher in the active control group than in the
updating group. Therefore, we cannot exclude that some level of regression to the mean may
have occurred for these outcomes. To reduce the impact of those baseline differences, we
used standardized gain scores (i.e., mean of posttests scores minus mean of pretest scores
divided by the pretest standard deviation; cf. Guye & von Bastian, 2017; von Bastian &
Table 4
Baseline Group Comparability in Cognitive Abilities and Working Memory Processing Ability Updating vs. Active Control Binding vs. Active Control
Training and Near Transfer
Updating 1/3.22 ± 2.17 1/3.35 ± 1.76
Binding 1/6.26 ± 1.24 1/6.94 ± 2.65
Visual Search 1/4.70 ± 4.42 1/4.68 ± 4.96
Far Transfer
Reasoning 1/6.94 ± 1.76 1/4.29 ± 1.37
Shifting 1/1.27 ± 1.32 1/2.02 ± 2.15
Speed 1/4.07 ± 1.38 1/1.90 ± 1.13
Inhibition 1/1.38 ± 1.41 1/8.15 ± 4.68
Working Memory Processing
Focus Switching 1/11.02 ± 2.16 1/11.36 ± 1.40
Removal 1/4.59 ± 2.30 1/10.64 ± 3.50
Interference Resolution
Updating 1/8.69 ± 2.85 1/5.05 ± 2.98
Binding 1/8.50 ± 1.59 1/8.71 ± 1.55
Note. Values are Bayes factors in favor of the alternative hypothesis and their estimation error (%).
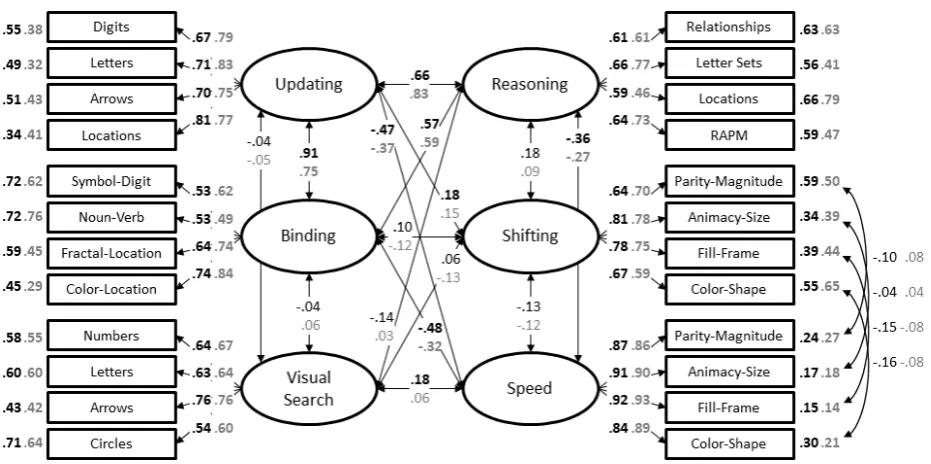
Evaluation of the Theoretical Transfer Model
To evaluate the theoretical transfer model, we conducted a latent-variable CFA. We
first examined the proposed factor structure of seven correlated but separate cognitive abilities
(i.e., updating, binding, visual search, reasoning, shifting, and general speed) by fitting the
model to the data from all participants (excluding those with incomplete data) simultaneously
at pretest (N = 185) and posttest (N = 180). While imposing the same factorial structure at
both times of assessment (i.e., configural invariance), factor loadings, intercepts, and residual
variances were allowed to vary freely between pretest and posttest. Likely due to their low
zero-order correlations (see Table A3 in the Appendix), the four inhibition measures did not
converge to a latent factor at neither time of assessment. We therefore excluded the inhibition
factor from the model. The model including the remaining six factors for updating, binding,
visual search, reasoning, shifting, and general speed fit the data reasonably well, 2(466) =
740.43, p < .001, CFI = .93, RMSEA = .06 [.05; .06], SRMR = .06. As depicted in Figure 2,
significant variance and correlations between the latent factors were significant, except for
visual search, which showed no significant relation to any other factor except general speed at
pretest. More specifically, at pretest, the two working memory factors, updating and binding,
were strongly related (coefficient estimate = .91), and both factors showed moderate
correlations with reasoning (coefficient estimates = .66 and .57, for updating and binding,
respectively). At posttest, the pattern was the same, but the correlation between updating and
binding was lower (coefficient estimate = .75), and the correlations to reasoning were stronger
(coefficient estimate = .83 and .59, for updating and binding, respectively). As expected, the
updating, binding, and reasoning factors were moderately related to general speed, with
coefficient estimates between -.36 and -.48 at pretest, and between -.27 and -.37 at posttest.
Furthermore, updating showed a weak, but significant correlation with shifting at pretest
(coefficient estimate = .18) which was nonsignificant at posttest (coefficient estimate =
[image:32.595.70.536.452.684.2]-.15).
because they originated from the same tasks. Note that lower values reflect better performance for visual search (i.e., lower residual search costs), shifting (i.e., lower task switching costs), and speed (i.e., shorter reaction times).
To examine whether the differences between the pretest and posttest model were
statistically significant, we tested for measurement invariance across pretest and posttest. We
first tested for weak invariance by constraining factor loadings to be equal across time, and
compared the model fit to the baseline model with configural invariance by inspecting the
differences in CFI and RMSEA in addition to running 2 difference tests (cf. Cheung &
Rensvold, 2002). The loss in model fit caused by constraining factor loadings to be equal was
negligible, 2= 10.05, df = 18, p = .930, CFI < .01, RMSEA < .01. Next, to test for
strong invariance, we additionally constrained the intercepts to be equal across time, which
again did not result in a significant loss of fit, 2= 0.78, df = 18, p > .999, CFI < .01,
RMSEA < .01. Finally, we tested for strict invariance by additionally constraining the
residuals to be equal across time. The loss in fit was again non-significant, 2 = 28.32, df =
24, p = .247, CFI < .01, RMSEA < .01.
As we were able to establish strict measurement invariance, we next tested whether
covariances and variances of the latent variables were also invariant across pretest and
posttest. The loss of fit was non-significant, 2= 14.56, df = 15, p = .483, CFI < .01,
RMSEA < .01. Finally, the loss in fit from constraining the latent factor variances to be
equal was also negligible, 2 = 4.13, df = 6, p = .659, CFI < .01, RMSEA < .01.
Overall, this final model produced a slightly better fit than the configural baseline model,
2(547) = 798.27, p < .001, CFI = .94, RMSEA = .05 [.04; .06], SRMR = .06. Hence, the most
parsimonious model with strict measurement invariance with additional invariance of latent
factor covariances and variances was retained, rendering the pretest to posttest differences in
Summary. The CFA supported the theoretical assumption that updating and binding
are highly correlated abilities unrelated to visual search. Following the rationale that transfer
is driven by functional overlap between abilities, the factor correlations observed in our
pretest and posttest data suggest that transfer is most likely to occur from one WM training
intervention to the other (i.e., near transfer), followed by transfer to reasoning and speed (i.e.,
far transfer). In contrast, it should be unlikely that transfer from WM training to shifting and
visual search would occur. Similarly, as we found only little shared variance between the
visual search latent factor shares and all other latent factors, visual search training should have
little impact on performance in tasks measuring any of the other abilities.
Training Performance and Motivation
To investigate performance gains over the course of the 20 training sessions, we ran
Bayesian LMEs for each group using the set size (coded as linear contrast) achieved by the
end of each training session as dependent variable, session as fixed effect, and participant and
task as random effects. The reported estimates are means of the sampling from the posterior
distribution with 10,000 iterations and reflect the increase in set size from one session to the
next one alongside their 95% credible interval. As Figure 4 shows, all three groups improved
substantially over the course of the 20 sessions. Evidence for monotonic increases in
performance was decisive for the updating group, MDiff = 0.09 [0.09, 0.09], BFH1 > 100 ±
1.22%, for the binding group, MDiff = 0.10 [0.10, 0.11], BFH1 > 100 ± 1.80%, and for the
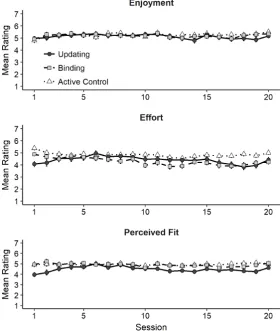
We next evaluated motivation during training by running a Bayesian LME for each of
the motivation measures assessed at the end of each session (i.e., enjoyment, effort and
perceived fit between task difficulty and ability) as dependent variable, group (updating,
binding, and active control) and the linear contrast of the 20 sessions as fixed effects, and
participant as random effect. As Figure 5 illustrates, the three groups rated their average
enjoyment similarly, with strong evidence supporting the absence of an effect of group, BFH1
= 1/30.11 ± 2.14% as well as the absence of an effect of session, BFH1 = 1/25.99 ± 1.78%.
Evidence was ambiguous regarding the interaction between group and the linear contrast of
session, BFH1 = 1.98 ± 2.18%, with the updating group showing a stronger drop in enjoyment
ratings than the active control towards the end of training, BFH1 = 32.29 ± 4.38%.
For the self-reported effort spent on training, evidence was decisive in favor of a linear
effect of session, BFH1 > 100 ± 1.32%, indicating that effort ratings decreased over time. In
addition, there was strong evidence in favor of a Group x Session interaction, BFH1 = 16.55 ±
1.55%. Following up on this interaction, we found that the active control group’s ratings
remained more stable over the course of training relative to the binding group, BFH1 > 100 ±
4.17%, but were similar to those of the updating group, BFH1 = 1/7.74 ± 2.40%.
Finally, there was ambiguous evidence tending to favor an effect of group on the
ratings of perceived fit between task difficulty and individual ability, BFH1 = 2.02 ± 5.16%,
caused by the slightly lower average ratings in the updating group relative to the active
control group, BFH1 = 5.15 ± 14.10%. There was no effect of session, BFH1 = 1/6.36 ± 5.12%,
Figure 5. Motivation measures across the 20 training sessions as a function of group. Error bars denote 95% confidence intervals for within-subjects comparisons calculated according to Cousineau (2005) and Morey (2008).
Training-related expectations. To check whether the three training paradigms
elicited different expectations that could affect posttest performance, we analyzed
participants’ ratings of subjective gains after the training intervention (see Table 5). Overall,
Table 5
Training-Related Expectations as a Function of Transfer Range
Group M (SD) Pairwise Comparisons (BFH1 ± Error) Range Updating Binding AC Updating vs. AC Binding vs. AC Training 3.81 (0.78) 3.88 (0.89) 3.69 (0.90) 1/3.96 ± 0.03 1/2.79 ± 0.00
Transfer 2.31 (1.16) 2.63 (1.22) 2.42 (1.09) 1/4.58 ± 0.05 1/3.29 ± 0.00
Everyday 1.81 (0.40) 1.89 (0.31) 1.89 (0.32) 1/2.68 ± 0.01 1/5.42 ± 0.00 Note. Participants rated their subjective gains on a scale from 1 (not at all) to 5 (very). AC = active control.
Summary. All three training groups showed substantial performance improvements
across the 20 sessions. Motivation ratings were overall relatively similar, except that the
updating group rated their intervention as somewhat less enjoyable towards the end of
training, and the perceived fit between task difficulty on average as less optimal than the
active control group. In addition, the reduction in self-reported effort spent over time was
more pronounced in the binding group than in the active control group. Nevertheless,
training-related expectations were relatively similar across groups.
Training and Transfer Gains
To evaluate whether training induced changes in cognitive performance, we compared
the performance gains from pretest to posttest in each WM training group to those observed
for the active control group using Bayesian LMEs across each of the four tasks measuring the
same ability.1 Results are summarized in Table 6 and illustrated in Figure 6.
1 It would have been desirable to analyze those gains on the latent level within a structural-equation
Table 6
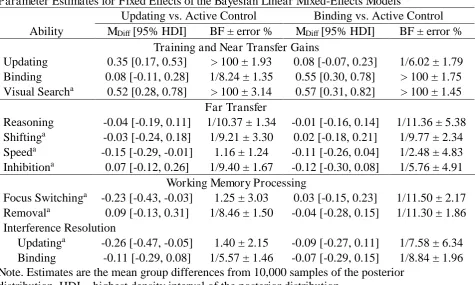
Parameter Estimates for Fixed Effects of the Bayesian Linear Mixed-Effects Models
Updating vs. Active Control Binding vs. Active Control Ability MDiff [95% HDI] BF ± error % MDiff [95% HDI] BF ± error %
Training and Near Transfer Gains
Updating 0.35 [0.17, 0.53] > 100 ± 1.93 0.08 [-0.07, 0.23] 1/6.02 ± 1.79 Binding 0.08 [-0.11, 0.28] 1/8.24 ± 1.35 0.55 [0.30, 0.78] > 100 ± 1.75 Visual Searcha 0.52 [0.28, 0.78] > 100 ± 3.14 0.57 [0.31, 0.82] > 100 ± 1.45
Far Transfer
Reasoning -0.04 [-0.19, 0.11] 1/10.37 ± 1.34 -0.01 [-0.16, 0.14] 1/11.36 ± 5.38 Shiftinga -0.03 [-0.24, 0.18] 1/9.21 ± 3.30 0.02 [-0.18, 0.21] 1/9.77 ± 2.34 Speeda -0.15 [-0.29, -0.01] 1.16 ± 1.24 -0.11 [-0.26, 0.04] 1/2.48 ± 4.83 Inhibitiona 0.07 [-0.12, 0.26] 1/9.40 ± 1.67 -0.12 [-0.30, 0.08] 1/5.76 ± 4.91
Working Memory Processing
Focus Switchinga -0.23 [-0.43, -0.03] 1.25 ± 3.03 0.03 [-0.15, 0.23] 1/11.50 ± 2.17 Removala 0.09 [-0.13, 0.31] 1/8.46 ± 1.50 -0.04 [-0.28, 0.15] 1/11.30 ± 1.86 Interference Resolution
Updatinga -0.26 [-0.47, -0.05] 1.40 ± 2.15 -0.09 [-0.27, 0.11] 1/7.58 ± 6.34 Binding -0.11 [-0.29, 0.08] 1/5.57 ± 1.46 -0.07 [-0.29, 0.15] 1/8.84 ± 1.96 Note. Estimates are the mean group differences from 10,000 samples of the posterior
distribution. HDI = highest density interval of the posterior distribution.
aNegative mean group differences reflect greater performance gains in the experimental
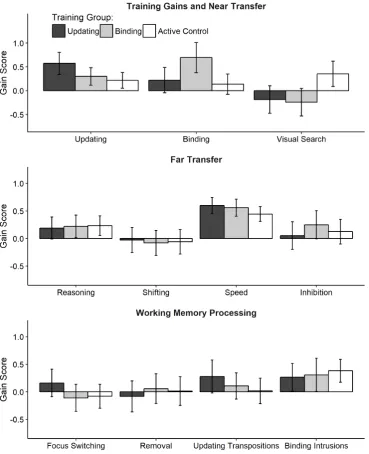
Figure 6. Gains from pretest to posttest in the trained tasks, structurally different working memory tasks (near transfer; both in top panel), working memory mechanisms (middle panel), and other but related abilities (far transfer; bottom panel). For illustration purposes, scores were averaged across the four tasks administered per ability and reverse-coded so that higher values correspond to greater performance gains. Error bars denote 95% confidence intervals.
Training gains. Evidence in favor of training effects from pretest to posttest for all
three training groups was substantial to decisive (see top panel of Figure 6). Compared to the
active control group, the updating group showed larger gains in updating, BFH1 > 100 ±
Similarly, the active control group showed larger gains in visual search than the updating
training group, BFH1 > 100 ± 3.14%, and the binding group, BFH1 >100 ± 1.45%.
Near transfer. Despite the large correlation between updating and binding on the
latent level, and despite the large training effects, the evidence favored the absence of near
transfer effects from updating training to binding, BFH1 = 1/8.24 ± 1.35%, as well as from
binding training to updating, BFH1 = 1/6.02 ± 1.79%.
Far transfer. In line with the absence of near transfer, we found no far transfer effects
on reasoning, shifting, speed, and inhibition (see middle panel of Figure 6), although some of
these abilities correlated at least moderately with updating and binding at pretest. The absence
of far transfer was largely supported by substantial to strong evidence (ranging between
1/5.76 ± 4.91% and 1/11.36 ± 5.38) except for speed, for which the evidence was ambiguous
(updating: BFH1 = 1.16 ± 1.24%; binding: BFH1 = 1/2.48 ± 4.83%).
WM processing. Next, we investigated group differences in gain scores for focus
switching, removal, and interference resolution (see bottom panel of Figure 6). To examine
effects on focus switching, we analyzed object-switching costs derived from the updating
tasks. The updating group tended towards improved focus switching, but the evidence was
ambiguous, BFH1 = 1.25 ± 3.03%. The evidence strongly supported the absence of effects in
the binding group, BFH1 = 1/11.50 ± 2.17. The evidence also favored the absence of any
training-specific improvements in the removal of information from WM (updating training:
BFH1 = 1/8.46 ± 1.50%; binding training: BFH1 = 1/11.30 ± 1.86%).
To examine whether training improved interference resolution, we analyzed the
proportion of transposition errors made at recall in the updating tasks, and the accuracy to
intrusion probes in the binding tasks. There was a trend that updating training reduced the
proportion of transposition errors, but the evidence was ambiguous only, BFH1 = 1.40 ±