Offshore migration of coastal sand bars at Wanganui, New Zealand : a thesis presented in partial fulfilment of the requirements for the degree of Doctor of Philosophy in Geography at Massey University, Palmerston North, New Zealand
305
0
0
Full text
(2) Offshore migration of coastal sand-bars at Wanganui, New Zealand. A. presented in of. fulfilment. requirements. D:::)Ctor. the ae<:1T€:e. Philosophy in. Geography. at North, New Zealand. Roger Duncan. "-'uc>.uu.. March 2000.
(3) MASSEY UNIVERSITY LffiRARY Thesis Copyright Conditions. Title of thesis:. 1.. 2.. 3.. Offshore migration of coastal sand-bars at Wanganui, New Zealand. I give permission for my thesis to be made available to readers in the Library at. Massey University under the conditions determined by the Librarian.. I agree that my thesis may be sent to another institute on temporary loan under. conditions determined by the Librarian.. I agree that my thesis may be copied for Library use only if published copies are. not available through the Geography Department.. Signed. ---".!2d "' � ----L/. =-=--'-=.. � __ _. The Library Massey University Palmerston North New Zealand. The copyright of thesis belongs to the author. All readers must sign their name in the space below to show that they recognise this. They are asked to add their permanent address. Name and Address. Date.
(4) III. The mystery of the universe, the layer �n layer of new meaning and new discovery, will never be revealed to those who do not look for it. Veitch. (1990).
(5) v. ABSTRACT. Net offshore bar migration (NOM) refers to the systematic seaward migration of coastal sand-bars across the surf zone. and disappear in the outer surf zone. been described as cyclic.. These bars fonn near the shore-line NOM behaviour is repetitive and has. OVer the past decade NCM has been recognised on the. North Carolina coast, the Dutch coast and by the author on t�e west coast of the New Zealand North Island.. The aLm of this project is to elaborate on the. behaviour and causative processes of NOM.. The New Zealand data used in this study comprise a 6.3 year bar-crest record from an approximately six kilometre long field site at Wanganui.. These. data were collected using aerial and terrestrial photography and supplemented w ith ground surveys. Image processing techniques were developed for photo graphic data abstraction and analysis.. Published data from the other 'global'. NOM sites were analysed and compared after data compatibility procedures had been developed and applied.. The NCM cycles were quantified using parameters. for NCM width (cross-shore migration distance), duration and rate, together with return period.. The global NCM sites are characterised by multiple sand-bars, the pre dominance of sea waves and a narrow band of stonn strength wind and wave con ditions.. The longer-tenn (average cyclic) parameter values for the global. data-set were as follows: NOM width ranged between 195 and 930 m; duration ranged between 1.2 and 13 years; NCM rate ranged between 35 and 196 m/yr, and NCM return period varied between 1.2 and 14.4 years.. NCM characteristics for. the global sites were found to be correlated with cross-shore slope, coastal orientation and extreme wave height.. The Wanganui bar-crest data were also analysed for shorter-tenn (within cycle) bar behaviour.. Cross-shore bar migrations had a bimodal frequency. distribution. The group of larger migrations, ter:rned 'episodic seaward jumps' , significantly influenced the characteristics of individual NOM cycles. Episodic seaward jumps appear to be preceded by the degeneration of the adja cent seaward bar.. Longshore non-synchronous variation in NOM characteristics. were found to be mainly related to 'bar switching' (longshore bar realign ment).. Based on the above results, a conceptual rrorphodynamic model for NOM was fonnulated. a. The model incorporates three main components: a drive mechanism;. rrorphodynamic modification mechanism; and a timing mechanism..
(6) Net offshore bar migration is a significant mode of morphological behaviour within the surf zone .. Its influence upon other aspects of coastal. geomorphology such as shoreline change, and its relationship with existing 'beach-state' based models,. require further investigation..
(7) vii. ACKNOWLEDG EMENTS. First I wish to thank my main supervisor, Dr Mike Shepherd, who introduced me to the fascinations of coastal geomorphology.. My world quickly became a. different place as the continuous and multi-scaled changes which charac terise the coastal environment were revealed.. I hope that I am also able. to open the eyes of others to see the wonders of this world.. Thanks Mike. for your patience and help in dealing with the numerous obstacles I faced.. Professor Bob Kirk, now Pro-Vice Chancellor of Research at the Univer sity of Canterbury, played a vital role in keeping the project on track with his astute overview and insistence on coherence, clarity and adherence to the principles of scientific research - thanks Bob.. The project relied upon the imaging system VIPS, devised by Dr Don Bailey as part of his own PhD.. I well remember wandering into Don's office. with the Lippmann and Holman ( 1989) seminal paper on obtaining morpho logical bar-crest data from photographs and video, handing and then asking if he could do this sort of thing. this was a silly question to ask an engineer!. him. the paper. In hindsight I realised. Don willingly adapted his. operating system to processing my surf zone photos and providing the bar crest data for. my. subsequent geomorphological analysis.. Don became a sec. ondary supervisor and his advice concerning mathematics, statistics, physics and imaging were greatly appreciated.. The National Institute of. Water and Atmospheric Research (NIWA) subsequently commissioned Don to mod ify some of the algorithms for use in a national video-based automated coastal monitoring system.. Assistance with data and error analysis from Drs S. Ganesalingam and T. Moore of the Massey University Statistics Department is acknowledged.. I wish to thank Professor Rob Holman (Oregon State University) for the initial time-lapse photographic equipment and suggestions on how to go about developing techniques for its use.. Thanks also to Drs Gerben. Ruessink (Utrecht University) and Phil Osborne (Auckland University) for guidance on preparing papers for publication and to Professor Andy Short (Sydney University) for his instruction on coastal morphodynamics.. Funding and field support for the project came from many sources.. I. acknowledge with thanks the Massey University input: the Post Graduate Research Fund; the Massey University Research Fund; the Special Vice Chan cellor Grant, and financial and equipment support from the Geography Department (now incorporated within the School of Global Studies) ..
(8) viii. Organisations in Wanganui were also very supportive .. The Wanganui Port. Company, the Wanganui District Council and the local NIWA office provided survey equipment and labour .. The Wanganui Surf Lifesaving club provided. inflatable craft and highly skilled operators.. Thanks to all of you -. especially for braving winter days when conditions were marginal.. Finally, I wish to give special thanks to my parents who helped me develop an enquiring mind and acquire practical skills for problem solving, and also to my wife Sus an and to my family and friends who for so long put up with me as I struggled through a proj ect that, no end.. at times,. You all supported me in so many ways - thank you.. seemed to have.
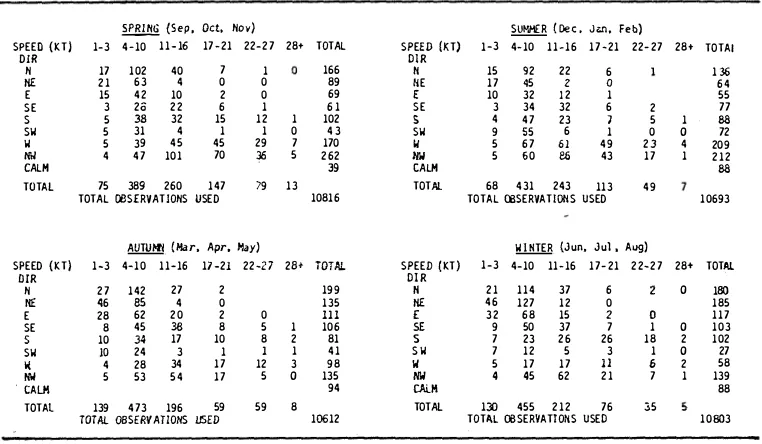
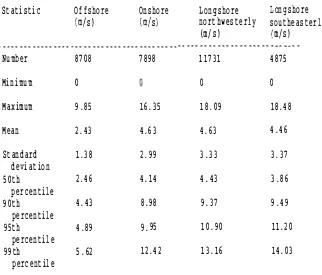
(9) ix. TABL E OF CONTENTS. Title page. i. Frontispiece. iii. .Abstract. v. Acknowledgements. vii. Table of Contents. ix. List of Figures. xiii. List of Tables. xvii. List of Appendices. xiv. Chapter 1. Introduction. 1.1. Rationale. 1. 1.2. Background. 5. 1.3. Approach. 8. 1 . 3.1. Conceptual framework. 8. 1.3.2. Data collection issues. 13. 1.4. Objectives and thesis outline. Chapter 2 2.1 2.2. 2.3. 2.4. 2.5. 2.6. 15. '!he field site. Introduction. 17. Geomorphological setting. 18. 2 . 2.1. General background. 18. 2.2.2. Jetties and morphological influence. 25. Morphology. 30. 2 . 3.1. Cross-shore morphology. 30. 2 . 3.2. Plan-view morphology. 39. 2.3.3. Rivermouth morphology. 40. Sediment. 40. 2.4.1. Textural characteristics. 40. 2.4 . 2. Mineralogy. 43. 2 . 4. 3. River sediment. 44. Process regime. 44. 2.5.1. Surface waves. 44. 2.5.2. Wind. 59. 2. 5 . 3. Longshore currents. 59. 2. 5 . 4. River hydrodynamics. 63. Relevance for NOM. 63.
(10) x. Chapter. Morphological methods. 3. 3.1. Introduction. 65. 3.2. I mage-based data. 66. 3.2.1. Field data. 66. 3.2.2. Image processing. 74. 3.2.3. VIPS. 76. 3.2.4. Data processing algorithms. 76. 3.2.5. Data-sets. 80. 3.2.6. Data analysis algorithms. 82. 3.2.7. I nterpretation of intensity output. 85. 3.3. 86. Ground profile data. 3.3.1. Field data. 86. 3.3.2. Data processing. 91. 3.3.3. Data-sets. 91. 3.3.4. Data analysis. 92 92. Stmma ry. 3.4. Chapter 4. Evaluation of rror:phological nethods. 4.1. I ntroduction. 95. 4.2. Errors. 96. 4.2.1. Definitions and concepts. 96. 4.2.2. MUltiple errors. 98. 4.3. 99. Image-based errors. 4.3.1. Environmentally associated errors. 99. 4.3.2. Photogrammetric errors. 116. 4.3.3. Longshore and cross-shore resolution. 121. 4.4. Ground profile errors. 129. 4.5. I ntensity and ground profile comparison. 131. 4.6. Stmmary and conclusions. 136. Chapter. 5. lJon:Jer-tenn aspects of. NCM. 5.1. Introduction. 141. 5.2. Study sites. 147. 5.3. Methods. 151. 5.4. 5.5. 5.3.1. Data acquisition methods. 151. 5.3.2. Methods of analysis. 153. Wanganui sites. 157. 5.4.1. Results. 157. 5.4.2. Discussion. 162. Global sites. 164. 5.5.1. Results. 164. 5.5.2. Discussion. 170. 5.6. Conceptual modelling. 178. 5.7. Stmmary and conclusions. 180.
(11) xi. Chapter 6. Short.er-tenn. aspects of. NCl:1. 6.1. Introduction. 183. 6.2. Cross-shore bar migration. 189. 6.3. 6.4. 6.5. 6.2.1. Methods. 189. 6.2.2. Results. 191. 6.2.3. Discussion. 195. Episodic offshore bar migration. 201. 6.3.1. Methods. 201. 6.3.2. Results. 204. 6.3.3. Discussion. 211. Morphological behaviour. 216. 6.4.1. Methods. 216. 6.4.2. Results. 216. 6.4.3. Discussion. 220. Bar switching. 220. 6.5.1. Methods. 221. 6.5.2. Results. 222. 6.5.3. Discussion. 228. 6.6. Conceptual modelling. 230. 6.7. Summary and conclusions. 231. Chapter 7 7.1. 7.2. NOM:. Conclusions. objectives. 237. 7.1.1. Image-based data acquisition. 238. 7.1.2. Longer-term NOM characteristics. 239. 7.1.3. Shorter-term NOM characteristics. 240. 7.1.4. A conceptual model of NOM:. 241. Further research. 243. 247 263.
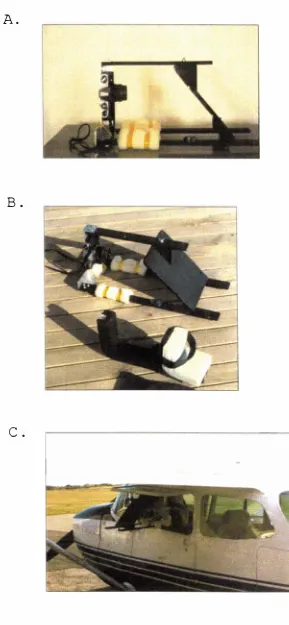
(12) xiii. L IST OF FIGURES. 1. 1. Location maps of (global) NOM sites at mid 1991. 3. 1. 2. Published NOM data for (global) sites at mid 1991. 4. 1. 3. Additional Wanganui bar-crest time-series 1990/1991. 6. 1. 4. Schematic representation of a coastal rnorphodynarnic system. 8. 1. 5. Space and time scales for coastal rnorphologies and. 10. associated processes 1. 6. Schematic representation of morphological changes at a. 11. range of temporal scales 1. 7. Cross-shore profiles at transects T150 , T500,. 15. T1500, T3000, T4000 and T5000. 2. 1. Regional setting of study area. 19. 2. 2. Structural geoloqj affecting the study area. 20. 2. 3. Construction of the northwestern river jetty. 20. 2. 4. Photographs of the study area. 22. 2. 5. Offshore profiles at cross-shore transects T200, T1500 and. 24. T5000 2. 6. Shoreline change at T150 during the period 1876 to 1992. 24. 2. 7. Rates of shoreline change along the Wanganui coast, 1876 to. 27. 1983 2. 8. Bathymetric chart (23. 1. 68) of river entrance. 27. 2. 9. Mean annual minimum depths at river entrance, 1926 to 1992. 29. 2.10. Cross-shore profiles at T150, 1879 to 1992. 29. 2. 11. Cross-shore profile bundles for transects T200, T1500 and. 32. T5000 2. 12. Morphological features and terminology. 33. 2. 13. Cross-shore zonal nomenclature. 34. 2. 14. Cross-shore mean profiles and fitted power curves. 35. 2. 15. Cross-shore standard deviations for profile bundles. 36. 2. 16. Alongshore sediment parameter values. 41. 2. 17. Cross-shore sediment parameter values. 42. 2.18. Classification of surface waves. 45. 2. 19. Field method for 'line-of sight' wave height measurement. 45. 2. 20. Probability of exceedence curves for wave height data sets. 47. 2. 21. Wave height variation at Wanganui during the study period. 51. 2. 22. Examples of wave spectra for offshore wave data. 54. 2. 23. Frequency spectra from a three hour run-up record. 54. 2. 24. Time-series of seiche activity at Wanganui. 57. 2. 25. Wind rose for Wanganui Airport data. 60. 3. 1. Field equipment used for aerial photography. 67. 3. 2. Example of a vertical aerial photograph. 69.
(13) xiv. 3.3. Example of an oblique aerial photograph. 69. 3.4. Field equipment for oblique terrestrial photography. 71. 3.5. An example of profile bathymentry and intensities from Duck. 72. 3.6. Examples of instantaneous and time-exposure photographs of. 73. the study area. 3. 7. An example of a video frame from the central study area. 73. 3.S. Examples of rectified aerial and terrestrial output images. 77. 3.9. An example of a time-averaged intensity profile taken from. SO. video images. 3. 10. Examples of rectified and straightened time-exposure output. 81. images. 3.11. An example of m::mitor display for the algorithm PFIT. VIP. 83. 3.12. Exfu�les of time-stack Lmages. 83. 3.13. Equipment used for nearshore hydrographic surveys. 87. 3.14. Equipment used for offshore hydrographic surveys. 89. 3.15. Equipment used for foreshore profile surveys. 90. 3.16. Illustration of the. lnaximum residual method'. of bar-crest. 93. detection. 4.1. Illustration of different error concepts and characteristics. 97. relevant to the study site. 4.2. Method used to determine seiche influence on intensity maxima. 102. location. 4.3. An example of tidal influence on intensity maxima location. 107. 4.4. An example of wave height variation on intensity maxima loca. 110. tion. 4.5. Cross-shore correlation function plots for longshore inten. 112. sity maxima associated with different wave heights. 4.6. Intensity maxima offset errors associated with breaking wave. 118. height study area. 4.7. Distribution of random rectification errors across the study. 122. area. 4.8. Longshore resolution lengths for rectified terrestrial and. 123. aerial images. 4.9. Cross-shore resolution lengths for rectified terrestrial and. 126. aerial images. 4.10. Error surface between rectified terrestrial and aerial images. 128. 4.11. Comparison between time-averaged ground profiles and time. 132. averaged intensity profiles. 4.12. Plot and fitted curve for the differences between ground. 134. profile bar-crests and corresponding intensity maxima. 5.1. Location maps for global NOM sites. 143. 5.2. Bar-crest time-stacks for Wanganui sites. 144.
(14) xv. 5. 3. Bar-crest time-series for global NOM sites. 145. 5. 4. Diagrammatic representation of the parameters used to define. 155. NOM. 5. 5. Bar-crest generation and degeneration locations and bound. 155. aries for the zone of systematic offshore migration. 5. 6. Illustration of methods used to determine the time that. 158. bars underwent systematic offshore bar migration. 5. 7. Linear trend lines fitted to each NOM for the Wanganui sites. 160. 5. 8. NOM parameter values for the Wanganui sites. 161. 5. 9. Longshore linear trend lines for mean NOM parameter values. 163. at the Wanganui sites. 5. 10. Mean NOM parameter values for the global sites. 165. 5. 11. Pearson correlation analysis results for mean NOM parameter. 166. values from the NOM sites. 5. 12. Plots of NOM duration with sediment size and cross-shore slope. 169. at the global sites. 5. 13. Non-linear relationships between angle of wind approach with. 171. NOM duration and angle of energy approach with relative strength of longshore energy component. 5.14. Conceptual rnorphodynamic modelling for longer-term aspects. 179. of NOM. 6. 1. Examples of bar bifurcation, bar switching and oblique bar. 186. undergoing longshore translation. 6.2. Bar-crest location time-series for sites T1600 and T5000. 192. 6.3. Bar migration distance histograms for sites T1600 and T5000. 194. 6.4. Bar migration distance versus inter-survey � wave. 196. height at T1600 and T5000. 6. 5. Episodic seaward bar migrations plotted on bar-crest migra. 197. tion time-series for sites T1600 and T5000. 6. 6 6. 7. Illustrations of episodic and regular modes of bar migration. 198. Classification scheme for morphological behaviour of the sea. 203. ward bars relative to episodic offshore bar migrations. 6. 8. Migration start location and migration distance for epi. 205. sodic seaward bar migrations. 6. 9. � wave height, storm duration and longshore wind. 208. speed for episodic seaward bar migrations. 6. 10. Plots and analysis of migration distance and start loca. 210. tion for episodic seaward bar migrations versus � wave height, storm duration and longshore wind speed. 6. 11. Diagramma tic illustration of outer bar control concept. 214. 6. 12. Examples of the four classes of morphological behaviour. 218. associated with episodic offshore bar migrations at Wanganui.
(15) xvi. 6 . 13. Plots o f morphological behaviour versus :maximum wave height,. 219. storm duration and longshore w ind speed 6.14. Plot of l ongshore location versus time for episodes of bar. 222. switching 6 . 15. Image sequence depi cting bar switch episode 7 and time. 223. stacks depicting the associated cross-shore bar migration 6.16. Bar migration rates for examples of positive and negative. 225. bar switching 6.17. Time-series for bars at T2800 and T 5 0 0 0 whi ch underwent positive and negative switching associated with episode 7. 227.
(16) xvii. LIST OF TABLES. 1.1. Average durations and rates of NOM at global sites,. 2. 1. Cross-shore profile zone boundaries and depths. 38. 2. 2. Cross-shore profile zone widths and slopes. 38. 2. 3. Wave height statistics. 47. 2.4. Wave period statistics. 53. 2. 5. Significant wave height and peak spectral wave period distri. 53. mid 1991. 7. butions. 2.6. Seasonal wind frequency distribution. 60. 2.7. Cross-shore and alongshore wind speed components. 61. 2. 8. Longshore current statistics. 61. 4. 1. Descriptive statistics for environmental parameter values. 101. at times of photographic sampling. 4. 2. Observed and predicted seiche wave heights. 104. 4. 3. Variation of cross-shore intensity maxima location for dif. 106. ferent longshore segment widths associated with the environ mental conditions experienced during photographic sampling. 4. 4. Descriptive statistics for tide-influenced intensity maxima. 108. variation. 4.5. Descriptive statistics for wave height-influenced intensity. 108. maxima variation. 4.6. Photogrammetric errors for rectified terrestrial and aerial. 117. photographs. 4.7. Rectification errors associated with input parameter measure. 120. ment precision. 4.8. Errors associated with ground profile data acquisition. 130. 4. 9. Time-averaged bar-crest data from ground profiles and inten. 134. sity profiles. 5. 1. Morphological and sediment characteristics for global NOM. 149. sites. 5.2. Energy characteristics for global sites. 149. 5.3. Details of data collection systems used at NOM sites. 152. 5.4. Maximum likely cross-shore distances traversed during. 158. successive seaward bar migrations. 5.5. Pearson correlation matrices for NOM duration with morpho. 168. logical, sediment and process variables. 5.6. Average NOM durations and bar volumes for global NOM sites. 177. 6. 1. Descriptive statistics for inter-survey bar-crest migrations. 193. 6.2. Descriptive statistics for episodic seaward bar migration. 206. start distances and migration distances.
(17) xviii. 6.3. Descriptive statistics for energy parameter values assoc. 209. iated with episodic seaward bar migrations. 6.4. Classification results for seaward bar behaviour associated. 212. with episodic offshore bar migrations. 6.5. Episodic seaward bar migrations associated with different. 217. types of morphological behaviour. 6.6. NOM parameter values for selected bars at T2800 and TSOOO which were associated with switch episode 7. 228.
(18) rix. LIST OF APPENDICES. A. Conceptual surf zone models. 263. B. Littoral drift estimates for the Wanganui coast. 265. C. Shoreline change background information. 267. D. Ground profile data-sets. 269. E. Mineralogy of beach sediment. 271. F. Line-of-sight wave height data. 273. G. Oblique terrestrial rectification algorithm ETM_MAIN .VIP. 275. H. Rectified images used in this study. 281. I. Environmental conditions during error assessment sampling. 293. J. Ground profile bar-crest data for site T1500. 295.
(19) 1. CHAPTER 1. INTRODUCTION. When your work takes you to the frontier there are no r eliable maps and those tha t exist may be as misleading as they are helpful.. Veitch (1995).. 1.1. Rationale for this s tudy. Sand-bars are morphological features found on many of the world's sandy shorelines.. Hardisty (1990) estimates that at least one third of the. world's coastlines are sand-dominated and characterised by gently curving cross-shore profiles and plan shapes.. Often superimposed upon this overall. morphology are undulations on the sea-bed which are referred to as sand bars.. Sand-bars are usually aligned parallel to the shoreline and occur. either singly or in multiple fonn.. The morphological configuration and. behaviour of sand-bars are a product of mutual interaction between fluid motions, material properties and surface fonns. (Wright and Thorn, 1977).. As. the world's sandy coasts have numerous combinations of energy regime, sediment characteristics and geometry, a wide range of beach types occur. This thesis focuses on a coast characterised by multiple sand-bars, moderate levels of wave and tidal energy, and longshore currents. Geomorphological surf zone models encorrpass a range of morphological configurations which are related to different environmental conditions.. The. earliest and simplest model involves two morphological configurations, both of which are unifonn in the longshore direction.. Beach morphology. oscillates between a gently sloping or 'dissipative' profile with a seaward bar, and a steep faced or 'reflective' profile characterised by a landward (berm) terrace.. Under fairweather conditions the bar migrates shoreward to. fonn the benn while under stonn conditions it is destroyed and a new bar refonns further seaward.. This model was developed for single-bar oceanic. coasts which display strong seasonality and is referred to as the stonm/ swell, summer/winter, or bar/benn profile model. (see e.g. Komar, 1976ai. Hardisty, 1990). conceptual models incorporating additional morphological configurations were subsequently developed by coastal researchers such as Davis and Fox (1972), Sonu (1973), Davis and Fox (1975),. Fox and Davis (1976), Owens. (1977), Chappell and Eliot (1979), Short (1979), Wright et al. Sasaki (1983).. (1979), and. A bench-mark in this work was Wright and Short's. (1984). 'morphodynamic model' which consists of a sequence of six morphological assemblages or 'beach-states' (see Appendix A [iJ).. The end members of the. sequence are the dissipative and reflective morphologies of the bar/benn.
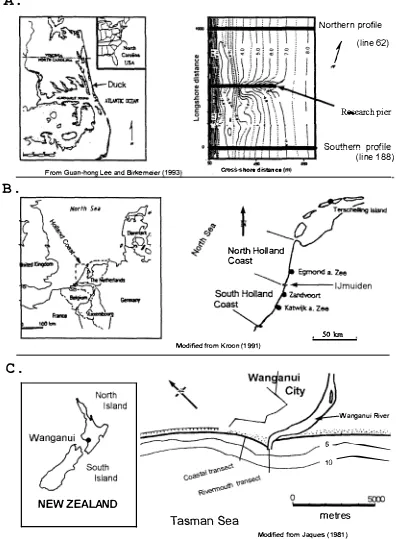
(20) 2. model. The four intennediate configurations have morphologies which vary in the longshore direction.. Distinctive 'process-signatures' are associated. with each beach-state. The morphology changes sequentially through these states in response to varying environmental conditions with the most frequently occurring configuration being referred to as the state'.. 'modal beach. Geomorphological investigations on different coasts have identified. variants of Wright and Short's model (e.g. Nummedal et al., 1984; Shaw ,1985; Marra, 1991;. and Short, 1992).. Sonnenfeld and Nurrmedal. (1987). speculated. that there is a single global nearshore bar sequence and each surf zone displays inoomplete portions of the sequence in accordance with its own combination of wave and tide conditions.. The beach-state approach has been applied to multi-bar coasts by researchers such as Homrma and Sonu (1962), Goldsmith et al. (1982), Aagaard (1990), Short. (1992), and Short and Aagaard (1993).. The most comprehensive. of these models (Short and Aagaard, 1993) is surrrnarised in Appendix A(ii). While such beach-state modelling identified certain configurations and sequences, the task has been thwarted by the greater morphological complexity and spatial extent of surf zones with multiple sand-bars. The data-sets usually consisted of aerial photographs or relatively small areas of bathymetric map.. In either case there were temporal limitations because of. low sampling rates or the short time-spans of research projects.. However, in. a few instances temporally extensive data have been collected and new morphological phenomena identified. Of particular interest is an offshore migration trend which underlies sand-bar behaviour and this will now be discussed.. The recognition of net offshore bar migration. (henceforth referred to as. NCM) was made independently by different researchers.. In mid-1991, when the. present study was being planned, NCM had been observed and documented for sites on the North Carolina coast. (USA). by Birkerneier (1984), on the Coast of. Holland in The Netherlands by De Vroeg et aL. (1988) and at the Wanganui. Rivermouth on the west coast of the New Zealand North Island by Shand (1990). These locations are shown in Figure 1.1 and plots of the associated bar-crest time-series are depicted in Figure 1.2.. Papers have subsequently been. published which provide greater detail of NCM in these areas.. These results. will be considered in later chapters together with those from Terschelling Island. (Figure 1.lB) where NCM has also recently been documented by Ruessink. and Kroon (1994) and Ruessink (1998). The locations in The Netherlands, North Carolina and New Zealand where NCM has been identified will henceforth be referred to as the global NCM si tes .. The bar-crest histories depicted in Figure 1.2 show that the bars are generated near the shoreline, systematically migrate seaward and finally.
(21) 3. A. ...... �...........��...;.. Northern. f. profile (line. 62). Research pier Southern profile (line 188). B.. CrosS-!ihore distance (nI). From Guan-hong Lee and Birl<emeier (1993). North Holland Coast ....---IJmuiden. .so km. Modified from Kroon (1991). c.. \� y � U. North Iand Wanganui River. Wanganui �. 5. _______. 10---. South. Island o !. NEW ZEALAND. Figure 1.1. Tasman Sea. metres Modified from Jaques (1981). Location maps for sites where net offshore bar migration had been observed by mid 1991. -. the time when this research project. was being planned. These locations were at Duck, (Figure A), Netherands. North Carolina. the Northern and Southern Coast of Holland in The (Figure Bl. and at wanganui, New Zealand (Figure Cl.. Contour depths are in metres below MSL in Figures A and B but relate to chart datLml in Figure C.. (which is approximately 1.8 m below MSL).
(22) 4. A.. North Holland coast. South Holland coast. 1970. Modified from De Vroeg et al.. B.. (1988). Duck soo r------,. E. .... , ... ",.. PROFH... E. 4:50. -" PROFILE. \... NE. UI"E. 62. U!l8. OUTER. :50'�------�--� F�AMJJASONDJFMAMJJASONO JFMAMJJASONO JFMA�JJ 1981 1982 198.:5 1984. TIME. Modified from Birkemeier (1984). c.. Wanganui 700. I <I> '-' c: tU. 600 500. "lii "5 l!:. 400. ch t/). 200. 0 .r:; '". 2. (). 300. 100 0. 0. 1982. 3. 1984. Time (months). Modified from Shand. Figure 1.. 2. Published data depicting net offshore bar migration. (NOM);. 24. (19S(J) these. data were available when this research project was being designed in m id-1991.. Data from the Northern and Southern Coast of Holland. are shown in Figure A,. data from Duck, North Carolina is shown in. Figure B and data from the wanganui Rivermouth. May 1984). is shown in Figure C.. Figure 1.1. NOMs.. (August 1982 to. These locations are depicted in. The diagonal trend lines in Figures B and C define.
(23) 5. disappear many hundreds of metres offshore. The diagonal trend lines overlain on the two-dimensional plots (Figures 1.2B and C) more clearly define the NOMs. cycle'.. Each sand-bar. can. therefore be viewed as having a 'life. Furthermore, the successive occurrences of these seaward migrating. sand-bars demonstrate a repetitive or 'cyclic' type of morphological behaviour.. Such net offshore bar migration is the subject of this research. project.. NOM has significant implications for coastal geomorphology. For example, NOM cannot be accommodated within the existing conceptual surf zone models depicted in Appendix A as these require, or infer, sand-bars to form at the approximate location where they are observed, while under a NOM regime they form near the shoreline. Furthermore, over the longer-term the present models indicate sand-bars attaining some average. (modal) cross-shore. location, while under NOM the bars systematically migrate in a seaward direction.. Before this problem can be resolved, i.e. reconciliation of NOM. with current geomorphological surf zone models, a more detailed understanding of the characteristics and controlling mechanisms for this intriguing and sparsely reported type of bar behaviour will be required.. NOM behaviour may also be relevant to other coastal workers. For instance: •. Coastal engineers may need to incorporate the influence of NOM into the design of surf zone structures and sediment renourishment projects.. •. Planners need to consider whether NOM influences shoreline behaviour as this may be of relevance when establishing 'set-back' lines.. •. NOM may be associated with cycles of rip-channel development which could be of relevance to surf-lifesavers when assessing/predicting bather risk.. T h e AIM o f the present s t u d y is to elaborate on the behaviour. and causative processes of NOM by acquiring and analysing a temporally and spatially comprehensive set of field data from Wanganui, and also by comparing these results with those from the other sites where NOM is evident.. 1. 2. Background to thi s pro j ect. The design of the present research project utilised the available published NOM results from Duck, the Coast of Holland and Wanganui (Figure 1.2), together with the following additional data for Wanganui.. Between. October 1990 and July 1991, morphological data had been collected by the author for a Port Development Study (see Patterson, 199 1 and 1992).. The. most comprehensive bar-crest record obtained during this monitoring exercise.
(24) 6. A.. Wanganui Rivermouth 500. g 400 a> u t:. '". iil '0 �. 0 .r:. '?. '" '" e 0. 300 200 100 0. B.. 0. 2. 3. 4. 6 5 Time (months). 7. 8. 9. 11. 10. 12. 1500 m northwest of river 600. g <I> u. t: '". iil '0 �. 0 .s::: U). .. '" e 0. ?. 500. ?. 400. �. 300. ?. ?. 200 100 0. Figure 1.3. 0. 2. 3. 4. 5 6 Time (months). 7. 8. 9. 10. 11. 12. Wanganui bar-crest time-series depicting net offshore migration at the river-mouth for the period 27.7. 90 to 11.7. 91 (Figure A) and also at a site 1500 m northwest of the rivermouth for the period 24. 7.90 to 11.7.91 (Figure B ) . The location of these sites is shown in Figure le.. was for a cross-shore transect located 1.5 km northwest of the rivennouth. These data,. together with the contemporaneously sampled rivermouth bar-crest. data, are shown in Figure 1.3.. The rivermouth data were obtained from the. bathymetric maps regularly produced by the Wanganui Port Company for navigation purposes.. Although both the rivermouth and coastal records shown. in Figure 1.3 were relatively short, an underlying NOM signal was evident.. This result confirmed that NOM occurred at the rivermouth and. indicated that it also occurred on the adjacent coast.. It therefore. appeared that a detailed study of NOM could be undertaken using morphological data from Wanganui. It was found that there was considerable variation between the average cyclic NOM characteristics in the data from The Holland coast, North.
(25) 7. Table 1.1. Average durations and rates of net offshore bar migration (NOM) at sites in The Nether. lands, North Carolina and New Zealand (see Figure 1.1) using the data available in mid. 1991 ( see Figures 1.2 and 1.3).. Location. Average NOM duratio n (yr). Average NOM rate (m/yT). North Holland. 20. 1 5 - 20. South Holland. 6-8. 50. Duck. North Carolina. 4. 69. Wanganui Rivermouth. 2. 200. Wanganui coast. 4. 125. Carolina and Wanganui.. Table 1. 1 lists the average duration and the average. rate of offshore bar migration for each of these global sites.. The Wanganui. Rivermouth result was obtained by averaging the earlier data reported by Shand. (1990) with data from the 1990/91 Port Investigation Study.. The. averaged NOM duration ranged from 20 years for the North Holland coast to two years at the Wanganui Riverrnouth. varied from -15 rn/yr. The average rates of offshore migration. (where - means approximately) on the North Holland coast. to -200 rn/yr at the Wanganui Rivermouth. between duration and rate.. A negative correlation was apparent. Furthermore, there was a significant variation. between the corresponding parameter values at the two Wanganui sites. inter-site variations in longer-term. (or average cyclic). These. characteristics of. NOM, together with their associations with corresponding physical boundary conditions and energy regimes, provided a means of investigating NOM.. Differences in bar migration characteristics were observed within the bar crest data from adjacent profiles at both Duck and Wanganui. transects at Duck were separated by 1000 m. The profile. (Figure 1. lA) . While bar behaviour. on the Duck profiles was often spatially synchronised, there were occasions when significant differences in the rnagnitudes of contemporaneous bar migrations occurred (see Figure 1. 2B).. There were also occasions when. contemporaneous cross-shore bar migrations were in opposite directions.. At. Wanganui, bar formation and disappearance did not appear to coincide between the two monitoring sites. 1.1e) .. (Figure 1. 3) which were separated by 1500 m. Bar 'merging' occurred at the rivermouth site and bar. (Figure. 'splitting' was. evident at both sites, although the latter events were non-synchronous. range. This. of differing 'within-cycle' bar behaviour at adjacent monitoring sites. indicate that antecedent morphology could control aspects of NOM.. The. apparent influence of local morphology upon NOM was also suggested by process-response relationships observed at Duck by Birkerneier. (1984) who. noted that while significant seaward migration events always occurred during.
(26) 8. storm conditions, there were occasions when higher energy conditions did not induce such a morphological response . The study of variation in shorter-term (within-cycle or subcyclic) morphological behaviour between adjacent sites appears to offer an additional line of enquiry into NOM.. Approach. 1. 3. 1.3.1. conceptual framework. Systems A. systems-orientated approach is the usual framework used in geomorph. ological investigations (Phillips, 1992).. A. system is a structured set of. objects and/or attributes which exhibit relationships with one another and operate as a complex whole (Chorley and Kennedy, 1971). consideration of systems characteristics and properties. Detailed can. be found, for. example, in Chorley Schumm and Sugden (1984), Huggett (1985), and Phillips (1992).. Aspects of systems theory used in the research design for this. study will now be discussed.. A. simple coastal system is represented diagrammatically in Figure 1.4.. The inputs refer to independent variables, mainly energy, but to a lesser. Independent varables (energy and sediment inputs). Hydrodynamics (water motions). -. .... t. Sediment dynamics ( sed iment trans po rt). �. Morphology (dependent variable) and morphological change. Figw:e. 1.4. A. schematic representation of a coastal morphodynarnic system. Modified from Harclisty (1990). and. Wijnberg (1995).
(27) 9. degree water and sediment.. Such a coastal system therefore functions as an. open system. The system inputs, such as waves and currents, influence local water motion which then induces sediment transport.. Over time, any net. sediment transport will result in a change in the morphology.. This adjusted. morphology subsequently influences the hydrodynamics which further modify the sediment transport processes which further change the morphology and so on. Coupling and feedback mechanisms are therefore fundamental aspects of coastal These mutual adaptations of the hydrodynamics, the sediment transport. systems.. processes, the morphology and the background environmental conditions are termed ' morphodynamics' and the associated coastal system referred to as a. morphodynamic system (Wright and Thorn, 1977) .. The present study attempts to. identify morphodynamic aspects of the NOM system.. Scale A coastal geomorphological system. can. be viewed as a hierarchy of morphodynamic. subsystems or compartments, each with its own temporal and spatial dimensions. (De Beer, 1992) .. Lower order subsystems are influenced by inputs of lower. magnitude and shorter duration than for the higher order systems.. In addition,. the morphological responses of lower order subsystems occur over a shorter time interval than for corresponding higher order systems.. Similarly, the spatial. dimensions for lower order subsystems are smaller than for higher order These system properties indicate that a relationship exists between. systems.. temporal and spatial dimensions. (or scales) and this is considered further in. the following paragraph.. In geomorphological systems a direct coupling is assumed to exist between temporal and spatial scales in which the time scale increases with the spatial scale. (De Vriend, 1991; Phillips, 1992) .. Such apparent time/space coupling. results in the notion of ' the' scale of coastal landform behaviour. 1991) .. (De Vriend. An example of the time/space relationship in terms of generally. accepted size categories for coastal systems, is depicted in Figure 1.5. The spatial scale is often defined by the longshore length scale which is usually larger than the corresponding cross-shore length scale.. The broadness of the. space and time categories in Figure 1.5 reflects the gradual transition between scales and the site-specific nature of the scaling components Kroon, 1993) .. (Terwindt and. Figure 1.5 depicts the coastal scale relationships for both. morphological features. (in bold) and the associated driving processes.. Sand. bars within the NOM system fit the macro-scale category.. Coastal systems are characterised by changes simultaneously occurring at a range of scales; this is schernatically illustrated in Figure 1. 6. Wijnberg. Terwindt and. (1991) note that in a geomorphological system the smaller-scale. processes are the most predominant, producing quick alterations to the.
(28) 10. MICRO MACRO MESO MEGA secs - mins hours - days months - yrs decades - centuries Wave turbulence MICRO. Sand ripples. Wind currents Tidal currents. 1-10 mm. Mega ripples. Daily weather pattems. W. MEsa. Cusps. ...J. « (). 1-100 m. Swash bars. Storm/recovery processes. Cl). ....J. Nearshore bars. « I «. Seasonal weather patterns Net profile change. a. Cl). Shoreline plan change. Climate change Regional. MACRO 1-10 km MEGA 10s -100s km. change. TEMPORAL SCALE Figw::e 1.5. Space and time scales for coastal morphologies (bold) and associated processes. For the morphology, the temporal scale refers to the time the landfonn unit undergoes change (reaction plus relaxation time), while the spatial scale refers to the size of the unit. For the pro cesses, the temporal scale refers to the duration of hydro-dynamic forcing, while the spatial scale refers to the net distance (area) over which sediment movement occurs. Modified from Horikawa (1988) , Larsen and Kraus (1993) and Kroon (1994) .. morphology that reflect gross sediment fluxes, while at a larger-scale the more energetic processes are smoothed out and the net effect is apparent. This latter effect is depicted by the trend line in Figure 1.6. periodic and episodic changes in the energy and sediment inputs responses in the morphology. Lakhan and Trenhaile. Both can. produce. (1989) note that it is. important that coastal systems are studied for sufficiently long time periods to enable. 'atypical ' fluctuations to become evident and the. intrinsic fonm and behaviour to be identified.. In the present study, bar. crest time-series are used that contain enough data points to define both multiple life-cycles of NOM and also cross-shore fluctuations within the individual NOM cycles ..
(29) 11. (1). (.) c. CO. en. "'0 (1) l-. Q .c. cl). Smaller scale. I. cl) cl) Q I-. Medium-scale. (). Larger-scale Time Figure 1.6. schematic representation of morphological changes at a range of temporal scales.. The straight (trend). line depicts the net. long-term change and illustrates how smaller-scale changes are. smoothed out over time. Modified from Terwindt and Wijnberg. (1991). The study of larger coastal systems has been approached by either investigating the system at the gained by studying subsystems. 'scale-of-interest',. (Wijnberg,. 1995).. or. 'up-scaling'. Because larger systems inhibit. conventional techniques of data-acquisition and analysis,. subsystem decoupling. followed by subsequent analysis and integration is commonly used. 19(3).. However,. knowledge. (Jamshidi,. the validity of this approach has been questioned.. 'Holists'. argue that the system must be studied as an indivisible whole due to synergistic and global qualities which cannot be possessed by its constituent parts (Blauberg et al.,. 1980; Capra, 1994). In contrast, 'reductionists' consider it. is acceptable to trace complex phenomena or processes to their smallest parts, analyse them, (Bunge,. and then by integration determine the dynamics of the whole system. 1977; Lilienfeld, 1978).. coastal systems. (see De Vriend,. Because of the intrinsic non-linearity of. 1991; Carter et al., 1993; Holman and Sallenger,. 1993), it would, if possible, seem prudent to avoid reductionist or upscaling approaches during the early stage of investigation into a new phenomenon.. The. present study therefore sets out to investigate NOM using the scale-of-interest approach.. Equilibrium The concept of system equilibrium is fundamental to the study o f geomorphological systems.. Phillips. (1992) considered that i n geomorphology,. equilibrium is generally taken to imply that a given set of processes and/or.
(30) 12. environmental controls will produce particular landscape response. hierarchies,. (or result in a tendency toward). However,. a. the increased recognition of. thresholds and non-linearities in geomorphology has shifted the. focus from a single stable equilibrium.. Ercphasis is now being placed on. behaviour of geomorphological systems away from equilibrium; in particular, the presence and prevalence of non-equilibrium and disequilibrium in the landscape, unstable. and the occurrence of multiple equilibria - many of which are. (Phillips,. 1992) .. The relevance of these systems concepts for the. present study of NOM will be assessed in the latter chapters of this thesis.. Models. A common way to gain insights into the structure and functioning of complex systems is by developing models. These are abstract limitations or approximations which simplify reality. (Lakhan and Trenhaile, 1989).. A variety. of model types have been used when investigating systems and the following summary is synthesised from Fox (1985), Lakhan and Trenhaile Hardisty •. (1989), and. (1990).. Deterministic physics;. (theoretical). mathematical models are based on classical. in particular, the principles of fluid mechanics.. In such. models the new state or output of the system is completely determined by the previous state and by the governing equations. •. Ercpirical mathematical models. can. with wave-tanks where variables. be derived using physical modelling. can. be altered one by one.. This is often. combined with deterministic models to initially identify the equation parameters. •. Empirical statistical models result from the statistical analysis of field. data.. Applying a pseudo-random generator to a statistical model. to move it forward through time leads to a probabilistic model. •. Computer simulation or numerical models are another form of physical modelling. Here both probabilistic and deterministic parts are used in computer subroutines.. •. Conceptual models describe basic patterns or relationships evident in observed data with statistical techniques frequently being used to infer the associations.. Conceptual models are often used to identify. relationships that. can. subsequently be tested using more rigorous. empirical and deterministic modelling approaches.. The present study will analyse bar-crest field data to develop a conceptual model for NOM..
(31) 13. 1.3.2. Data collection issues. Sampling resolution. Both the temporal and spatial sampling resolution required for the NOM field data is guided by the scale relationships described earlier .. Surf zone bars ,. the morphological feature with which this study is primarily concerned, are classified in Figure 1 . 5 as being macro-scaled features . These bars have a length (longshore). m.. scale between 10 2 and 10 3. To identify features within. these foDmS the longshore resolution of the morphological sampling should be at the lower limit, i . e . about 100 metres . to detect bar-crests would be -10 m.. Cross-shore sampling resolution. Macro-scaled bar features in Figure 1. 5. are subject to temporal changes over periods of weeks and months which suggests that morphological sampling for studying NOM should be carried out at two to four weekly intervals . As the hydrodynamic processes associated with change in nearshore bar morphology appear to relate to stonm/fair weather periods , a sampling regime capable of providing at least daily process values was used in the present study .. T�ral and spatial scales. The time-period over which data collection should occur is detenmined by the time-scale of the NOM phenomenon .. The Wanganui data in Figures 1 . 2C and 1 . 3. depicted partial NOM cycles which, by extrapolation, suggested an overall duration of two to four years . The data-sets shown in Figure 1 . 2 indicate that behavioural regularity is a general property of NOM . To eliminate noise created by smaller-scale processes, or other atypical behaviour, a data-set twice as long as the maximum likely duration was considered desirable, i . e . eight years .. The other global NOM data-sets were of a satisfactory length. given the time scales indicated in Table 1 . 1 .. The proj ect was designed such that two to three years of Wanganui coastal data would be collected and this would be supplemented by the Port Corrpany' s archival riverrnouth data to cover the required time-span .. It was accepted. that the spatially restricted nature of the riverrnouth data, together with NOM interpretational corrplications and the lack of earlier process data,. would corrprornise the overall effectiveness of the study.. However, unforeseen. circumstances ! enabled coastal design data to be collected for a period of 6 . 3 years .. This was found to provide a data-set of suitable length to. identify NOM characteristics and meet the study obj ectives without having to incorporate riverrnouth data .. 1.. The author experienced prolonged health problems during the study ; this s igni ficantly delayed completion o f the proj ect ..
(32) 14. The spatial extent o f the area selected for study a t Wanganui was influenced by the longshore physical characteristics o f the northwestern coast.. The j etty-controlled Wanganui Rivennouth is located upon an ebb tide. delta which can be delineated by the 10 m contour in Figure 1 . le.. The cross. shore width of the delta decreases from - 15 0 0 m at the rivermouth to -1000 m some 4 000 m northwest of the rivermouth .. Westward of this location the. bathymetric contours remain approximately shore-parallel .. This indicates that. the j etties and ebb delta influence surf zone morphodynarni cs along the northwestern coast for a distance of -4000 m.. It was considered useful t o. include both delta and unmodi fied stretches o f coast within the present study because o f possible differences in NOM characteristics . The longshore length scale was therefore de fined as extending approximately six kilometres to the northwest of the rivennouth.. The cross-shore width of the Wanganui s tudy site was based on an echo sounding survey carried out as part of the 1 9 9 1 Port Development Study ( section 1 . 2 ) .. The resulting profiles are shown in Figure 1 . 7 .. The. seawardmost sand-bar was on the northwestern profile located -5000 m from the rivermouth. The crest of this bar was -650 m from the foredune toe .. As this. bar had a subdued form it was assumed its location was indicative of the likely seaward limit o f bar migration .. The cross-shore length scale of the. study site was therefore defined as extending at least 7 00 m seaward of the dune toe.. New data a cquisi tion techniques To obtain Wanganui bar-crest location data at the specifications described above ,. new methods of data aCquisition were developed .. Morphological surveys. are usually executed by sampling the sea-bed elevation at regularly spaced intervals along predetermined shore-normal t ransects . such methods,. e . g . echo-sounding,. In the p resent study. will be referred to as. These techniques are relatively expensive ,. ' ground profiling ' .. labour intensive,. time-consuming,. and require uncharacteristically calm atmospheric and sea conditions for the Wanganui coast.. While ground profiling wa s clearly an inappropriate me ans o f. collecting data for the present study o f NOM:,. this technique was used to. provide data for other tasks relevant to the study such as determining physical boundary characteristics,. e . g . time-averaged cross-shore slope.. The. method developed to obtain morphological data for NOM analysis was based on photographing the sea surface and using light intensity variation caused by broken waves to signal the relative elevation of the sea-bed.. Digital image. processing algorithms were written to capture and analyse these signal s . method was an extension of earlier work by Holman and Lipprnann Lipprnann and Holman. ( 1989) .. ( 1987 ). and. Obtaining bar-crest location data along cross. shore transects using image-based techniques will be referred to as profiling ' .. This. ' intensity.
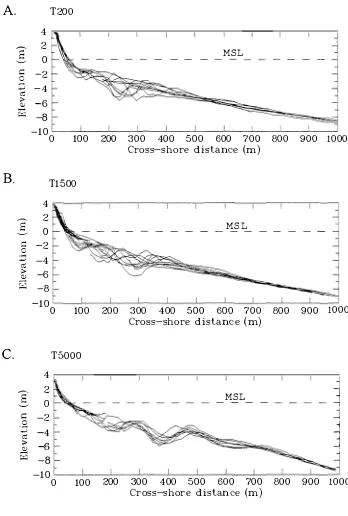
(33) 15. o. MSL. o. MSL. MSL 0 1------. MSL. 0 1-----. MSL. 0 1-----. 2 00. 300. 400. 500. 600. 7 00. Cross-shore distance (m) from dune toe. 800. 1000. Figure 1. 7. Cross-shore profiles a t transects located 1 5 0 m (mar k e d T 1 5 0 ) , 5 0 0 m , 1 5 0 0 m, 3 0 0 0 m, 4 0 0 0 m and 5 0 0 0 m to t h e nort h w e st o f t h e Wanganui Rivermouth . The arrow l o c a t e s the s e a w a rdmost b a r - c r e s t . The survey was carri ed out using e c h o - s o unding on 1 1 . 7 . 9 1 .. 1. 4. Obj ectives and thesis outline. The considerations detailed above enabled the following general research obj ectives to be identified as a means of achieving the study aim: •. Development of photogramme tric methods of data acquisition and analysis ;. •. Determination of longer-term ( average cyclic ) characteristics of NOM behaviour based on the analysis of multiple cycles ;. •. Determination of shorter term ( within-cycle or subcycle) charac teristics of NOM behaviour, with emphasis on longshore non-synchronous variation ;.
(34) 16. •. Comparison of the Wanganui results with those from other NCM sites;. •. Identification of the environmental conditions associated with NCM characteristics ;. •. Development of a conceptual morphodynamic model to explain the observed NCM behaviour at Wanganui and the other global NCM sites .. These obj ectives will be addressed within the following chapters . Characteristics of the Wanganui study site are described in chapter 2 .. This. includes the regional and local morphology and its evolution, the sediment characteristics and the energy regime .. Chapter 3 describes the image-based. and ground profiling methods developed to acqui re morphological data capable o f meeting the research design speci fications .. Chapter 4 consists o f an. evaluation of data acquired by these methods ; this includes errors and the adjustments required to enable fusion of data obtained using the different methods . Longer-term characteristics o f NCM at Wanganui and from the other global NCM sites are investigated in chapter 5.. Shorter-term morphological. behaviours which may influence individual cycles of NCM are identified in chapter 6 .. Relationships between NCM characteristics and environmental. conditions, together with contributions to conceptual modelling o f NCM, will be included in chapters 5 and 6.. Chapter 7 surrma rises the findings for the. speci fic research obj ectives and questions. ( fo r each chapter ) ,. conclusions regarding the general research obj e ctives. and provides. ( listed above ) .. Of. particular note is a general conceptual morphodynamic model o f NCM appli cable to all the global sites .. Possible directions for future research. into NCM are also included in the final chapter .. At the time this thesis was submitted, the following parts had been published:. The method of automated swash- front tracking referenced in. chapters 2 and 7 was described in Bailey and Shand ( 19 94 ) . The image-based data-aCquisition techniques. ( 1993 , 199 6 , 1997 ) . bar-crest data. ( chapter 3 ) were described in Bailey and Shand. Comparison between the di fferent methods o f acquiring. ( chapter 4 ) were surrmarised in Bailey and Shand ( 19 97 ) .. NOM review materials included in chapters 1,. Bailey ( 19 99 ) .. The. 5 and 6 appeared in Shand and. Comparison of NCM characteristics and environmental. conditions at the global sites. ( chapter 5 ) , together with the methods used. to characterise NCM behaviour, appeared in Shand et al . sequences depicting bar bi furcation. ( Figure 6 . 1A ). ( 19 99 ) .. The image. and bar switching ( Figure. 6 . 15) , along with the associated descriptions of these types o f morphological behaviour, previously appeared in Shand and Bailey ( 19 9 9) ..
(35) 17. CHAPTER 2. THE. FIELD SITE. The WaLrus and the Carpenter were walking hand in hand. They wept like anything to see such quantities of sand. "If only this were swept away" r they said, "wouldn ' t i t be be grand" . "If seven maids and seven mops swept i t for half a year, Do you suppose ", the Walrus said, "tha t they could keep it clear ? " "I doubt i t ", said the Carpenter, and shed a bit ter tear .. "I 'm not so sure ", the Walrus said, "I 've got a li t tl e scheme; In place of seven maids and mops, we 'll concentra te the s tream , And then the sand will surely go much further than you dream " .. Wanganui Chronicle,. 2 .1. 1 9 June 1 923. Introduction. This chapter describes the study area and its environmental setting . chapter begins. ( section 2 . 2 ). The. with a description of the regional and local. geomorphology, inclUding the coastal evolution.. It is important to define. longer-term morphological change as this may be causing NOM to occur or be influencing NOM characteristics .. The morphological adj ustment along the. northwest coast during and subsequent to the construction of the riverrnouth j etties ,. had a significant e ffect on the study area ;. the above quotation. alludes to this situation . A somewhat detailed Stmrmary of this historical coastal change is therefore included so as to ascertain whether morpho logical adjustment may still be occurring .. Section 2 . 3 considers the. morphology within the study area and defines the associated terminology used in the thesis .. Parameter values for morphological zones are derived. for use in chapter 4 which evaluates the morphological methods,. and also.
(36) 18. for use in chapter 5 which compares different NOM: sites . Sediment characteristics are considered in section 2 . 4 . comparing global NOM: sites in chapter 5 .. Sediment size is used when. Sediment texture and. mineralogical data are also included as these indicate sediment transport paths in and near the study area .. Process conditions associated with wind. and waves are described in section 2 . 5 .. These data and the associated. parameter values are used in data processing ( chapter 3 ) , evaluating morphological data ( chapters 4 ) , during the analysis of NOM: envirornnent s ( chapter 5 ) and during the identi fication o f NOM:-associated morphodynamics ( chapters 5 and 6 ) .. A description of the morphology in the vicinity of the. rivermouth, together with the associated sediment and process charac teristics, will be detailed within relevant sections .. 2.2. Geomorphological setting. 2.2.1. General background. The study area is situated along the northern margin o f Cook Strait ' s western embayment ( Figures 2 . lA and B ) .. The embayment is exposed to the. Tasrnan Sea to the west and to the Pacific Ocean via Cook Strait to the south ( Figure 2 . 2 ) .. The Wanganui-Taranaki shelf for:ms the floor of the. embayment which generally has depths less than 125 rn.. The Wanganui area lies within an extensive sedimentary basin - the Wanganui Basin ( Figure 2 . 2 ) .. This geological structure is aligned. northeast to southwest and is approximately 4 0 0 km long by 2 0 0 km wide . Four thousand metres of Plio-Pleistocene marine sediment have been deposited within this basin. ( Stern and Davey,. 1989) .. These deposits. consist of sequences of siltstone, shell beds and sandstone which represent late transgressive and highstand portions of Plio-Pleistocene sea-level cycles (Abbott and Carter,. 1991 ) .. The northern and eastern margins of the basin have been subj ect to uplift and along the northwest Wanganui coast the strata dip gently to the southeast at two to four degrees ( Fleming,. 1 9 5 3 ; Naish and Ramp,. 1995) .. The uplift rate along the contemporary coastline in the vicinity of the study area was estimated by Pillans. ( 19 8 3 ). to be - 0 . 25 to 0 . 3. with the rate increasing both inland and toward the west .. rrm. per year. Pillans. ( 19 8 3 ,. p954 ) noted that ' a hingeline or zero isobath appeared t o occur some distance offshore ' . seaward .. Continued s edimentation and subsidence occur further. This is attributed by Stern and Davey ( 1 98 9 ) to the subducting. Pacific plate being locked with the Indo-Alls tralian plate. ( see Figure 2 . 2 ) .. The possibility exists that such tectonics induce a landward sediment.
(37) 19. A.. SOUTH ISLA,.�D. o. 100 km ,. ,. B.. f __-Wanganui. River. 10 ------. STUDY AREA /. o. Tasman Sea. Figure 2 . 1. metres. The regional setting of the s tudy area is shown in Figure A and the local environmental s etting is shown in Figure B . Depth contours are in metres below fwlSL in Figure A and metres below chart datum in Figure B. L 8 m below. MSL) .. (where chart datum is. Sources : Figure A is modified from Lewis Figure B is modified from Jaques. ( 1979} ( 1981).
(38) 20. Tasman. Sea. Central Volcanic. Pacific Ocean. 100 km .......-. Figure 2 . 2. Structural geology affecting the study area . Modi fied from Stern and Davey ( 1 9 8 9 ). Figure 2 .3. Construction of the northwestern j etty the Wanganui Rivennouth in 1 8 8 4 .. ( the North Mol e ). at. The sea-cl i f f known as. the North Head is evident on the right of the photograph . Source : Wanganui Harbour Board archives.
(39) 21. source-seaward sediment sink situation which may result in o ffshore sediment transport . West of the study area shoreline recession and an active sea-cliff are superimposed upon the uplifing coast . is consistent with the landward sediment source concept .. Such erosion However,. erosion. along this coast is mainly attributed to longshore sediment transport and this situation is described later in the chapter .. A Holocene sea-cli ff cut into Pleistocene sediment extends from the Next to the river this cliff forms a. Wanganui River toward the northwest . s iltstone bluff ' North Head '. -. 1 0 m high which was historically referred to as the. ( see Figure 2 . 3 ) .. The castle-like appearance of the North. Head to approaching mariners resulted in the town that developed nearby being named Cast1ecliff. ( Burgess ,. 197 1 ) .. For - 6 0 0 m to the northwest o f. the r ivermouth the sea-cliff is obscured by dune sand which may have resulted from the coastal response to j etty construction and section 2 . 2 . 2 ) .. Further to the northwest the sea-cliff becomes. increasingly better defined -45 m.. ( see Figure 2 . 3. ( Figures 2 . 4A and B). and reaches a height of. Twelve ancient sea-cli ffs have been identi fied on the uplifted. marine surfaces further inland. ( Pillans 1983) .. To the west of the study. area the toe of the sea-cliff is affected by wave action and historical data show that the cliff has recession rates o f b etween 0 . 2 and 0 . 6 m per year. ( Johnston,. 1985a) .. As indicated above , the sea-cliff at Wanganui is relict for 6 . 2 km to the northwest of the riverroouth, study area .. i.e.. for the approximate length of the. The cli f f was cut off from the sea owing to shoreline. progradation which occurred along this length of coast following j etty construction at the rivermouth . characterised by sand dunes. The accreted land seaward of the cliff is. ( see Figures 2 . 4A and B ) .. Approximately 20 km northwest of the Wanganui Rivermouth uplift of more resistant beds of Pliocene limestone in the vicinity of the Nukumaru fault zone. ( Figure 2 . 2 ). has resulted in the development of a coastal salient. which extends approximately two kilometres seaward . together with its distinct bathymetric expression. The foreland,. ( Figure 2 . 1A) ,. acts as a. wave shadow for the coast toward the study area .. A platform cut into Pleistocene sediment by wave action extends seaward from the cliff-base .. Fleming. ( 1953). noted that a sand veneer at least one. metre deep exists along the beach to the northwest of the study area, the sand layer thickened to approximately 1 0 m near the rivermouth .. and The. upli fted marine platforms further inland are also veneered by up to 12 m of marine sand with additional coverbeds comprising tephra,. loess and dune.
(40) 22. A.. B.. Figure 2 . 4 Aerial photograph. (A). taken on. taken on 5 . 12.93 showing. (27 . 7 . 93) and terrestrial photograph (B). the study area and surrounding environment .. Figure A i llustrates the whole study area stretching from the Wanganui Rivermouth in the foreground to the location marked by the arrow in the distance. (- 6 km) .. The dashed line marks an ill defined sea-cliff .. This. cliff stretches westward for 25 km and is protected from the sea by a. narrow coastal plain capped with sand dunes for the first 6.2 km.. The. asterisk in Figure A locates the camera site that was used for photographic data collection in the project .. Figure B shows the relict. sea-cliff and recently developed foredune in the northwestern section of Between 6 . 2 and 8 km col luvium, marine sand and driftwood. the study area .. are evident at the toe of the cliff;. however,. cliff is directly exposed to wave action.. further to the west the. The Nukumaru fault zone. ( see. Figure 2 . 2) is located along the horizon and Mount Egmont - a maj or source of the sand for the study area , obtained using. a. can. be seen in the distance .. time-lapse technique explained in chapter 3 .. intensity bands on this photo define multiple sand-bars .. Figure B was The high.
(41) 23. sand. 1983 ) . further o ffshore, the depth of sand mantling the wave. ( Pillans ,. cut Pleistocene fonrations i s unknown .. The southeastern boundary of the s tudy area is the Wanganui Ri vermouth ( Figure 2 . 1B ). and a bri e f characterisation of the river is now given .. Wanganui River is 305 km long,. has a catchment area of 7 1 2 0 km2 ,. The. and its. mountain headwaters in the central volcanic region attain a height of 2797 m. ( Tonkin and Taylor,. 1978) .. For IlUlch of its length the river flows. through well dissected Pliocene marine secliments Wanganui ,. 2 yield is 4 8 6 tonnes/lan ,. At. ninety seven percent of which is estimated to be. 1 9 7 8 ) . The tidal cornpartrrent ( spring. suspended load ( Tonkin and Taylor, range ). 1953 ) .. ( Fleming,. 3 the rrean flow of the river is 224 m / s and the annual sedirrent. 3 is 9 . 3 x 10 6 m. ( Gibb et al . ,. 1 962 ) .. River hydrodynamics will be. considered in greater detail in section 2 . 5 . 4 ,. while the morphology and. sedirrent characteristics in the vicinity of the rivermouth will be detailed in sections 2 . 3 . 3 and 2 . 4 . 3 respectively .. Ebb - tide del ta The contours in Figure 2 . 1B show that the ebb delta at the rivermouth has a southerly offset from the present entrance .. The seaward extent of the. delta reduces along the study area until the bathyrret ric contours becorre approximately shore-parallel beyond a location -4 0 0 0 m northwest of the rivermouth .. To further define the cross-shore characteristics of the delta. in the vicinity of the study area,. transects located 2 0 0 m,. 1500 m and 5000. m from the rivermouth were surveyed and the resulting profiles are shown in Figure 2 . 5 . chapter 3. The methods used to acquire these data are described in. ( section 3 . 3 ) .. A distinct break in slope - 1 9 0 0 m offshore in the. profile closest to the rivermouth the seaward extent of the delta .. (T200 in Figure 2 . 5 ) appears to define Longshore morphological gradients. associated with the delta are expected to influence NOM;. these. morphological characteristics are described and quantified in section. 2.3.1.. The plan shape of the delta. ( Figure 2 . 1B ). suggests that wave energy is. signi ficant in controll ing sediment transport in the vi cinity o f the rivermouth for the following reasons . its limited seaward extent ,. The subdued fonn of the delta,. indicates the dominance o f wave energy relative. to river flow ( see Wright and Colman ,. 1973 ) , and also the dominance of wave. energy relative to tidally induced flow near the entrance Hayes,. 1984 ; Hayes, 199 1 ) .. ( see Davis and. An offset in delta symmet ry indicates wave. induced net longshore transport direction of the offset. i.e.. (Wright,. ( littoral dri ft ). o f sediment in the. 1977 ; Wright et al . ,. 1980) ..
(42) 24. T5000 T1500 --. S. T200. -10. '-'. �. 0 . ...... .;-l co :> <lJ ..-. -15. r=:l. -. ----- -. -20 ���,�1�����-L�-L�-L1� o 500 1000 1500 2000 2500 3000. Cross-shore d istance (m). F i gure 2 . 5. --. £ <lJ C,.). �. co .;-l rJ) ........ "'d. <lJ :;.... 0. �. 700 600. G. 400 F. 300 200. rJ) rJ) 0 :;..... 100. U. J. 500. rJ). I. O f f s hore prof i les for c ro s s - s hore transec t s l ocated 2 0 0 m northwes t o f the r ivermouth ( T2 0 0 ) I 1 5 0 0 m northwes t (TI5 0 0 ) and 5 0 0 0 ID t o the northwe s t ( T S O O O ) . Eleva t i on refers to depth below MSL and c r o s s s h o r e d i s tances are measured f rom the d u n e t o e . The s u rvey w a s carried o u t o n 1 . 9 . 9 2 .. 0. c. \.��\j \.�'?J\j \.'?J\:P \.,?!\.\J \.4·� \.,?!'O\j \.'?Jb.\J \..'?J�\J \..'?J,<:;P \.'?J'\\:> \.'?J�\j Time (years). F i gure 2 . 6. Shoreline change between 1 8 7 6 and 1 9 9 2 a t a l o c a t ion 1 5 0 m northwes t o f t h e W anganui rivermout h . The horizontal b a r s de f ine periods o f No rth Mole development ( see t ext ) . T h e d i s t ance origin i s t h e southwest s ide of Abbot Street ( l ater named Egmont S t reet ) . Thi s origin was used f o r c o n s i s t ency with p revious surveys and t o f a c i l i t a t e future surveys . D e t a i l s on the data points are p rovided i n Appendix C ..
(43) 25. Studies into littoral drift along the Wanganui coast confirm the occurrence o f net northwest to southeast sediment transport .. Estirrates of. 3 northwest to southeast rates vary between 1 4 2 0 0 0 and 597 000 m /yr, while estirrates of the southeast to northwest rate vary between 60 0 0 0 and 3. 277 000 m /yr ( se e Appendix B) .. Whil e the ebb tide delta has a notably subdued form, even this may be exaggerated as the seaward protrusion is at least partially a response to rivermouth j etty construction .. The influence of the j etties on morphology,. both within and beyond the study area, has been considerable .. This change. is now described in some detail as adjustment may still be occurring and this could influence NOM.. 2.2.2. Rivermouth j etties and their morpho�ogica� inf�uence. The Wanganui River played an important transportation role for both ( Chappell and Veitch 1 9 3 9 ; King,. indigenous and colonial economies. 1 9 64 ) .. Jetties were constructed at the rivermouth to prevent lateral migration of the channel and to increase depths. ( Gibb et al . ,. 1 9 62 , King, 1 9 64 ) .. A. brief summary of j etty development is now given .. During 1 8 8 4 and 1 8 8 5 a 2 6 0 m long j etty was constructed in a seaward direction from the siltstone bluff on the northwestern side of the Wanganui Rivermouth. ( see Figure 2 . 3 ) .. Mole, was extended to 64 0 m. length to 730 began in 1905. ID. In 1 9 0 5 this j etty,. Smaller extensions subsequently increased its. by 1 9 12 and 8 8 4. ( 67 0 m). referred to as the North. ID. by 1 93 0 .. Construction of the South Mole. and reached its final length of 975. ID. by 1 912 .. During construction o f the j etties the walls were only raised to l ow tide level . However, by 1 9 4 0 the height had been increased to approxirrately three metres above mean sea level .. Following construction of the j etties, entrance depths increased from. -2 . 3 m below MSL in 1 8 7 9 up to 5 . 8 Burges s ,. 1974 ) .. m. in 1 93 2. ( Gibb et al . ,. 1 9 62 ; Mclean and. This improvement has been attributed to seaward. displacement of the rivermouth into deeper water,. by ebb-stream scouring. and by the moles acting as barriers which prevented littoral drift reaching the entrance. ( Gibb et al . ,. 1 9 62 ; Wallingford Hydraulic Research Station,. 1967; Burges s , lQ7:J.- i McLean and Burgess , 1974) .. The littoral barrie.r. effect resulted in substantial morphologi� adj ustment to both the northwest and southeast coasts and this ch��e will now be described..
(44) 26. Shoreline change along a cross-shore transect located 150 m northwest of the riverrnouth i s shown in Figure 2 . 6 .. The data source s ,. shoreline. indicators and e rror assessment are described in Appendix C . of rapid seaward migration of the shoreline occurred : and 1 8 8 5 and 2 7 5 m between 1 912 and 1942 .. Two episodes. 1 7 0 m between 1 8 7 9. These episodes broadly. correspond with the two periods of j etty development .. By 1 9 7 0 the. shoreline had extended to -550 m and thereafter a state of dynamic equilibrium existed, i . e . the shoreline fluctuated about a constant cross shore location .. Shoreline response to the j etty construction along nine kilometres of coast each side of the riverrnouth is depicted in Figure 2 . 7 .. These annual. rates of shoreline change for the time periods 1 8 7 6 to 1 942 and 1942 and 1982. ( sources in Appendix Cl were recently reported in Smith and Ovenden. ( 19 98 ) .. These data were derived by determining the average shoreline. position over 5 0 0 m lengths of coastline . This approach removed noise caused by smaller scale changes associated with morphological configuration at the time of sampling ( see section 2 . 3 . 2 and Appendix A [ i ] ) .. On the northwest coast,. progradation occurred from the riverrnouth to. - 4 0 0 0 m alongshore between 1 8 7 6 and 1942 . the rivermouth. The greatest rate occurred near. ( 5 ro/ yr) and resulted in the shoreline in this area. prograding 3 3 0 m. between ± 0 . 2 ro/ yr .. From - 4 0 0 0 m and -7500 m alongshore the rate fluctuated Further westward the coastline appears to have been. unaffected with the regional erosion rate of 0 . 2 to 0 . 6 rrJyr Johnson, 1 9 8 5a ) being maintained.. ( identified by. By contrast , the results for the 1942. to 1982 period showed the rate of progradation reducing to -2 ro/yr ( 80 m) near the rivermouth but increasing to > 1 ro/yr toward - 6 0 0 0 m.. The rate. then diminished to near zero beyond -7500 m. The occurrence of significant shoreline progradation northwest o f 4 0 0 0 m during the 1 9 4 2 to 1 9 8 3 period is also indicated by recent dune development to 6 0 0 0 m and by the accumulation o f colluvium and flotsam beyond 6 0 0 0 m ( see Figure 2 . 4B) .. On the southeast coast ,. 2.7) .. erosion occurred between 1 8 7 6 and 1942. The greatest rate ( - 3 ro/y). occurred near the riverrnouth and this. resulted in shoreline retreat of - 2 0 0 m.. The erosion rate then decreased. to zero at - 9 0 0 0 m southeast of the riverrnouth . period. ( Fi gure. During the second survey. ( 1942 to 1 982 ) the southeas t coast experienced progradation at an. annual rate of - 0 . 1 m/y ( 4 0 m) adj acent to the rivermouth .. Further. alongshore the rates diminished with erosion occurring beyond -20 0 0 m.. The. rate coincided with the 1 8 7 6 to 1942 rate at - 7 0 0 0 m and then dropped below the earlier rate beyond 8 0 0 0 m..
(45) 27. 6 -. �. :>,. "'-. S. --. Cl) en. �. ro. � (). '4-<. 0. Cl) +-' et). �. 5. 4. -. - -. 1942-1982 1876-1942. 3. 2. ---. 1. 0. -1. -2. /. "\. -. / -\. /-...... --l -. '". \/. -3. -4. ---. /. \j\:} /'?)�\:} /'0r;::,\j\j \:J\j\j /�\j\j\j /� /��. -/. --- / \ -::::-. I I. I. \j. \j. ��. \:} \j t>,\j\j y:>�. Longshore d istance (m). F igure 2 . 7. \j \j \j\j '\.\5r;::,\j "O. Rates of shorel ine change a l ong 1 9 km o f W anganui coast f rom 1 8 7 6 t o 1942 and from 1942 t o 1 9 8 3 . The vertical dashed l ine l o c a t e s the Wanganui Rivermout h . Nega t ive d i s tances refer t o distance t o the s outheast o f t h e rivermouth . The horizontal bar def ines the s tudy are a . The data points were d erived by Smith and Ovenden ( 1 9 9 8 ) . Deta i l s o f the r aw shore l in e data are provided in App endix C .. Castlecliff Beach. F igure 2 . 8. A bathyme t i c chart s u rveyed on 2 3 . 1 . 6 8 showing an examp l e o f rive rmouth and adj acent c o a s t a l morphology . The double ended arrow defines the mai n inlet channel . The rectangular area encl o s e d by t h e dashed line depict the area regu larly surveyed by the Port o f wanganui for naviga t i on purpos e s . Contour depths are i n f e e t b e l ow chart datum (MSL - 1 . Bm ) . Sourc e : Shand ( 1 9 9 0 ).
Figure

+7


Related documents
questions in row 1 (one per cell) and click on Form menu and Create form. Upload existing
We aimed to determine if an individually titrated supplemental PN strategy commenced 48 – 72 hours following ICU admission and continued for up to 7 days would increase energy
Discre.
Dairy calves are more likely than beef calves to experience welfare compromise through undernutrition or dehydration because of failure to suck or a delay between birth and
To evaluate the Type I error rates of our four statistical tests with real learning algorithms, we needed to nd two learning algorithms that had identical performance when trained
In this work two strains of Candida guilliermondii were compared for their citric acid-producing capabilities, these being parent strain Candida guilliermondii NRRL
7.7: Cross-section diagrams of the step-by-step MEMS release process, a Initial CMOS chip with circuitry and unreleased MEMS capacitors, b Lithography with thick resist DWW
Objectives: The Eighth Mount Hood Challenge (held in St. Gallen, Switzerland, in September 2016) evaluated the transparency of model input documentation from two published
