▲
Road freight transport
methodology
Volume 1
Reference manual
for the implementation No 1172/98
on statistics on the carriage of
goods by road
EDITION 2005
ISSN 1725-0188
A great deal of additional information on the European Union is available on the Internet. It can be accessed through the Europa server (http://europa.eu.int).
Luxembourg: Office for Official Publications of the European Communities, 2005
ISBN 92-894-9880-3 ISSN 1725-0188
Europe Direct is a service to help you find answers to your questions about the European Union
Freephone number (*):
00 800 6 7 8 9 10 11
(*) Certain mobile telephone operators do not allow access to 00 800 numbers or these calls may be billed.
This is volume 1 of Road freight transport methodology.
Volume 2 is also available:
Road freight transport methodology –
Methodologies used in surveys of road
forward in the evolution of Community transport statistics in the European Union. This Regulation provides a legal base for the collection of a wide range of data on road freight transport. In addition, by providing for the transmission to Eurostat of micro-data from surveys of road freight operators, it laid the emphasis on quality and comparability of statistical information.
This reference manual aims to provide detailed guidance for Member States and candidate countries engaged in the implementation of Council Regulation 1172/98. This guidance falls into three parts:
• Part A : recommendations for sample surveys of the transport of goods by road;
• Part B : recommendations for the variables, definitions and explanatory notes
• Part C: rules for transmission of data to Eurostat, data validations carried out by
Eurostat and rules for data dissemination by Eurostat
Some of the recommendations in this Manual are not legally binding, but form part of the voluntary co-operation between Eurostat and Member States, based on a common interest in improving the quality of Community statistics. However, subject in each case to the agreement of the Statistical Programme Committee, certain aspects of these recommendations were already incorporated into legally-binding Commission Regulations adopted under the committee procedure of Article 10 of the Council Regulation. Such Regulations were adopted for the country codes, the data transmission to Eurostat and the data dissemination.
A preceding version of this Manual, focussing on recommendations for surveys, was produced by Eurostat as part of its PHARE programme of statistical co-operation with Central European countries. That version consisted mainly of relevant papers provided at various workshops on transport statistics and on the experiences gained in advising those Central European countries that participated in the pilot surveys on road transport statistics. Eurostat acknowledges the valuable contribution to the manual made by the authors of these papers, which form the basis of Part A of the Manual.
David FLAXEN formerly Department of Transport, United Kingdom
Franz STULEMEIJER formerly Central Bureau for Statistics, The Netherlands
Howard COLLINGS formerly Department of Transport, United Kingdom
Klaus ROSTEK formerly Federal Ministry of Transport, Germany
Philip HATHAWAY Department of Transport, United Kingdom
Richard DEISS formerly European Commission, Directorate General for Energy
and Transport
Other material in this Manual was prepared by Howard Collings and Marie-Noëlle Dietsch (Artemis Information Management SA) and by members of staff at the Transport Statistics Unit at Eurostat.
The Manual and related documents are available in electronic format on Eurostat's CIRCA web site in the Transport Interest Group, at:
http: //forum.europa.eu.int/dsis
A user-id and password for the Transport Interest Group can be obtained from Eurostat.
Please address comments and questions relating to this Manual to:
Carla Sciullo
Transport Statistics Unit Eurostat
Bech Building L-2920 Luxembourg
tel: +352 4301 37408
fax: +352 4301 32893
Chapter 1. General principles of sample surveys 1-1
Chapter 2. Setting the survey objectives 2-1
Chapter 3. Preparations for the survey – sample design 3-1
Chapter 4. Preparations for the survey – questionnaire design 4-1
Chapter 5. Preparations for the survey – management aspects 5-1
Chapter 6. Data collection and data entry 6-1
Chapter 7. Processing and analysis 7-1
Chapter 8. Publication and dissemination at national level 8-1
Part B - Recommendations for the variables - Definitions and explanatory notes
Chapter 9. General concepts on definitions and regulation on precision standards 9-1
Chapter 10. Definition of variables, classifications and codes 10-1
Part C - Rules for transmission of data to Eurostat and dissemination recommendations
Chapter 11. Structure and transmission of data files 11-1
Chapter 12. Validation of micro-data 12-1
Chapter 13. Aggregation of data and supplementary tables 13-1
Chapter 14. Validation of aggregated data 14-1
Chapter 15. Dissemination of data by Eurostat 15-1
Chapter 16. Methodology questionnaire 16-1
List of Abbreviations 17-1
Bibliography 17-3
Annexes
Annex 1. Council Regulation (E C) No 1172/98 of 25 May 1998 on statistical
returns in respect of the carriage of goods by road
18-1
Annex 2. Commission Regulation (EC) No 2691/1999 of 17 December 1999 on
rules for the implementing Council Regulation (EC) No 1172/98 on statistical returns in respect of the carriage of goods by road
18-13
Annex 3. Commission Regulation (EC) No 2163/2001 of 7 November 2001
concerning the technical arrangements for data transmission for statistics on the carriage of goods by road
18-16
Annex 4. Commission Regulation (EC) No 6/2003 of 30 December 2002
concerning the dissemination of statistics on the carriage of goods by road
18-24
Annex 5. Commission Regulation (EC) No 642/2004 of 6 April 2004 on precision
requirements for data collected in accordance with Council Regulation (EC) No 1172/98 on statistical returns in respect of the carriage of goods by road
I. Council Regulation 1172/98
A number of Community legal acts dating from the 1970s and 1980s have provided basic statistical data on inland transport. Council Regulation 1172/98 is designed to provide the Commission, other Community Institutions and national governments with comparable, reliable, harmonized, regular and comprehensive statistical data on scale and development of the carriage of goods by road necessary for framing, monitoring, controlling and evaluating Community policy. This is achieved by expanding certain essential aspects of the data previously collected by the two Council Directives on road goods transport statistics (78/546/EEC and 89/462/EEC).
The major changes between the previous Directives and Regulation 1172/98 in the data collected are:
• describing the regional origin and destination of intra-Community transport on the same basis
as national transport;
• providing a link between the carriage of goods and the vehicle journeys by measuring the
degree of utilization of vehicles carrying out this transport;
• providing information on the load capacity, maximum permissible weight, axle configuration
and age of vehicles;
• providing information on the cargo type of goods and, where relevant, the category of
dangerous goods;
• providing Eurostat with micro-data from Member States rather than tabulated data. This gives
Eurostat the ability, subject to safeguards on confidentiality, to produce information on many more aspects of the carriage of goods by road than hitherto.
In order to limit the statistical burden on enterprises, the Regulation:
- allows countries to exclude from the scope of the survey all operations by very small
vehicles (up to 3.5 tonnes payload or 6 tonnes maximum permissible laden weight). In general, these small vehicles are used in European Union countries for short-range transport, and particularly own account transport, which are not crucial to the common transport policy;
- encourages countries to make the best use of the data which they currently collect to
describe both the transport of goods and the vehicle journeys by introducing additional ad hoc codes into their national statistical services without further extending the questionnaires used at present, thus imposing little extra burden on enterprises.
The text of Council Regulation 1172/98 is included as Annex 1 of this Manual.
Commission Regulation 2691/1999, included as Annex 2 of this Manual, amends the country codes specified in Annexes A and G of Regulation 1172/98.
Commission Regulation (EC) No 2163/2001 provides details on the technical arrangements for data transmission for statistics on the carriage of goods by road and is included as Annex 3.
Annex 4 provides the Commission Regulation (EC) No 6/2003 concerning dissemination of statistics on the carriage of goods by road.
INTRODUCTION
II. Structure of the Manual
This Manual provides detailed information to support the implementation of Council Regulation 1172/98 in Member States and candidate countries. This information is structured as follows:
Part A: Recommendations for sample surveys of the transport of goods by road
The aim of Part A of the Manual is to provide general guidelines for the execution of surveys of the transport of goods by road in countries that would collect the information required by Council Regulation 1172/98. The assumption is made that the survey is of a sample of the activity of road goods vehicles. However, in some cases, it may be necessary to carry out a first stage sample of vehicle owners as it may not be possible to sample the vehicles directly.
This part of the Manual does not set out to provide a comprehensive or prescriptive description of how a survey should be carried out to collect the information required by Council Regulation 1172/98. Rather, it covers principles and methods that can be and are being used. The Manual is relevant both for the setting up of new surveys and for the re-design of existing surveys.
Statistical information is the result of a series of operations. Each one of the operations has to be carefully controlled to ensure the eventual product is as good as possible; or, at the minimum, fit for its purpose - in this case of providing useful information to the reader. Basically, carrying out a sample survey is very comparable to any manufacturing process. At the start there is design and pre-production planning (not forgetting cost considerations), then there is production (for surveys this equates to despatch, receipt and processing of questionnaires) and finally marketing (presenting the data collected in the format best suited to needs of the user).
Part B: Definitions, explanatory notes and recommendations relating to the variables contained in Council Regulation 1172/98
Although the Regulation itself provides some definitions and some comments on methodology, experience in implementing statistical legislation has shown that it is useful to provide additional information to assist countries and to promote harmonisation in the collection of statistics.
Part B of the Manual therefore provides a systematic reference for all variables in the Regulation, with definitions, additional explanations and recommendations. The status of this information varies; some parts are taken directly from the Regulation, while others have been proposed by Eurostat and may or may not have been endorsed by the Working Group.
This part of the Manual will be continuously updated to reflect experience gained in the
implementation of the Regulation. Wherever possible reference will also be made to the Glossary
for Transport Statistics, the common reference of definitions for all transport modes (see also section IV - Inter-secretariat Working Group on Transport Statistics, later in this Chapter)
Part C: Rules for the transmission of data to Eurostat, data validation and data dissemination by Eurostat
Part C of the Manual provides guidelines on the technical aspects of data transmission to Eurostat. It covers elements such as data structures, record formats, filenames, and electronic data transfer. It also covers the PERT system used by Eurostat to process the data and the validation checks of the data carried out by Eurostat. Finally a chapter deals with possible tables of the data that will be disseminated by Eurostat subject to the constraints of confidentiality.
III. Statistical needs in relation to Community policies
Foremost amongst these challenges are the environmental objectives and, as recognised by the Prague Declaration adopted by the Pan European Transport Conference in 1991, the necessity of developing transport networks on the complete European scale and of integrating the greater European transport market. The changing needs of the Commission for data on transport is illustrated in the following table.
Past needs (still relevant) New needs
Goods transport Passenger transport
Transport (goods, passengers transported) Traffic (vehicle movement)
Transport demand + supply Transport impact
Inland modes All modes
Modal data Intermodal data
National data International data
Western Europe Central and Eastern Europe,
Mediterranean basin
The availability of transport data of good quality, conforming to common definitions, is essential for good policy formulation, sound investment decisions, useful economic and market trend analyses. These needs are illustrated in the following table; their relative importance is indicated by the number of plus (+) signs.
General transport policy field and data needs of the Commission
Policy field Need for transport data
Infrastructure policy/Trans -European Networks (TEN) +++
Special policies for transport modes +++
Intermodal Transport ++
External costs and environment, energy ++
Traffic safety ++
Citizen network +
Internal Market and Competition +
Negotiation with Developing Countries +
Development of peripheral regions, cohesion +
Social policy, Employment +
INTRODUCTION
Data sets Important data Modes Priorities
Value created all modes 2
Expenditure for transport all modes 2
General economic aspects
Cost and prices all modes 1
Aggregated data (passengers, pkm, tonnes, tkm). Volume/performance
all modes 1
Disaggregated demand data all modes 2
Origin - destination all modes (including
passenger transport)
2 Transport demand
Traffic flow on the network road, rail, inland waterway 1
Enterprises, employment all except rail/pipeline 1
Vehicle stock road, all modes 1
Transport supply
Transport infrastructure (length, capacity)
road, rail, inland waterway 1
Safety (accidents/fatalities) road/rail/air/sea 2
Environment (emissions, noise energy consumption, etc .)
all modes 2
Transport impact
Special and economic impact (employment, growth, cohesion)
TEN Networks (all TEN modes)
2
IV. Intersecretariat Working Group on Transport Statistics
Frequent reference is made in this Manual to the Glossary for Transport Statistics, which is a
product of the Intersecretariat Working Group (IWG) on Transport Statistics, set up in February 1991 by the Eurostat, ECMT and UNECE secretariats.
The IWG has worked to harmonize the definitions of transport data at international level in order to ensure comparability of the statistics published by the three international organisations. Related international organisations (such as the International Union of Railways, the International Road Transport Union, the International Road Federation, the International Union of Public Transport, etc.) and representatives from National Statistical Institutes have also participated in this work.
In 1994 the IWG produced the first edition of the Glossary for Transport Statistics, containing
standard definitions for terms used in transport statistics in the fields of rail, road, inland waterway
and oil pipeline transport. The Glossary has been published in English, French, German and
Russian. Translations have also been made in Spanish and Arabic.
The IWG has continued its work on the Glossary to cover other modes of transport and to extend
the definitions to cover accidents, market indicators and prices, urban and regional transport, and
environmental factors. A second edition of the Glossary was published in 1998. This second
edition includes new chapters for maritime and inter-modal transport statistics. A third edition of the
Glossary has been published in 2003.
TheGlossary for Transport Statistics is available on the CIRCA web site (see Foreword).
V. Historical background to the Manual
In the area of transport statistics, technical assistance was provided in the form of two UNECE/ECMT/ Eurostat Works hops. The first workshop, held in 1994 assessed the demands and requirements of statistical offices of countries in transition regarding transport data collection, organisation and automation. The second Workshop, in 1996, concentrated on the methodological problems in the collection of statistics on the transport of goods by road by means of sample surveys.
Following the training at the second workshop, Eurostat invited the central European countries to participate in a PHARE programme of pilot surveys on road freight transport. The aim was to collect data similar to that collected within the EU under the Directives in force at that time, as well as some of the extra data that would be required under the new Regulation then under consideration. The pilot surveys were completed in 1998 and the results were published by Eurostat in 1999. Most of the countries that participated in the pilot surveys now carry out such surveys on a regular basis.
PART A
Recommendations for sample surveys
on the transport of goods by road
Chapter 1 GENERAL PRINCIPLES OF SAMPLE SURVEYS ...1-1
1.1 The structure of Part A...1-3
1.2 General principles of sample surveys ...1-4
Chapter 2 SETTING THE SURVEY OBJECTIVES ...2-1
2.1 Principles of data quality ...2-3
2.1.1 Quality criteria for statistical data...2-3
2.1.2 Development of data quality...2-4
2.1.3 Data dimensions and data needs ...2-5
2.2 Data needs ...2-6
2.2.1 Identifying user groups - who wants what ...2-6
2.2.1.1 Data requirements of governments ...2-6
2.2.2 Monitoring user needs ...2-7
2.3 Stock taking...2-8
2.3.1 What should be collected ...2-8
2.3.2 What is already available ...2-8
2.3.3 Who are the potential respondents - problems of co-operation ...2-9
2.3.4 The population ...2-9
2.3.5 Budgetary and other resource constraints ...2-10
2.3.6 Legal aspects...2-11
Chapter 3 PREPARATIONS FOR THE SURVEY- SAMPLE DESIGN ...3-1
3.1 General principles of sample surveys applied to goods road vehicles ...3-3
3.1.1 Sampling in space...3-3
3.1.2 Sampling over time. ...3-4
3.1.3 Sampling over domains ...3-4
3.1.4 Sample size...3-4
3.1.5 Avoiding bias ...3-5
3.2 Registers for road transport surveys ...3-6
3.3 Defining the sampling frame...3-8
3.4 Sample designs ...3-8
3.4.1 Simple random sampling ...3-9
3.4.2 Stratified Sampling ...3-10
3.4.2.1 Proportionate Stratified Sampling...3-11
3.4.2.2 Disproportionate Sampling - equal allocation ...3-12
3.4.3 Disproportionate sampling - optimal allocation...3-13
3.4.4 Compromise solutions in stratified sampling ...3-14
3.4.5 Cluster and multi-stage sampling...3-17
3.5 Drawing the sample...3-19
3.5.1 Extraction of data from vehicle register ...3-19
3.5.2 Calculation of start and interval numbers for the survey and selection of sample .3-19
3.5.3 Allocation of records to relevant weeks in quarter ...3-19
3.6 Encouraging response...3-20
3.6.1 The benefit of publicity...3-20
3.6.2 Minimising the response burden ...3-21
3.6.3 Checking ...3-21
3.6.4 The benefits of a reminder system...3-21
3.6.5 Incentives ...3-22
Chapter 4 PREPARATIONS FOR THE SURVEY- QUESTIONNAIRE DESIGN ...4-1
4.1.2.2 Data on the vehicle... 4-7
4.1.2.3 Data on journeys... 4-8
4.1.2.4 Data on the goods ... 4-9
4.1.2.5 Collection and delivery journeys ... 4-10
4.1.2.6 Possible additional variables ... 4-10
4.1.2.7 A model list of questions ... 4-11
4.1.3 Pilot testing ... 4-13
4.2 A model vehicle questionnaire ... 4-14
4.3 Instruction for completing the questionnaire on the survey of road transport of
goods... 4-19
Chapter 5 PREPARATIONS FOR THE SURVEY- MANAGEMENT ASPECTS ... 5-1
5.1 Management of road freight surveys ... 5-3
5.1.1 Project control ... 5-3
5.1.2 Overview of the survey management system... 5-7
5.1.3 Before the start of field work ... 5-8
5.1.4 During the field work ... 5-9
5.2 Computer controlled survey administration ... 5-12
5.2.1 The aim of the system ... 5-12
5.2.2 Development of the system ... 5-13
5.2.3 Functions of the system ... 5-14
5.2.4 Suggested working processes for the statisticians... 5-16
Chapter 6 DATA COLLECTION AND DATA ENTRY ... 6-1
6.1 Flexible organisation of statistical automation ... 6-3
6.1.1 The Statistical Production Process... 6-3
6.1.2 Traditional (Centralised) Computerised Data Processing ... 6-4
6.1.3 Changing Roles in Automation... 6-4
6.2 Preparing the data for analysis ... 6-5
6.3 Dealing with non-response ... 6-7
6.3.1 What is non-response? ... 6-7
6.3.2 What is the effect of non-response? ... 6-8
6.3.3 What should be done about non-response?... 6-9
6.3.4 Item Non-Response ... 6-10
6.4 Treatment of journeys with more than one stop... 6-11
6.5 Treatment of collection and delivery journeys ... 6-13
6.6 Modified Treatment for New Surveys... 6-19
Chapter 7 PROCESSING AND ANALYSIS ... 7-1
7.1 Computer processing and record layout ... 7-3
7.1.1 Computer processing ... 7-3
7.1.2 Elaboration and application of nomenclatures ... 7-4
7.1.3 Model layout for computer records ... 7-4
7.2 The calculation of weighting factors for the survey ... 7-11
7.2.1 General Principles ... 7-11
7.2.2 Methodology where the vehicle register is reliable and updated regularly ... 7-14
7.2.3 Methodology where the vehicle register is observed to be out-of-date and
inaccurate ... 7-14
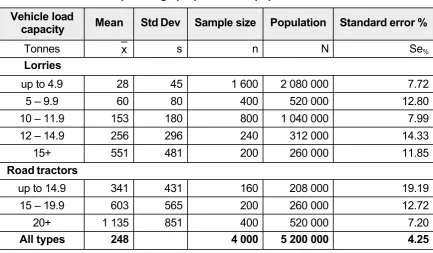
7.3 Calculation of sample standard errors of the survey ... 7-15
7.3.1 Calculations from sample survey for error estimation of total tonnes and
tonne-kilometres ... 7-16
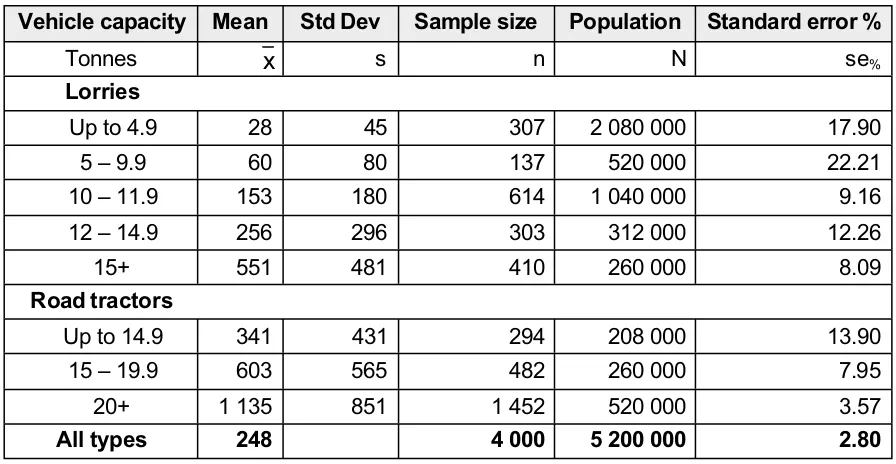
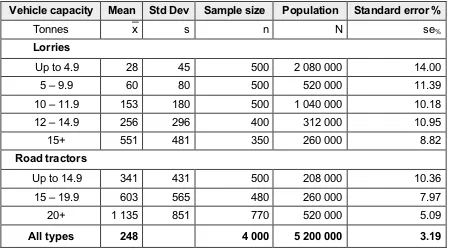
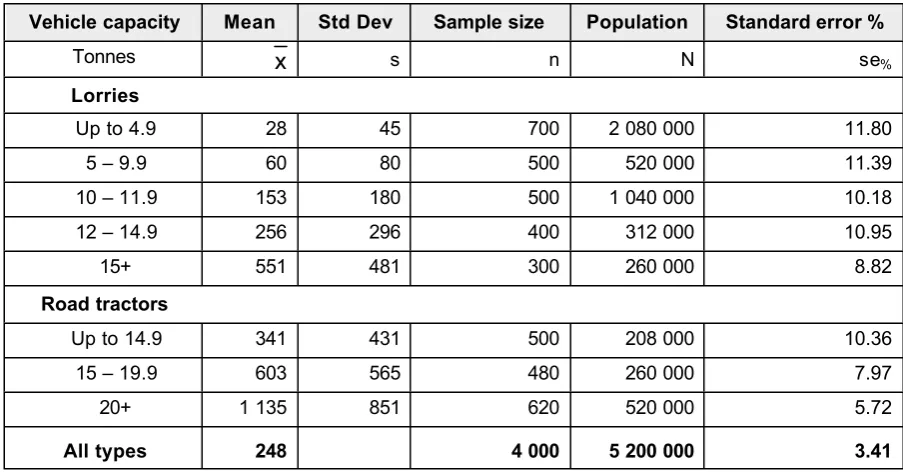
7.4 Use of estimated sample errors to improve the precision of future surveys ... 7-17
7.5 The calculation of unbiased estimators... 7-21
Chapter 8 PUBLICATION AND DISSEMINATION AT NATIONAL LEVEL ... 8-1
8.1 Production methods ... 8-3
8.2 Publication and dissemination strategies ... 8-3
8.3 Disclosure control of tabulated data. ... 8-3
8.4 Profile of a standard publication... 8-4
8.4.1 Introduction ... 8-4
CHAPTER 1. GENERAL PRINCIPLES OF SAMPLE SURVEY
1.1
The structure of Part A.
The structure of Part A of this Manual follows the natural sequence of work that should occur when designing and carrying out a sample survey regardless of the subject matter. In practice, it will be found that some of the stages set out in the manual need to run in parallel to achieve a desired timetable. Some stages may need to be varied slightly or even repeated. A major reason for this is the need to justify the demand for information of the user against the cost of the survey and the burden of providing the data placed on the respondents. This trade off can result in the need for modifications to the survey design and plans that may have been agreed previously.
The following stages should occur:
• The first stage is to explore demand and supply in the area of interest. As this manual
is directed at the collection of information on the carriage of goods by road, and in particular, at meeting the data requirements of Council Regulation 1172/98, it might be thought that the Regulation, in itself, would be sufficient justification. This is not so. Every country will have particular needs for data on this topic. A comprehensive inventory of user needs should be prepared. Subsequently, these needs have to be considered in the light of the priority attached to each of them by the country taking into account the requirement of consistency within the general framework of European
Union road transport statistics. The constraints of the costs of data collection,
response burden on data suppliers and also the feasibility of collecting a particular
statistic have to be included in the equation. The final result should be an identification of the target population (that is, the set of road goods vehicles that will be the subject of the survey) and the set of variables and their definitions that will form the basis of the questionnaire to be sent to the operators of the vehicles selected for the sample.
• The focus of the first stage is mainly on the data user. The second stage deals mainly
with the operational aspects of a survey. This covers the theory of survey sampling;
the consideration of available sampling registers; sample designs and
questionnaire design. However, an important component of this stage is to keep in
mind that the most important person of any survey is the respondent. No matter how
perfect is the sample register or how sophisticated the sample design, the survey will not be a success unless the people approached for information - the respondents - do just that. RESPOND!!
• The third stage should start at the same time as the second stage but should also
continue throughout the rest of the survey. This stage covers the management
requirements for surveys. Many surveys are carried out on an annual or a quarterly basis. Such a time scale provides some leeway for unforeseen events that lead to slippage in a survey timetable. Most surveys of goods road transport are carried out on a weekly basis. There is little or no scope for catching up. The planned timetable must build in, from the outset, sufficient leeway for both foreseen (for example, public holidays) and unforeseen eventualities.
• The next stage covers the collection and preparing the data for computer processing.
This is followed by the processing and analysis of the data collected. The order of the
work is editing, imputation, estimation, validity checking and addition of
weighting factors. The result of these operations leads to a database - the
• A dissemination policy is essential to ensure that the results of the survey are communicated to all the users as soon as possible and in a format suitable for their needs. The presentational aspects and the mode of dissemination should be taken into consideration when deciding on the formats that will be used. An important aspect
of the dissemination policy is disclosure control. This is covered in the final section
of Part A.
1.2
General principles of sample surveys
The basic purpose of any survey is to collect information. The term “survey” does not, in itself, convey any indication of the number or percentage of the total units that could be covered. If the survey attempts to cover all the units, the survey is termed a census. If only a few units are surveyed and little or no attempt is made to relate the units surveyed to the total number of units, the survey is normally termed a “field study”.
The term “population” is used to describe the total number of units that could be covered in a particular survey. The term arose because most surveys in the early days of development of the methodology were surveys of the social condition of people.
Where a population is large it is usually very expensive to carry out a census. However, small-scale field studies are unlikely to provide sufficient data to enable reliable estimates to be calculated of the desired attributes of the population. The aim of a sample survey is to collect information from a representative selection (the sample) of a population in such a way that the desired attributes of the population can be estimated to a known precision according to standard statistical theory. The difference between the estimate for a variable and the true value is termed the total error in the process. This is a combination of two types of error: sampling errors and non-sampling errors.
Sampling errors arise because the survey is restricted to a sub-set (the sample) of the population. The sampling error (usually termed standard error) is a measure of the expected variability between different results from repeated samples of the same size and design under the same survey conditions. Non-sampling errors are errors that would exist even if a census of the population was taken; for example, reporting errors, errors of coding and data processing.
There are two important basic points to be emphasised about sample surveys. The first is that estimates for a population based on a sample are probability statements. The second point is that the precision statements about these estimates rely on the assumption that the sample has been chosen at random. That is, the method of selection of the sample gave each unit of the population an equal (and non-zero) chance of being chosen for the sample.
A further point to bear in mind is that the theory of sampling assumes that responses will be received from all the selected units and that these responses will be accurate. In practice this never occurs. There will always be some non-response - some will refuse to answer; some cannot be contacted or there will be another reason for no reply. The information supplied may not be what was sought because the question was misunderstood; the respondent could not remember or deliberately has given wrong information.
CHAPTER 1. GENERAL PRINCIPLES OF SAMPLE SURVEY
The general principles for the setting up of new sample surveys or the redesign of existing surveys are well documented in many textbooks on survey design. This Manual assumes that the reader is aware of these general principles and also of the terminology used in standard statistical theory. Some references for further reading on sample surveys are given in the Bibliography. The Manual aims to set out a framework of procedures that countries might follow if they wish to mount sample surveys of the carriage of goods by road by vehicles registered in their country.
The main aims of sampling are:
CHAPTER 2. SETTING THE SURVEY OBJECTIVES
2.1
Principles of data quality
The starting point of any survey should be a detailed examination with users of their needs for data that might be obtained from the survey. This should lead to the creation of an inventory of user requirements with some indication of the priority attached to each request. In these discussions the statistician should keep in mind the basic principles underlying the production of good quality data.
2.1.1 Quality criteria for statistical data
• Data should be available
Demand for data is always greater than the availability of data (however, some data are available but not needed). Not all of the data available are accessible (i.e., data sets open to the public). Not all of the data available and known are used (user -friendliness of statistics needs improvement).
• Data should be relevant
Available resources normally cannot cover demand for data (priorities to be set, resources need to be shifted to the data most urgently needed). There are, however, data that are not needed - where there are redundancies in the data sets (concerning new activities, the data sets with the least redundancy should have the highest priority).
• Data should be comprehensive and complete
The more complete the data sets are, the greater the value for analyses (the more synergies):
- Time: development over time;
- Space: comparison of countries, regions, policies;
- Modes: comparison of modes, modal split.
• Data should be comparable, consistent and compatible
Data sets should be as consistent as possible. Comparability of data over time, between countries and modes is important at the international level (there is a conflict of goals between internal and external comparability - to achieve international comparability some countries would have to change their time series).
• Data should be understandable
Results can change due to real developments or due to changes in the statistical system. To allow interpretation of statistical data, changes in time series and differences in definitions / methods between countries or modes have to be indicated and explained.
• Data should be current
The shorter the delay between the reference period and the availability of data, the bigger is the benefit; a short delay is generally more important for aggregated data than for disaggregated data (the overall trend is more interesting for policy-makers).
• Data should be precise
2.1.2 Development of data quality
• availability
Due to the strong growth of international transport, data on international transport are becoming more important (e.g. European dimension of more and more transport infrastructure projects: TENs). However, due to the removal of border controls, data availability is decreasing. The liberalisation of the transport markets and the decreasing budgets of statistical institutions also have led to decreasing availability of data.
• relevance
While existing data sets (transport market: demand and supply) are still relevant, there is an increasing demand for data on the impact of transport and on transport infrastructure. Data needs of policies are problem oriented: growth of transport demand and modal-shift creates problems in some fields (infrastructure, safety and environment). Data are needed to develop and monitor policies to solve problems.
• comprehensiveness
Data is needed for more modes and countries; the enlargement of the EU makes it more difficult to achieve comprehensiveness of data sets (time series). This enlargement factor needs to be considered well in advance. If the data sets are not comprehensive about data, its availability should nevertheless be given.
• comparability, consistency and compatibility
There is conflict between comparability of data within time series and the goal of international harmonisation of data. When new data sets are created, efforts are now made to harmonise data (standard definitions, comparable methods, etc.). Internationally these are of special importance.
• understandability
Understandability of data and information about data becomes more important since the use of data is widening (in non-expert circles). At the same time, understandability becomes more difficult to achieve, since breaks in series accumulate and definitions and methods change.
• delay
The need for current data is increasing. There is a growing demand for topical data from politicians and the public. The gap between demand and availability of data is more and more bridged by estimates (especially when only trends are interesting), with the risk of data pollution (different estimates).
• precision
CHAPTER 2. SETTING THE SURVEY OBJECTIVES
2.1.3 Data dimensions and data needs
• absolute quantity
The absolute quantity of the variable as such does not provide much information. Added information value is created if quantities are put into relation to other quantities (calculation of growth rates, modal shares or per capita data). Absolute quantities are used less than growth rates or relative quantities (e.g. modal shares); absolute quantities provide, however, a basis for further evaluations.
• quantity with relation to other data
Data sets should be comprehensive to allow calculation of relative quantities (e.g. modal shares). Calculation of shares depends also on comparability and precision of data (not always given in the case of transport demand data, where modal shares are often calculated). Data on modal shares and their development are often used in transport policy, and therefore they are important.
• change over time
Growth rates are often more interesting than the absolute size of a variable. There is a strong demand for data on recent trends; the more current data are the better. Data should allow differentiation between recent (short-term) trends and long-term development. The calculation of growth rates requires a certain minimum of quality of data, otherwise growth rates are misleading; planners and politicians sometimes require statistical information that is not available from statistical institutions, but available statistics can serve as a basis to produce the data needed.
There is a great demand for current data and current trends; future growth rates for the development of policies and for planning purposes are more interesting than growth rates of the past.
• interaction with other data (elasticities)
Information about interaction between variables (statistical data) is especially important if there is a big difference in availability of data, i.e. if one variable is given and the other variable has to be calculated. If elasticities are known, the given development of the one variable can be used to forecast the development of the other variable. For example, price - demand elasticities can be used to forecast the impact of fuel price increase on road transport demand; forecasts on GDP or on motorization growth are used to forecast the transport development. Data are very important for transport policy. Information is especially needed for the development of new policies.
• meta-information
2.2
Data needs
2.2.1 Identifying user groups - who wants what
It is important that all potential users who might be interested in the subject matter of the survey are involved in the discussions of the information that might be collected in a survey.
• Government is often the main user group as well as the source of funds for the
survey. The data needs of government are reviewed in the following section.
• Research institutes need the same data as government but may require more
detail. These institutions often carry out work commissioned by others. For example, analysing the consequences of a policy measure or a proposed measure.
• Educational establishments needs are very diverse but it is also very difficult to
obtain a consensus view, as most users from this area tend to want very detailed data for a very narrow field of interest.
• Businesses want information about their industry group as well as data on general
economic indicators.
• Trade associations and other non-profit organisations want similar information as
businesses.
• The general public is an important market for statistics. It is difficult to gain a view
of their demand for data as their needs are widespread. One way to assess these needs is to maintain a note of all the requests for data in the subject field of a survey that had been received over the past three years.
• Although this manual concentrates on the data needs of the European
Commission and the Member States, the needs of other international organisations should not be overlooked.
2.2.1.1 Data requirements of governments
• General considerations
Politicians need certain data on transport, mainly for forecasting and transport planning purposes. However, data required by Governments to facilitate transport policy and planning are not synonymous with official transport statistics.
Regardless of the data type, changes over time (e.g. direction and magnitude) are of more interest than the absolute level (i.e. 1 billion tonne-kilometres) of a given transport variable.
CHAPTER 2. SETTING THE SURVEY OBJECTIVES
• Requireme nts concerning transport data availability
It is important to be able to obtain highly aggregated transport data at short notice. For example, figures of tonnes and tonne-kilometres by mode of transport should be available as a first priority.
Time requirements, however, regarding disaggregated transport data are less strict because these data take longer to collect and analyse. For example, the production of detailed Origin/Destination matrices for purposes of trade analyses may take a couple of months.
The statistical reporting system for transport must be readily available and should respond to non-standardised, “all-of-a-sudden” requests (i.e., “Please produce - by lunch time - a cross-tabulation of variable X with variable Y over time).
Servicing of data, utilising contemporary storage and telecommunication methods is highly advisable. For example, it is quite difficult, sometimes, to “sell” plain figures; reformulating the data for visualisation purposes may increase their “sale”.
Build-up and maintenance of a data bank on (statistical standards) methods is recommended (i.e. is there any change in the correlation between variable X and variable Y over time?).
2.2.2 Monitoring user needs
Asking users to list requests or select items from a number of pre-printed suggestions is unlikely to produce an adequate or useful set of proposals.
• The statistician should guide the user to express needs in clear and unambiguous
language. To do this the statistician should ask about the intended application of the data by the user in order to evaluate the request and to judge its relevance. It is also important to define with precision the information you have been asked to collect. Discuss with those who will use the data what they think they want and what they want to do with the data when you have collected it. Not all of the people who may have asked you to collect the data may have thought through their proposed analytical work, and some may not have a good knowledge of how the road haulage industry operates!
• User requests tend to be open ended, particularly where cost considerations are
not the concern of the user. It is useful to distinguish between proven needs and potential needs. Users also may have conflicting needs; they want data to be detailed, accurate and quick. Asking a user to rank their requests in order of preference can provide a useful guide provided users are not permitted to give equivalent ranking to items - equal rankings can result in every item being given top priority!
• It often occurs that different user groups have related but deviating needs on a
certain topic. It is better for the statistician to try to establish a consensus on the topic rather than add the varying wishes to the inventory of needs. Joint consultations with these users can prove helpful.
• Choices will always have to be made. Preference should always be given to
There is a dilemma in modern statistical policies. There is a growing tendency towards client-orientation that could lead to tailor-made statistical products. Although the latter would be geared to the specific requirements of specific user groups, the needs of the wider clientele groups for comparable data should not be overlooked. Thus, the need for tailor-made data has a counterbalance in the need for standardisation, not only for harmonised statistics but also to limit response burden.
2.3
Stock taking
The order in which the items are considered before starting data collection is important, although the order in which they are tackled in a data collection project may depend upon the conclusions reached about an earlier item.
Of course, many of the points made in this manual apply to the collection of statistics in any area. Basically, these points are straightforward and obvious; however, the success of any data collection usually depends in great part upon the care taken in planning at every stage of the collection process. The odd ”obvious” point sometimes gets overlooked when you are involved in the detail of a project. Mechanical or resource problems rather than statistical problems are more likely to be the main reason for a data collection exercise not to realise its full potential.
2.3.1 What should be collected
After you have had the discussions suggested in section 2.2, make a list of the data that you would like to collect and all the requests you have received that you are prepared to consider. Allocate the variables to four groups:
• The essential data – if you cannot collect this data, then you need to go back to
those who asked you to collect it in the first place for some very serious discussions;
• The desirable data - in this group comes data which is almost essential but you may
need to give operators sufficient time to organise their recording systems to be able to provide the information to you;
• The useful data - helps interpretation but be careful not to overload the
questionnaire. Asking too many ‘nice to know’ questions may be a major reason for poor response rates.
• The "not this time" data - in this group will come the requests that do not readily fit
into the general scope of the survey or are too expensive, too detailed, likely to cause offence to the respondents, etc. If extensive discussions have been held with a wide variety of user groups, it is likely that quite a number of the requests received will fall into this fourth group.
2.3.2 What is already available
Having decided what you would like to collect, you need to put each of the data items of the first three groups into one of five categories:
• Already collected, from at least some operators if not all.
• Not collected, but the operator/user ought to know the information as it should form
CHAPTER 2. SETTING THE SURVEY OBJECTIVES
• Not collected, but likely to be available in normal operational circumstances. More
notice of the need for this data may be required and, in some cases, in the early months of the survey, you will have to accept that the information may not be available.
• Not collected, but operators might be able to provide it if sufficient warning is given
in advance (and operators could be persuaded to do it!).
• Not collected and unlikely to be available in normal operational circumstances.
If you cannot allocate the data items you wish to collect to one of the first three categories above, you need to consider carefully whether, given sufficient notice, the operator/user would be able, and willing, to record and retain the information in order to give it to you (at minimal cost and little inconvenience). If not, you need to reconsider whether you should collect this data item.
2.3.3 Who are the potential respondents - problems of co-operation
Having got this far and decided what to collect, you need to consider how to collect it. You need to look at the structure of the industry: is it mainly large companies or mainly small companies with a few large ones?
In most countries the road haulage industry is characterised by consisting of a large number of owner-operators - a single person with one lorry, or a small company with one or two lorries. At the other end of the scale, there will be one or two very large companies owning a large number of vehicles, possibly spread around a number of depots. Although around 80 per cent of the companies may be owner operators with only one or two vehicles, they are likely to account for only 20-30 per cent of the total road haulage activity. The 20 per cent of companies being larger will deal with 70-80 per cent of activity (measured in terms of tonne-kilometres).
Is there a trade association you can consult about the industry - speak to it, explain your reasons for wanting to collect the information and try to get it to support your data collection activity. If not a trade association, there may be a government body or an international body to whom you could speak to get their support for your survey. It is a significant help in getting response to these surveys if you can say in a letter which goes out with the survey form that the trade association of the industry supports this survey.
Are there special factors in this transport mode in your country? Is activity very seasonal (due to weather)? Is the mode fairly homogeneous, or is it broken up into very specific specialisations, which could affect your data collection?
2.3.4 The population
It is important to define exactly the area of interest – the statistical population. Is it to cover:
• "hire or reward" and "own account". Are separate estimates of these types of
activity required?
• all goods vehicles (including small pick-up trucks and vans with a carrying capacity
level of small vehicles from their survey. For the first survey carried out by a country, it is often useful to include vehicles with a smaller payload than 3.5 tonnes (from 1 or 1.5 tonnes) in order to measure the amount of national transport performed by these small vehicles. Having measured the work of these small vehicles on the first survey, they can be excluded from future surveys if their work is only a small percentage of the total. Alternatively, the smaller vehicles might be included in a survey once every five years.
• additionally, the Regulation does not apply to ”vehicles whose weight or dimensions
exceed the normal permitted limits of a country” or to ”agricultural vehicles, military vehicles and vehicles used by public administrations and public services with the exception of road vehicles used by railway administrations”;
• information about the operator (i.e. the road haulage company), the activity (i.e. the
carriage of goods) or the client (i.e. the freight forwarder or the customer)?
• regional estimates as well as national figures?
2.3.5 Budgetary and other resource constraints
Before going ahead with any collection of information, an assessment must be made of the resources needed:
• The first resource is staff.
− How many will be needed in the setting up and the pilot stages?
− How many are needed on an annual basis when the data is being collected?
There will be encoding and data analysis staff costs, as well as staff for the sample selection, questionnaire dispatch and survey management;
− Do not overlook the staff costs of reminder exercises - response rates are rarely
satisfactory without at least one or two reminders to those who do not reply to your first approach; if a reporting obligation exists, penalty procedures could be enforced.
− Will all the staff be under your direct control, or do you have to negotiate with
others (e.g. in regional offices) for their services?
• The second resource is computing- use a computer wherever possible in place of
staff. But this means you will need computer-literate staff.
− Can samples be selected from the register by computer?
− Can the computer be used as a tool to manage and control the questionnaire
dispatch and receipt?
− Are off-the-shelf computer programs available to help in any part of the survey
process?
− Include the computing costs of data preparation and data analysis.
• Do not forget that ’time’ is a resource. It is a truism that everything takes three times
longer than it should!
• In addition to the cost of the above three resources, include the monetary cost of
CHAPTER 2. SETTING THE SURVEY OBJECTIVES
expenses if field staff are going to be used for personal interviews, and costs of
chasing later respondents, or of penalty procedures.
• There are bound to be additional set-up costs (e.g. the cost of equipment; buying
off-the- shelf computer programs or having purpose-built programs written).
• Add a contingency allowance to your costs.
2.3.6 Legal aspects
If you are going to collect some information, will the respondents be invited to provide it on a voluntary basis or is it to be compulsory? You can only have a compulsory survey if you have a statistical law compelling people to respond and, most importantly, if your politicians are willing to permit you to use this statistical law against those who refuse to comply.
CHAPTER 3. PREPARATIONS FOR THE SURVEY - SAMPLE DESIGN
3.1
General principles of sample surveys applied to goods road vehicles
The journeys undertaken by goods road vehicles are sufficiently homogeneous that sampling can be carried out either of a vehicle journey or a vehicle time period (usually a week). A vehicle time period of a vehicle-week has been used here. It is important that sampling is carried out throughout the time period of interest - normally a calendar year. Almost certainly there will be considerable variation in the tonnes carried and tonne-kilometres performed between the very small rigid goods vehicles and the large articulated road tractors with semi-trailers. The sampling strategy should take this into account.
In designing any sample, the following points have to be considered:
• Can you limit the burden on respondents:
− by excluding some areas (for example, one-man businesses - not a good idea for
road haulage)?
− by limiting the frequency any hauler is approached, or ensuring no vehicle is
selected more frequently than once a year?
• Will stratification of the sample improve the efficiency?
3.1.1 Sampling in space
Is the data collection to be from a sample, or must you have a census? It is unlikely, but the data may already exist in an administrative system - if this is a new survey a check of likely administrative sources should be made.
If the data is not collected already, can a representative sample be taken to reduce your processing costs? A sample is likely to be cheaper than a census for you to carry out and put less of a burden on the respondents. But in order to use a sample, you have to ensure there are enough events occurring over the period you are covering of a sufficiently homogeneous nature in order to give you the sample estimates you want with sufficient accuracy. This may well depend upon whether you want information about domestic and/or international movements; whether you want regional and/or national estimates; whether the respondents are owner-operators or companies, and, if companies, whether they are carrying out own-account or hire-or-reward transport.
The information about the carriage of goods by road is collected basically from the loaded journeys made by goods road vehicles. For most countries, the vehicles making these journeys are sufficiently numerous for a sample of these vehicles to provide sufficiently precise estimates of the required measures of activity. If there are 100 000 relevant goods road vehicles on a national vehicle register and a sample of 10 000 such vehicles are selected over a survey period of one year, then the sampling density in space would be 10 per cent.
3.1.2 Sampling over time.
Even where the sampling density in space has to be 100 per cent, which means that every sampling unit has to be approached during a survey, the journeys undertaken by goods road vehicles are sufficiently homogeneous that sampling can be carried out either of a vehicle journey or of the activity of a vehicle over a number of days.
A time period can be chosen to limit the amount of information that would have to be returned for any one vehicle. The period normally chosen is for activity during one week. It does not matter which day is chosen to start a week, provided that the same start day is used throughout a year and each week comprises seven days. Where the choice is made for the recording of the activity of a selected vehicle over one week, the sampling density over time is 1.92 per cent (1/52).
For international journeys the problem can arise that a vehicle may be on a journey that started before the week selected for that vehicle; the end of that journey may be during the selected week or even after that. Journeys may also start in the selected week and extend beyond the end of that week. The solution here is to provide instructions that the journeys to be recorded are all those that start in the selected week and to record the details of the full journey even if it ends after the selected week.
Trade patterns and seasonal effects have to be taken into account when carrying out surveys. These are likely to be important in road haulage surveys. This means that to avoid the possibility of bias in the results, a survey of the carriage of goods by road should aim to cover activity throughout the survey period (that is, all 52 weeks of a year should be surveyed to produce estimates of activity for the year).
3.1.3 Sampling over domains
Almost certainly there will be considerable variation in the tonnes carried and tonne-kilometres performed between the very small rigid goods vehicles (lorries) and large articulated road tractors coupled to semi-trailers. The sampling strategy should take this into account. The best way to do this is to stratify the sample by the load capacity (or gross weight) of the vehicles (the reason for this is covered later in this chapter). Road tractors should form separate strata of the sample. Although they do not have a load capacity as such, in most countries the registration details for these vehicles include a maximum load capacity (or gross vehicle weight) that the tractor is permitted to tow. If the weight data is not available for road tractors, they should still form a separate stratum of the sample.
In larger countries it is also helpful to stratify the sample by region or by some other geographical division.
3.1.4 Sample size
This is often a source of confusion. There is no handy formula providing a number. The statistician would like as large a sample as possible. The person having to finance the project wants the smallest number possible. The only useful guidance is that the number of units in a sample should be:
− No larger than you can handle;
CHAPTER 3. PREPARATIONS FOR THE SURVEY - SAMPLE DESIGN
In the guidance produced by Eurostat to Member States on the precision standards desired for the information collected under Council Regulation1172/98 on the statistics of road goods transport, it was initially recommended that a minimum of 5 000 vehicle-weeks of vehicle activity should be collected over a 12 month period. That is, the achieved sample reported to Eurostat should consist of at least 5 000 vehicle-week records. Where a country does not ask for the activity of a vehicle over a week, the sample should consist of at least 35 000 vehicle-days. In practice, most countries with large vehicle fleets cover around 15 000 vehicle -week records. However, based on the analyses of data submitted by some Member States under Regulation 1172/98, it appears that for some countries an achieved sample size of 1000 vehicle-weeks of vehicle activity per quarter would produce the desired precision standards.
3.1.5 Avoiding bias
Bias in a sample can cause systematic, non-compensating errors that cannot be reduced or eliminated by increasing the sample size. Bias in sample selection can arise:
• if the sample is selected other than randomly;
• if the sampling frame does not cover the population adequately, completely or
accurately;
• if some of the selected units refuse to reply or cannot be contacted;
• if some of the questions are answered incorrectly (response errors).
Drawing the sample randomly is essential. Where information is available to allocate the units in the population into groups (strata) with similar characteristics, drawing a random sample from each group does not destroy the randomness of a sample. In fact, the use of stratification is very beneficial if applied sensibly as it can lead to a significant improvement in the precision of the estimates.
If the sample frame does not cover the population adequately, then the units which are not in the sampling frame have no chance of being included in the sample. For road vehicles, this is most likely to occur for newly registered vehicles. Hence, if a vehicle register is used as a sampling frame, the older the vehicle register is in relation to the date of the survey period of the sample, the greater the likelihood of bias. It is usual for the sample for a quarter of a year to be selected from a vehicle register about 6 weeks before the start of
that quarter. The sample for the 13th week of that quarter will have been chosen from a
register that is some 4 months out of date. If the sample had been chosen for a full year, the one for the last month of the year would have been based on a register that was over a year old - all newly registered vehicles during that year would have no chance of being included in the sample.
The steps that can be taken to reduce the likelihood of refusals are covered later in this chapter.
3.2
Registers for road transport surveys
To draw a sample, we need a sampling frame - a register that lists all the units we wish to sample (in this case goods road vehicles) and a contact address of the owner, or a register that will enable us to sample these vehicles through their operators. For a survey of the carriage of goods by road, the best register will be that of the goods road vehicles. If this is not available or not sufficiently reliable, a register of persons licensed to operate as road hauliers (company/registered owner for private hauliers) or a business register of companies could be considered.
For each possible register the following questions need to be asked:
• Who produces the register?
− Can you gain access to it?
− Will the owners allow you to use it to draw a sample?
− Or will they draw the samples for you?
− How frequently will the owners allow a sample to be drawn - monthly, quarterly?
(There may be legal restrictions against the use of some registers!)
• How good is the register in terms of quality?
− Is the information accurate?
− Is the information up-to-date?
− How long is it before new registrations are included - a month, a year, two years?
− Does it identify the vehicles you wish to sample or will your sample include
vehicles outside your range of interest (e.g. cranes)
• Cut offs? How comprehensive is the register?
− Does it exclude small companies?
− Does it exclude vehicles in certain categories (vehicles owned by public bodies,
goods vehicles with a very low carrying capacity)?
• If there are deficiencies in the register you would like to use, can you work with the
owners of the register to improve it?
For a survey of the carriage of goods by road, the best register will be one that includes goods road vehicles. This is because the activity we wish to measure is the work that is done by goods road vehicles. That is, the weight and type of goods carried; the place of loading and unloading and the distance travelled; the characteristics of the vehicle and some information about the operator of the vehicle. Sampling vehicles also means that the burden of filling in questionnaires for operators with a large number of vehicles will be spread over time.
If a vehicle register is not available or not sufficiently reliable, there may be a system of licensing road haulage operators and a register of persons licensed to operate as road hauliers (company/registered owner for private hauliers) could be considered as a sampling frame. Using such a register means that the sample of vehicles will be clustered as the operator will be the sampling unit and thus the burden of questionnaire completion for operators with large numbers of vehicles will be concentrated into one time period -which could have an adverse effect on response.
CHAPTER 3. PREPARATIONS FOR THE SURVEY - SAMPLE DESIGN
main business of most of the companies selected will not be road haulage and many of them may not carry out even own account traffic.
It is strongly recommended that, if at all possible, a vehicle register should be used as the sampling frame for surveys of the carriage of goods by road. Even if there are problems with the quality of data recorded on the register, a vehicle register is usually the only one available that lists directly the units (vehicles) which one wishes to sample. Throughout this chapter it has been assumed that the vehicle register will be used as the sampling frame.
Nevertheless, despite the recommendation to use a vehicle register if at all possible, experience has shown that there may be considerable problems with their use as a sampling frame. Firstly, it is unusual for the organisation responsible for the maintenance of the vehicle register to be the same as that carrying out road haulage surveys. Road haulage surveys are normally carried out by the National Statistical Institute but the vehicle register is usually the responsibility of the police or another Ministry (often the Ministry of the Interior or the Ministry of Transport). Access to the register by the National Statistical Institute may require delicate negotiations at a very senior level in both organisations.
Secondly, despite any assurances to the contrary given by those maintaining the vehicle register, be prepared for errors in the data on the register and for it to be out of date. Vehicles may have been sold or scrapped within the last few months and the information not yet been added to the register. This may also have occurred between the time the sample was drawn and the questionnaire posted to the respondent. For vehicle registers that are used to collect vehicle taxes and have been running for many years, the number of such cases is likely to be very small. However, for registers that have only been set up for a few years, or are in the process of being created, experience has shown that the number of cases is quite considerable where the person contacted no longer possesses the vehicle.
Another problem with vehicle registers is that the address recorded may be insufficient for questionnaires to be delivered by post. If the vehicle register also includes a business reference number for the owner, it may be possible to amplify the address from the vehicle register by checking the address on the business register for that reference number.
A further problem relates to the long-term hire of vehicles. The owner of a vehicle recorded on the vehicle register may hire it out to another operator on a long-term basis. By the time the survey team have received the information about the name and address of the true operator it is usually too late to send a questionnaire to the true operator.
Close liaison should be maintained with those responsible for maintaining the vehicle record. The experience where some of these problems have occurred is that, where the evidence of errors has been shown to those responsible for the vehicle registers, there has been co-operation and a willingness to take steps to improve the data on the vehicle register. However, it is likely to take some years to make a significant improvement to the quality of the data on registers where more than one in five of the entries prove to be in error.
3.3
Defining the sampling frame
Having identified the best register to use to draw the sample for the survey and obtained the agreement of those responsible for the maintenance of this register that it may be used as a source for the sample of statistical units, it is necessary to examine the data that is held on this register.
The first step is to make a list of the statistical units (vehicles in the case of a vehicle register) that should be excluded from the survey. What these exclusions are (for example, vehicles with a load capacity less than 1 tonne) should have been decided when the objectives of the survey were agreed. However, it may be that the register that will be used does not contain all the necessary information to permit the desired exclusion. This may lead to a review of the coverage of the sample.
The second step is to list all the information on the register that you would wish to capture to add to the survey record. If the register already contains all the data you wish to have about a vehicle, it is sensible to abstract that data from the register and include it on the questionnaire sent to the respondent. The respondent then can be asked to check this data and correct it if it is wrong. This is much less of a burden than asking the respondent to write this information on the questionnaire.
3.4
Sample designs
Sections 3.4.1 to 3.4.4 cover the sampling strategies that can be adopted when a vehicle register is available. All the units (vehicles) on the register are called the population (of vehicles). Section 3.4.5 on cluster sampling covers the sampling of vehicles via a register of operators or businesses.
Stratification by load capacity of vehicle and by region (if the register permits) is strongly recommended.
− The use of disproportionate stratified sampling (the use of variable sampling
fractions - section 3.4.2.2) needs care. The added complexity of drawing the samples and data analysis need to be taken into consideration when planning the first survey.
− A move to a more complex sample design can always be made in a subsequent