UNIVERSITI TEKNIKAL MALAYSIA MELAKA
DEVELOPMENT OF GRAPHICAL USER INTERFACE (GUI)
FOR SMART WASTE MANAGEMENT SYSTEM
This report is submitted in accordance with the requirement of the Universiti Teknikal Malaysia Melaka (UTeM) for the Bachelor Degree of Electrical Engineering Technology (Industrial Automation and Robotic) with Honours.
by
MUHAMAD LUQMANUL HAKIM BIN MOHD YUSOH
B071310138
901223-03-5437
_______________________ Alamat Tetap:
No.19 Lorong Lautan Samudera 9/3 Seksyen 9, 42300 Puncak Alam Selangor
Tarikh: _________________
_______________________ Cop Rasmi:
Tarikh: _________________ Disahkan oleh:
SULIT
TERHAD
TIDAK TERHAD
(Mengandungi maklumat yang berdarjah keselamatan atau kepentingan Malaysia sebagaimana yang termaktub dalam AKTA RAHSIA RASMI 1972)
(Mengandungi maklumat TERHAD yang telah ditentukan oleh organisasi/badan di mana penyelidikan dijalankan)
BORANG PENGESAHAN STATUS LAPORAN PROJEK SARJANA MUDA
TAJUK: DEVELOPMENT OF GRAPHICAL USER INTERFACE (GUI) FOR SMART WASTE MANAGEMENT SYSTEM
SESI PENGAJIAN: 2016/17 Semester 1
Saya MUHAMAD LUQMANUL HAKIM BIN MOHD YUSOH
mengaku membenarkan Laporan PSM ini disimpan di Perpustakaan Universiti Teknikal Malaysia Melaka (UTeM) dengan syarat-syarat kegunaan seperti berikut:
1. Laporan PSM adalah hak milik Universiti Teknikal Malaysia Melaka dan penulis. 2. Perpustakaan Universiti Teknikal Malaysia Melaka dibenarkan membuat salinan
untuk tujuan pengajian sahaja dengan izin penulis.
3. Perpustakaan dibenarkan membuat salinan laporan PSM ini sebagai bahan pertukaran antara institusi pengajian tinggi.
4. **Sila tandakan ( )
UNIVERSITI TEKNIKAL MALAYSIA MELAKA
DECLARATION
I hereby, declared this report entitled “Development of Graphical User Interface (GUI) for Smart Waste Management System” is the results of my own research
except as cited in references.
Signature : ………..
Author’s Name : Muhamad Luqmanul Hakim Bin Mohd Yusoh
APPROVAL
This report is submitted to the Faculty of Engineering Technology of UTeM as a partial fulfillment of the requirements for the degree of Bachelor of Electrical Engineering Technology (Industrial Automation and Robotic) with Honours. The member of the supervisory is as follow:
i
ABSTRAK
ii
ABSTRACT
iii
DEDICATION
To my beloved parent, Mohd Yusoh Dollah and Rosnah Roslan, my siblings Muhamad Hasif Adha Bin Mohd Yusoh, Sarah Nur Ain Binti Mohd Yusoh and Muhamad Harith Danial Bin Mohd Yusoh, and families member, the love one, friends and lecturer from
ILP, thanks for all the non-stop supports, encouragements, and advices.
iv
ACKNOWLEDGEMENT
In the name of Allah, the Most Gracious, the Most Merciful. Biggest thanks to Allah, with all His Gracious, and His Merciful for giving me strength and ability to finish my project report up until this point. I would like to thank Mdm Siti Nur Suhaila Binti Mirin, my project’s supervisor, without her patience, advices, and also guidance, I might be stuck and lost from the project that I am doing.
As this project is my last task before I finish my journey as a bachelor student, I fell honoured to express my appreciation to all those who gave me the possibility to comprehend this project report especially my dear housemate. They keep reminding me to settle down my work in an appropriate way and also help me in generating a new idea for analysis of the mould base weight optimization.
v
TABLE OF CONTENTS
Abstrak i
Abstract ii
Dedication iii
Acknowledgement iv
Table of contents v
List of tables viii
List of figures ix
List of abbreviations, symbols and nomenclature xi
CHAPTER 1: INTRODUCTION 1
1.0 Introduction 1
1.1 Project Background 1
1.2 Problem Statement 1
1.3 Work Scope 2
1.4 Objective 2
1.5 Conclusion 3
CHAPTER 2: LITERATURE REVIEW 4
2.0 Introduction 4
2.1 Smart Waste Management System 4
2.2 Graphical User Interface (GUI) 5
2.3 Data Receiving 5
2.4 Database 6
vi
CHAPTER 3: METHODOLOGY 7
3.0 Introduction 7
3.1 The flow of work progress 7
3.2 Development of the overall system 8
3.3 Software 10
3.3.1 Microsoft® Visual Studio (Visual Basic) 2010 10
3.3.1.1 Description 10
3.3.1.2 Usability 11
3.3.1.3 Operation 11
3.3.1.4 Design of the GUI 11
3.3.1.5 Programming code 16
3.3.2 Microsoft® Access 2010 (Database) 26
3.3.2.1 Description 26
3.3.2.2 Usability 27
3.3.2.3 Operations 27
3.4 Hardware 27
3.4.1 RFBee by Cytron Technologies 27
3.4.1.1 Descriptions 27
3.4.1.2 Usability 28
3.4.1.3 Operations 28
3.5 Gantt Chart 28
3.6 Conclusions 31
CHAPTER 4: RESULT & DISCUSSION 32
4.0 Introduction 32
4.1 Previous Result 32
4.2 Present Result 34
vii
CHAPTER 5: CONCLUSION & FUTURE WORK 39
5.0 Introduction 39
5.1 Limitation 39
5.2 Future Recommendations 39
5.3 Conclusion 40
viii
LIST OF TABLES
3.1 Gantt chart 29
ix
LIST OF FIGURES
3.1 Methodology Flow Chart 8
3.2 System Flow Chart 9
3.3 Microsoft® Visual Studio 2010 11
3.4 Main Page 13
3.5 Home Page 13
3.6 Status Page 13
3.7 Exit pop up window 14
3.8 About page 14
3.9 Selection database window 14
3.10 Selected database pop up window 15
3.11 Database successfully connected pop up window 15
3.12 Warning alert pop up window 15
3.13 Status Report window 15
3.14 Launch button coding 16
3.15 About button coding 16
3.16 Exit button coding 17
3.17 Real time Date and Time coding 17
3.18 The real time date and time 17
3.19 Main Page button coding 18
3.20 Status button coding 18
3.21 Main Page button coding 19
3.22 The database path checked coding 19
3.23 Database Connection button coding 19
3.24 Read the database coding 20
3.25 Link to database coding 21
3.26 Selected Bin ComboBox coding 22
3.27 Show graph function coding 23
3.28 Home page button coding 24
x
3.30 Data grid View coding 25
3.31 Close button coding 25
3.32 Microsoft® Access 2010 26
3.33 RFBee Module 28
4.1 The bin's content percentages in April 2016 34
4.2 Selected Bin data view 35
4.3 Selected Year data view 36
4.4 Selected Month data view 36
4.5 Selected Date data view 37
4.6 Report View 37
xi
LIST OF ABBREVIATIONS, SYMBOLS AND
NOMENCLATURE
ANSI - American National Standards Institute API - Application Program Interface
FTK - Fakulti Teknologi Kejuruteraan
GUI - Graphical User Interface
GSM - Global System for Mobile
IDE - Integrated Development Environment ISO - International Standards Organization
L7 - Level 7
RW - Right Wing
MCU - Multi-point Control Unit
PC - Personal Computer
RFID - Radio Frequency IDentification
SQL - Structure Query Language
UART - Universal Asynchronous Receiver/Transmitter UTeM - Universiti Teknikal Malaysia Melaka
ILP - Institut Latihan Perindustrian
WMS - Waste Management Services
1
CHAPTER 1
INTRODUCTION
1.0 Introduction
This chapter will briefly explain the project overview on how the system is implemented and that are include the background of the project, the problem statement, the work scope, and the objective of the project.
1.1 Project Background
To develop a user friendly Graphical User Interface (GUI) called Smart Waste Management System for Waste Management Services (WMS) to monitor the waste’s level. The system are included the location, percentage of the contents in the bin in real-time and it’s also give alarm to collect the garbage in the bin if the bin’s percentage are exceed 70 percentage. Lastly, its help to reduce cost of Waste management service lorry’s to come to faculty to collect the garbage and the time energy that provide to WMS operator to clear each bins (Anagnostopoulos 2015).
1.2 Problem Statement
2 1.3 Work Scope
The Smart Waste Management System does monitoring activities and focuses on the interface that’s displays the percentage of contents in the bin, and the location. To achieve the objectives of this project is by collect the data by measuring the waste’s levels in the bin by days before the system implemented for one month, develop the GUI by using Microsoft® Visual Studios 2010 (Visual Basic) that shows the content’s level percentage, and the location of the bin, pop up window to alert the WMS when the waste exceed 70%. Receive data from hardware that been transmitted via RFBee. Compare the manually measured waste’s level and the data that receive from the hardware via the system implemented.
1.4 Objective
There are several objectives need to achieve in this project:
a) To design the Graphical User Interface (GUI) for a Smart Waste Management System that able to monitor the status and the location of the bin in real time analysis.
b) To alert the Waste Management Service operator to collect the waste when the percentage shows more than 70%.
3 1.5 Conclusion
4
CHAPTER 2
LITERATURE REVIEW
2.0 Introduction
This chapter will review from related journal to get the idea to implement the Smart Waste Management System including the system that to use, the design of the interface, how to collect the data and all the related information.
2.1 Smart Waste Management System
From the exploration journal, a lot of the journals are from India, the fact that their nation got a considerable measure of pollution and one of the significant pollution is the solid waste pollution. Refuse been heaped at the road corner, open spot furthermore walkways are ruined with rottenness and litter, streams and channels go about as waste dumps, it cause repulsive sight at certain region and undesirable environment To overcome this issue, the development of the system will be created to alert and inform the authorized person when the bin is going to full (Thakker 2015); (Arebey et al. 2009).
5 2.2 Graphical User Interface (GUI)
The purpose of GUI in this system is for the Waste Management easy to monitoring. A journal use Android application that called the application SVASTHA
which is a Sanskrit word which means “be healthy and hygienic”, that can monitor actively monitor the waste collection process and will provide real time feedback such as the waste collection status, live tracking of trucks and location of the bins. This system also can receive complaint from residents about the uncollected waste as well as the illegal disposal of wastes (Issac & Akshai 2013).
The system can also can monitor the status of the waste level in the bin by MATLAB software and then when the bin is about to full, the system will alert the authorized person by using Global System for Mobile (GSM) (Bhor & Morajkar 2015).
Microsoft® Visual Studio (Visual Basic) is one of the interfaces that been used to view regarding the removal of trash is sent to the respective area truck driver about the location of the field trash can. It’s also contains the complaint with the exact location of the trash can and if the trash can is not replaced at a right time, the microcontroller placed at the trash can intimate the information to the corporation office once again (Nadu 2014).
2.3 Data Receiving
6 2.4 Database
The collected information from the gadget can been stored in a database. One of the databases is Structure Query Language (SQL), it’s can stores all the important data for present and future utilize, the interface of the strong waste administration framework can demonstrates the current information of the database and its occasionally redesigns its information (Corlăţan et al. 2014).
2.5 Conclusion
7
CHAPTER 3
METHODOLOGY
3.0 Introduction
This chapter will briefly explain on the methods that use to develop the GUI for Smart Waste Management System, including the flow to ensure the development of the project runs smoothly, the software and the hardware used.
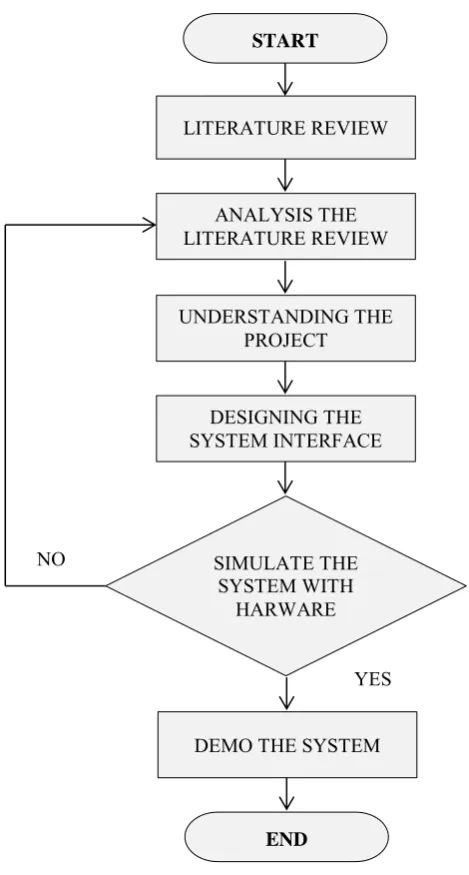
3.1 The flow of work progress
To ensure the work progress run smoothly, there are several steps that need to be followed. First, do researches of literature review from the previous journal and analysed it to understand the project that is needed to development the system, and then, design the system by using Microsoft® Visual Studio 2010 (Visual Basic).
8 Figure 3.1: Methodology Flow Chart
3.2 Development of the overall system
Before develop the system, the data before and after the system implemented must be collected. The purpose of the data collection is to compare the advantages if the system has been created. First step, collect the data by measuring the bin’s content by days for one month on April 2016.
Then, develop a GUI that called Smart Waste Management System by using Microsoft® Visual Studio 2010 (Visual Basic) to display the status of the bin including the percentage of the bin’s content (Mamun et al. 2014); (Sharma et al.
START
LITERATURE REVIEW
ANALYSIS THE LITERATURE REVIEW
UNDERSTANDING THE PROJECT
DESIGNING THE SYSTEM INTERFACE
SIMULATE THE SYSTEM WITH
HARWARE
DEMO THE SYSTEM
END
NO
9 2015) and the location of the bins (Issac & Akshai 2013). The data are been receive from the hardware via RFBee. It also will show the content’s level percentage of the bins content by monthly.
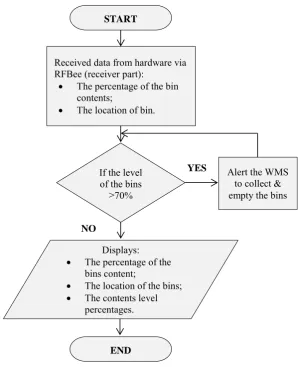
[image:24.595.167.467.261.629.2]The system will alert the WMS thru the pop up window on the system if the bin’s content reach more than or equal to 70 percent (Nadu 2014); (Ar 2015). Lastly, we compare the data of manually measured waste’s level and the data that receive from the hardware via the system implemented. The summarized of this method are been show as Figure 3.2 below:
Figure 3.2: System Flow Chart
START
Received data from hardware via RFBee (receiver part):
The percentage of the bin
contents;
The location of bin.
If the level of the bins
≥70%
Displays:
The percentage of the
bins content;
The location of the bins;
The contents level
percentages.
END
Alert the WMS to collect & empty the bins
YES