7
The Monitor reports on EU and Member States’ performance on the ET2020 benchmarks, and elaborates on policy prior-ities and initiatives for education systems. Volume 1 of the Monitor provides an analysis from cross-national and themat-ic points of view. Volume 2 comprises 28 individual country reports.
The report brings together the latest data, technical reports and studies, as well as policy documents, and examples of policy measures from diff erent EU Member States. By doing this, the report contributes to the implementation of the ET 2020 cooperation framework. It is also a tool for education-al stakeholders and institutions in Europe to compare their country to other EU Member States, and an occasion for peer learning.
This year’s Education and Training Monitor focuses on ine-quality in education and the important role that education can play in building fairer and fl ourishing societies. To this aim, Part 1 of Volume 1 off ers an insight into equity issues showing a link between educational attainments and social outcomes. In Part 2, progress in reaching EU 2020 education targets are analysed at EU level and in individual Member States. Finally, Part 3 presents policy initiatives at all educational levels that can help tackle inequalities in educational attainments and provide quality education for all.
Headline target
1
Early leavers from education and training
The share of 18 to 24 year-olds having attained ISCED level 0-2 and not receiving any formal or non-formal education or training in the four weeks preceding the survey.
10.7 %
Below
10 %
2
Tertiary educational attainment
The share of 30 to 34 year-olds having successfully completed ISCED level 5-8.
39.1 %
At least
40 %
Other targets
3
Early childhood education and care
The share of children aged 4 to the age of compulsory primary education who are participating in education.
94.8 %
95 %
4
Underachievement in reading, maths and science
The share of 15 year-olds failing to reach level 2 in the OECD’s PISA for reading, mathematics and science.
Reading: 19.7 % Maths: 22.2 % Science: 20.6 %
15 %
5
Employment rate of recent graduates
The share of employed 20 to 34 year-olds having successfully completed ISCED 3-8 one to three years preceding the survey and who are no longer in education or training.
78.2 %
82 %
6
Adult participation in learning
The share of 25 to 64 year-olds who received formal or non-formal education or training in the four weeks preceding the survey.
10.8 %
15 %
Freephone number (*):
00 800 6 7 8 9 10 11
(*) The information given is free, as are most calls (though some operators, phone boxes or hotels may charge you).
More information on the European Union is available on the Internet (http://europa.eu). Cataloguing data can be found at the end of this publication.
Luxembourg: Publications Office of the European Union, 2017
© European Union, 2017
Reuse is authorised provided the source is acknowledged. The reuse policy of European Commission documents is regulated by Decision 2011/833/EU (OJ L 330, 14.12.2011, p. 39).
For any use or reproduction of photos or other material that is not under the EU copyright, permission must be sought directly from the copyright holders.
This publication is based on document SWD(2017)410. The Education and Training Monitor 2017 was prepared by the Directorate-General for Education, Youth, Sport and Culture (DG EAC), with contributions from the Directorate-General of Employment, Social Affairs and Inclusion (DG EMPL) and the Eurydice Network. DG EAC was assisted by the Education and Youth Policy Analysis Unit from the Education, Audiovisual and Culture Executive Agency (EACEA), Eurostat, Cedefop and the JRC's Human Capital and Employment Unit, Directorate Innovation and Growth. The Members of the Standing Group on Indicators and Benchmarks (SGIB) were consulted during the drafting phase.
The manuscript was completed on 15 September 2017.
Foreword
2017 has been a year of celebration – we have marked the 60th anniversary of the Treaties of Rome and celebrated 30 years of one of the European Union's biggest success stories: the Erasmus programme. But 2017 has also been a year of reflection. The European Commission has presented different scenarios to launch a broad debate on the future of Europe.
Building the Europe of tomorrow will require big decisions on a number of challenges: how do we ensure that our economies remain competitive? How do we achieve sustainable long-term growth and create quality jobs, in particular for young people? How do we tackle global issues such as violent radicalisation? How do we build fair and cohesive societies, overcoming division and discord? An effective response to these challenges requires action in many interrelated domains of EU policies. Education has an unequivocal role in addressing all of them.
Indeed, quality education is the foundation for a Europe that is fairer, more inclusive, more resilient and more innovative than today. Across the continent, education systems play a pivotal part in reducing social and economic disparities. Education can help build fairer societies by providing high quality education for all children and young people, independent of their backgrounds, giving all of them equally good chances to lead successful lives.
Equipping young people with the right skills not only to find employment, but also to become engaged, independent citizens lays the foundation for sustainable growth and innovation, as well as for inclusive, prosperous societies.
Yet, while education is crucial in mitigating inequality, poor education policies can, in fact, deepen social and economic gaps. Recent international surveys – especially the PISA 2015 results – have shown an urgent need for improvement: the EU has moved further away from meeting the ET2020 benchmark for low achievers in reading, maths and science. Roughly one in five Europeans at the age of 15 does not reach the basic level of competence in one of these three important domains. Hence, more than ever, Europe must put education and training at the top of its political agenda.
For the Commission, this means stepping up support to policy makers and education providers in raising the quality and relevance of education systems in EU Member States. In March 2017, European leaders gathered in Rome to re-affirm their commitment to working towards 'a Union where young people receive the best education and training and can study and find jobs across the continent'.
Building on the 2016 New Skills Agenda for Europe, in May 2017, the Commission presented two important political communications on schools and higher education, outlining the critical role of European cooperation in education policies while respecting the subsidiarity principle. We are proposing concrete actions to support education reforms in Member States through identifying good practices and voluntary tools to be put at the disposal of Member States. The Commission is also providing relevant up-to-date evidence and putting it into a policy context, boosting peer learning and joint progress by supplying Member States with a reliable basis for policy options and effective educational reforms. This year's edition of the Education and Training Monitor – the sixth – is a central part of this effort. It presents a relevant, data-rich, policy-oriented comparative analysis of the state of education across the European Union's 28 Member States, which I trust will help drive reform and modernisation further.
Tibor Navracsics
EU targets for 2020 in education
Contents
Foreword ... 3
EU targets for 2020 in education ... 4
Contents ... 5
Table of figures ... 7
Summary ... 9
Highlights of the cross-country analysis ... 9
Inequality remains a challenge for Europe ... 9
Progress towards the 2020 targets ...12
Towards high-quality education for all ...13
Highlights of the country analysis ... 14
1 Equity, a challenge for education ... 21
1.1 Education and the inequality debate — an introduction ... 21
1.1.1 Socio-economic inequality ...21
1.1.2 Key areas of life affected by education inequalities ...26
1.1.3 Current policy context ...31
1.2 Understanding inequality patterns in basic skills ... 32
1.2.1 The EU benchmarks for low achievers in education ...32
1.2.2 Basic skills for life and work - the EU averages and country breakdowns - evolution over time – since 2009 ...33
1.2.3 Performance by gender ...34
1.2.4 Student performance differences by socio-economic status ...35
1.2.5 Student performance differences by migrant background ...37
1.2.6 The phenomenon of private tutoring ...41
1.3 Investing in education to promote equity ... 42
1.3.1 Does money matter in education? ...43
1.3.2 Categories of education spending ...49
1.3.3 Spending on education by level ...51
2 Progress on the EU benchmarks in education ... 53
2.1 Participation in early childhood education and care ... 53
2.2 Early leavers from education and training ... 55
2.2.1 ESL target - development over time ...57
2.2.2 ESL gaps within Member States ...58
2.3 Tertiary educational attainment ... 62
2.3.1 The 2020 benchmark on higher education within reach ...62
2.3.2 A widening gap in tertiary attainment across Member States ...63
2.4 Recent graduates on the labour market, vocation education and training (VET) and work-based learning ... 65
2.4.1 Graduate transition from education to work ...65
2.4.2 Initial VET (IVET) ...66
2.4.3 Work-based learning and apprenticeships ...70
2.5 Adult participation in learning ... 72
2.5.1 Skills, education and labour market outcomes ...72
2.5.2 Adult participation in learning – performance in the ET 2020 benchmark ...73
2.6 Learning mobility ... 74
2.6.1 The EU and world map of learning mobility ...75
2.6.2 What do mobile students study? ...77
3 Towards high quality education for all ... 82
3.1 Quality education needs to start early in life ... 82
3.1.1 Understanding and maximising the impact of early childhood education and care (ECEC)...82
3.1.2 Organisation of ECEC provision ...84
3.1.3 Recent reforms in access to ECEC ...84
3.2 School education ... 86
3.2.1 The challenge of modernising schools ...86
3.2.2 A snapshot of the teaching workforce in the EU ...89
3.2.3 Helping teachers to provide quality teaching ...92
3.2.4 Autonomy and quality assurance ...98
3.2.5 Multilingualism in school education ...99
3.3 Tertiary education ... 103
3.3.1 Employment outcomes of higher education ... 103
3.3.2 Distribution of students by subject areas ... 105
3.3.3 Policy action to address the needs of the labour market ... 107
3.3.4 Aspects of equity in higher education ... 108
Table of figures
Figure 1 — Gini coefficients of income inequality in selected European countries,
2005-2015 ... 23
Figure 2 — Gini coefficients of income inequality and mean PISA scores in science, 2015 ... 24
Figure 3 — Gini coefficients of income inequality and percentage of low achievers in PISA in science, 2015 ... 25
Figure 4 — At-risk-of-poverty rate and social exclusion in EU by educational attainment level, 2015 ... 26
Figure 5 — Percentage of people in EU-28 declaring unmet needs for medical examination by age and level of education, 2015 ... 27
Figure 6 — Life expectancy (in years) by educational attainment level in selected EU countries, 2015 ... 27
Figure 7 — Distribution of EU graduates in tertiary education by field and sex, 2015 ... 28
Figure 8 — Educational attainment among different groups of population (aged 30-34) in EU countries by place of birth, 2016 ... 29
Figure 9 — Share of low achieving students in science, 2015 ... 32
Figure 10 — Progress towards the benchmark of low achievers in reading, 2009-2015 ... 33
Figure 11 — Share of low achieving boys and girls in reading, 2015 ... 34
Figure 12 — Development of the gender gap for low achievement in reading, 2012-2015 (pp) ... 35
Figure 13 — Low achievement in science by socio-economic status (ESCS), 2015 ... 36
Figure 14 — Percentage of 15-year-old students with a migrant background, 2015 ... 37
Figure 15 — Share of low achievers in science by migrant background, 2015 ... 38
Figure 16 — Difference in mean PISA scores in science between first- and second-generation migrant and non-migrant students, 2015 ... 39
Figure 17 — Participation in shadow education by type of provider, 2012 ... 41
Figure 18 — Cumulative expenditure per pupil (EUR PPS, right-hand scale); Percentage of low and high achievers in PISA 2015 science (left-hand scale) ... 44
Figure 19 — Cumulative Expenditure per pupil (EUR PPS right-hand scale) Variance of science score explained by socio-economic background (left-hand scale) ... 45
Figure 20 — Contribution by education level to the real annual growth of public expenditure, 2015 ... 46
Figure 21 — Public expenditure on education, 2015 (%) ... 47
Figure 22 — Key trends in GDP, education and total expenditure, 2002-2015 ... 48
Figure 23 — Public expenditure by government function, EU, 2002-2015 ... 49
Figure 24 — Categories of public education spending, 2015 ... 50
Figure 25 — Public expenditure by education level, 2015 ... 51
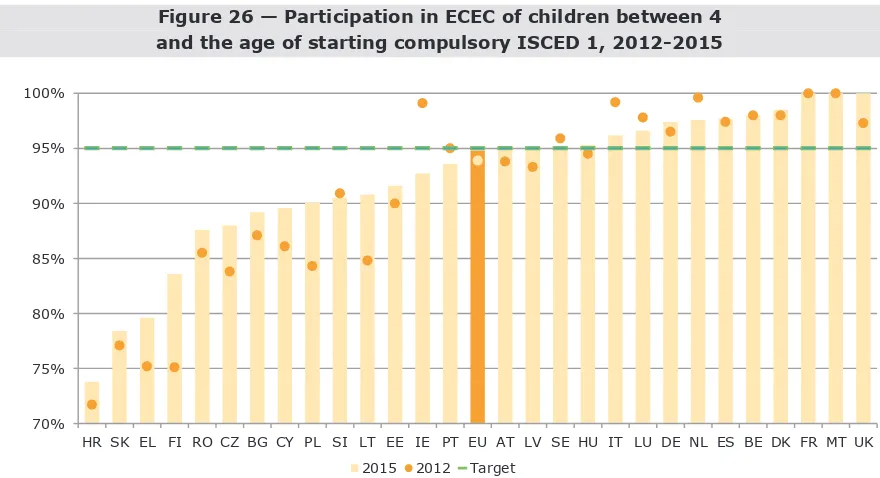
Figure 26 — Participation in ECEC of children between 4 and the age of starting compulsory ISCED 1, 2012-2015 ... 54
Figure 27 — Participation in formal childcare of children below 3 years of age, 2012-2015 ... 55
Figure 28 — Employment of the early leavers from education and training, 2016 ... 56
Figure 29 — Early leavers from education and training, 2010-2016 ... 57
Figure 30 — Early leavers from education and training by sex and migrant status, 2016 (%) .. 58
Figure 31 — Early leavers from education and training (18-24) by NUTS 2 regions, 2016 (%) ... 60
Figure 32 — Urban – rural divide in early leavers from education and training, 2016 ... 61
Figure 33 — Tertiary educational attainment 2010, 2013, 2016 and EU target level ... 62
Figure 34 — Tertiary educational attainment, age group 30-34 by level of qualification, 2016 ... 63
Figure 35 — Tertiary education attainment by sex and migrant status age group 30-34, 2016 (%) ... 64
Figure 36 — Employment rate of recent graduates by ISCED level, 2016 ... 66
Figure 37 — The share of students in upper-secondary VET, 2015 and the share of people aged 20-34 with a VET qualification, 2016 ... 67
Figure 38 — Distribution of young people with VET qualification at upper-secondary and post-secondary non-tertiary level by field of study, 2015 ... 68
Figure 40 —Wage premium by educational attainment over work income of 20-34 olds with
a medium VET, 2015 ... 69
Figure 41 — Share of upper secondary VET students enrolled in combined work- and school-based programmes, 2015 ... 70
Figure 42 — Wage premium of apprenticeship graduates ... 71
Figure 43 — Adult (25-64) employment rates by education level, 2016 ... 72
Figure 44 — Participation in adult learning (ET 2020 benchmark) by different types of learning, 2016 ... 73
Figure 45 — Adult learning participation rates by the size of employer, 2016 ... 74
Figure 46 — Degree mobility of students within the EU, to the US and the World, 2015 ... 76
Figure 47 — Percentage of graduates and mobile graduates by field of education in the EU in 2015 ... 77
Figure 48 — Selected Mobility Scoreboard indicators ... 78
Figure 49 — % of PISA 2015 test participants with migrant background speaking at home a language different from the language of instruction ... 87
Figure 50 — Male teachers in primary education, 2000-2015 ... 90
Figure 51 — Share of women among teachers aged less than 30 at different education levels, 2015 ... 90
Figure 52 — Age groups of teachers (ISCED 1-3), 2015 ... 91
Figure 53 — Teachers working part-time in primary and upper secondary education, 2015 ... 92
Figure 54 — Graduates in education by level of education, 2015 ... 93
Figure 55 — Changes between 2010 and 2016 in teachers' minimum statutory salaries in constant prices in public primary schools, 2010 to 2016, 100=2010 ... 95
Figure 56 — Actual salaries of all teachers, relative to earnings for full-time, full-year workers with tertiary education, 2015 ... 96
Figure 57 — Percentage of pupils in lower secondary schools being taught at least two foreign languages, 2013 - 2015 ... 101
Figure 58 — Number of foreign languages known, age 25-34. EU average ... 101
Figure 59 — Instruction time per subject as a percentage of total compulsory instruction time in general lower secondary education, 2016... 102
Figure 60 — 2008-2016 employment rates of recent tertiary education graduates ... 104
Figure 61 — Employment status of the 30-34 year-old tertiary education holders, percentage, 2016 ... 104
Figure 62 — Share of EU tertiary graduates by field of education and tertiary educational level, 2015 ... 105
Figure 63 — Qualification-occupation mismatch, 2016 ... 106
Figure 64 — Correlation between: ... 109
Figure 65 — Ratio of the percentage of students having parents with tertiary education to the percentage of population 25-64 with tertiary education, 2013 ... 110
Figure 66 — A typology of admission systems for higher education in EU Member States ... 111
Figure 67 — Percentage of female STEM students in tertiary education, 2015 ... 112
Figure 68 — Share of women among total academic staff and professors, 2014 ... 114
Figure 69 — I: Existence of top-level authority regulations on equal opportunities affecting recruitment procedures, 2015/16 II: Existence of wide policy measures or initiatives aiming at preventing or limiting gender differences in academic ranks, 2015/16 ... 115
Figure 70 — Percentage of underachievement in science, maths and reading by sex, 2012-2015 ... 117
Figure 71 — Employment rates of recent graduates by level of education ... 118
Figure 72 — Early leavers from education and training (ESL) a selection of structural indicators, 2016/2017 ... 119
Figure 73 — Early leavers from education and training (ESL) ... 120
Figure 74 — Summary table on higher education ... 121
Summary
Highlights of the cross-country analysis
The lead theme of this year’s Monitor is inequality in education and the important role that education plays in building a fairer society. The prime new data source is the 2015 PISA1 test of 15-year-old pupils with all EU Member States taking part for the first time. PISA, with its rich information about the background of the tested pupils, offers unique insights into the effect that socio-economic background, a migrant background and gender have on attaining the EU benchmark on low achievement in reading, maths and science.
The equity and social cohesion theme also features strongly in the reporting on the remaining EU 2020 education targets (Part 2), the targets relate to:
- early leavers from education and training - tertiary educational attainment
- participation in early childhood education and care - employment rates of recent graduates
- adult participation in learning.
Part 3 of the Monitor draws on the recent Commission policy initiatives and offers an analytical underpinning for the development of schools, on how to achieve excellence in teaching and on the agenda for higher education.
Inequality remains a challenge for Europe
Inequality is widely regarded as a threat to social cohesion and the long-term prosperity of our societies. The public debate on social justice has intensified in the wake of the financial crisis of 2008.
One key feature of inequality is its intergenerational transmission, or the impact of parents' socio-economic position on their children's educational attainment, occupational status, income or health. Education systems have a special role to play in building a fairer society by offering equal chances to everybody, regardless of their background. Offering equal chances to children and youth is more effective when is integrated with the real support for parents and families. There is a strong association between educational attainment and social outcomes. People with only basic education are almost three times more likely to live in poverty or social exclusion than those with tertiary education. In 2016, only 44.0 % of young people (18-24) who had finished school below the upper secondary level were employed. And in the general population (15-64), unemployment is much more prevalent among those with only basic education (16.6 %) than for the tertiary educated (5.1 %). Furthermore, a higher share of people with tertiary education (80.4 %, according to the 2015 data) perceived their health as ‘good or very good’, while the rate was much lower among those with only basic education (53.8 %)2. Life expectancy grows in line with the level of education too: the education premium can span up to 10 years between the low-qualified and highly qualified (2015 data).
1 PISA is the OECD Programme for International Student Assessment.
2 It has to be said however that age effect also plays a role in this disparity as people with lower
Visual 1 — Rates of 'at-risk-of-poverty or social exclusion' of people aged 18 and over by level educational attainment level, EU-28, 2015
Legend: (i) top, persons with ISCED 0-2 (max. lower secondary education); (ii) middle, persons with ISCED 3-4 (upper-secondary and post-(upper-secondary non-tertiary education); (iii) bottom, persons with ISCED 5-8 (tertiary education).
There is ample evidence, particularly from the PISA tests held every 3 years, that children from less privileged social backgrounds perform less well at school than their better-off peers. The difference in the shares of low achievers in PISA between pupils from the bottom and top 25 % segment of the PISA index of socio-economic and cultural status (ESCS) is striking. As many as 33.8 % pupils from the bottom 25 % segment do not reach the basic level of competence in science, while only 7.6 % of those among the top 25 % on the ESCS index do not reach that level. These EU aggregates, however, mask significant differences among and within the Member States. They are analysed in further detail in the Monitor.
Visual 2 — Underachievers in science in the bottom and top quartiles of the PISA index of economic, social and cultural status (ESCS), 2015
While education plays a key role in the integration of migrants, their situation in terms of educational achievement compared to native-born remains disadvantageous. In 2016, 33.9 % of the non-EU-born population aged 30 to 34 held low qualifications (i.e. they had lower secondary education or below), 19.1 percentage points (pp) more than the native-born population. Moreover, people with a migrant background from outside the EU often cumulate several disadvantages at once, e.g. having poor or low-skilled parents, not speaking the local language at home, having access to fewer cultural resources and suffering from isolation and poor social networks in the host country. Young people with a migrant background are also at a greater risk of performing badly at school and of dropping out of school early.
More generally, pupils with migrant background, i.e. either born outside the country (i.e. in another EU Member State or outside the EU) or with foreign-born parents, face difficulties in their schooling, as evidenced by their significantly lower educational performance and attainment compared to the native-born population.
Visual 3 — Underachievers in science by migrant background3, 2015
Legend: From left to right, non-migrants, first-generation of migrants and second-generation of migrant students.
Reading note: The percentages show weighted averages of selected EU Member States where the second generation of migrants is above 3 % of students taking part in PISA 2015.
Good education systems require appropriate investment. Treated as a whole, the EU Member States have managed to recover further from the recent financial crisis and have slightly increased spending on education as share of total government spending. The EU average share of education within public spending stood at 10.3 % in 2015, equivalent to EUR 716 billion. Education remains the fourth largest government expenditure item after social protection, health and general public services. The ratio of education spending to GDP stood at 4.9 % in the EU-28 countries in 2015. In recent years this ratio has been stagnant.
3 For the definition of [im]migrant students in PISA, please see Box I.7.1, Chapter 7, Volume I, p. 243,
Visual 4 — Average EU-28 government spending on education, general public services, health and social protection
as a percentage of total government spending, 2016
Legend: From left to right, education, general public services, health and social protection.
Progress towards the 2020 targets
In 2016, the EU has continued the good progress of previous years on early leavers from education and training. With a current share of 10.7 %, the EU is inching towards the Europe 2020 headline target of below 10 %. However the percentage among foreign-born remains much higher (19.7 %).
The EU also made slight progress on the headline target for tertiary educational attainment. Having reached 39.1 %, the 2020 target of 40 % is now within reach.
The target for early education and care participation by the age group above 4 years of age has been practically met, with the EU reaching 94.8 %. Ensuring the high quality and accessibility of day care facilities, as well as on broadening participation among children below the age of 3 to meet the objective of 33 % would be a logical follow-up.
On the other hand, the target on low achievers in reading, maths and science, as measured by the PISA 2015 survey, suffered a setback compared with the 2012 survey, which makes the debate on how schools and teaching need to be improved even more timely. The percentage of 15-year-old pupils who failed to reach a basic level of competence in science stood at 20.6 %, up from 16.6 % in 2012.
Visual 5 – Mismatch between the educational attainment and the occupation, 2016
Legend: the shares of people (aged 25-44) with a tertiary (top), a bachelor (middle) and a master diploma (bottom) that have an occupation traditionally requiring a lower level of educational attainment.
As for adult participation in learning, there has been practically no progress since the 2015. At 10.8 %, the EU still seems far from the modest target of 15 % of adults participating in formal or non-formal education and training.
Part 2 of Volume 1 of the Monitor contains detailed socio-demographic breakdowns, the evolution over time of progress towards the above benchmarks and a review of the differences between the Member States.
Towards high-quality education for all
The decrease in recent PISA results in basic competences, coupled with fast technological progress and globalisation, have set the context for the debate on how to modernise pre-school day care facilities, schools and universities. These reforms will be analysed further in this Monitor, on three levels:
1. Schools, teachers and governance: How can schools be made more responsive to the changing nature of basic skills required in the modern world, e.g. the growing importance of ICT technologies and multilingualism?
2. How can Europe help its ageing, mostly female and often economically fragile teaching force to turn modern technologies into an asset, to learn how to operate in a multicultural environment and help prevent radicalisation of disenfranchised young people?
3. Making school more participatory by getting parents, the local community and other stakeholders more closely involved, is believed to be an indispensable part of the modernisation of high-quality education for all.
Visual 6 — Percentage of women among graduates in engineering and humanities, 2015
Legend: (i) left bar, engineering, manufacturing and construction; (ii) right bar, arts and humanities.
Highlights of the country analysis
Volume 2 of the Education and Training Monitor 2017 comprises twenty-eight individual country reports, and can be found online (ec.europa.eu/education/monitor). The country reports follow a structure similar to that of Volume 1, but complement the cross-national analysis with country-specific data and information on policy measures and the latest reforms.
AT Austria is implementing the reform agenda agreed in 2015: the package on school autonomy, administration and comprehensive schools was adopted in July 2017. While the early school leaving rate fell further in 2016 to well below the European target, performance in basic skills has not improved in international testing. The new strategy on the social dimension of higher education is an important element within the new framework for public funding of universities. Austria will have to replace about half of its teaching force during the next decade. This will require it to attract and train sufficient student teachers, but also provides an opportunity to innovate in pedagogy. Austria has a uniquely strong short-cycle, professionally oriented tertiary education including in science, technology, engineering and mathematics. However, it needs more PhD graduates to further sustain its goal of becoming an innovation leader.
BE Major school reforms are at an early stage: sustained political commitment will be needed. Belgium has reached its national early school leaving target. Actions to further lower the numbers leaving school with low or no qualifications are being pursued. The equity challenge is significant, with PISA showing above average performance gaps linked to socioeconomic status and migrant background. The challenge could increase as growth in the school population will be concentrated among disadvantaged groups. New school governance and quality assurance measures should help to better combine autonomy and accountability and reduce inequalities between schools. Teachers’ continuous professional development needs improvement. Tertiary attainment is high, but the system is under pressure with rising student numbers. Initiatives seek to address low graduate numbers in science and technology and gender imbalances.
combination of educational factors and equity challenges. Authorities have started implementing a new approach to tackle early school leaving. Integrating Roma into the education system remains a challenge, as does Roma school segregation in education. Bulgaria seeks to significantly raise salaries to increase the attractiveness of the teaching profession and counter the fast ageing of teachers. Performance-based funding of higher education seeks to address the challenges of quality and labour market relevance. Bulgaria is making efforts to improve the quality of vocational education and training.
CY The share of low achievers in basic skills among 15-year-olds is comparatively high. Cyprus ranks last in the EU in science and mathematics. The gender gap in reading is the highest in the EU. Tertiary attainment is one of the highest in the EU, but tertiary graduates' employment levels are below average, while the share who works in non-graduate level jobs is the highest in the EU. Despite much improved employment levels among VET graduates, measures to improve the attractiveness of vocational education and training have yet to bear fruit or to turn around very low participation levels. The modernisation of school education has advanced in the areas of teachers’ continuing professional development and appointment, but lags behind for school and teacher evaluation. Early school leaving and low performance of at-risk students are tackled through dedicated support measures in schools.
CZ The employment rate of recent graduates is very high. Inequalities in educational outcomes linked to socioeconomic background are strong and hit the Roma population in particular. The proportion of low achievers in basic skills increased markedly, in particular in science. Teachers’ salaries remain relatively low and the teaching workforce is ageing, calling for measures to increase the attractiveness of the profession to talented young people. Tertiary educational attainment has confirmed its rapid increase and implementation of the long-awaited reform of higher education has started.
DE The performance of 15-year-olds in science, mathematics and reading is stable overall but remains much lower for students with a migrant background. The influence of socioeconomic factors on educational outcomes has decreased but is still important. Public spending on education remains below the EU average. Financial planning will be confronted with specific challenges including demographic change, school infrastructure, teacher appointments, integration of refugees and inclusion of special-needs students. Participation in early childhood education is almost universal for 4- to 6-year-olds. Improving the supply and quality of early childhood education and care is a priority. Substantial efforts have been made to integrate refugees at all levels of education. However, difficulties in allocating them to appropriate schools in some regions exist. Enrolment and attainment levels in tertiary education are on the rise. Vocational education and training appears less attractive to young Germans, despite the fact that employment prospects for VET graduates remain very good.
DK Danish education combines high achievement with good levels of equity and a focus on student well-being. The rate of high-performing students is, however, lower than in other Nordic countries. The Vocational Education and Training reform of 2015 simplified studies and the reform has had some initial positive impact, for instance on transition to higher education. However, reducing dropout rates and attracting entrants from primary school remain major challenges. The 2014 compulsory school (Folkeskole) reform is being implemented. A reform of upper secondary education will start in 2017/2018. Public education budgets have been reduced, but Denmark remains the biggest investor in education in the EU. Tertiary student numbers have doubled since 2008. This has led to a focus on how to better manage student flows and speed up graduation. The transition from study to work is comparatively slow.
Tertiary educational attainment is high and growing, but gender gaps persist. The funding model for universities was revised targeting the stability of resources and completion of studies in nominal time. Labour market and skills surveys aim to anticipate future trends and feed changes into the education and training system, thus supporting adjustments in the economy.
EL The share of low achievers in science, mathematics and reading as measured by PISA 2015 is above EU average and particularly high among students with a migrant background. Gender and socioeconomic status strongly affect student performance. The tertiary attainment rate is high, but the employment rate of recent graduates remains low and macro-economic skills mismatches persist, leading to a significant outflow of highly skilled people. New policy measures aim at strengthening the quality of school education, but efforts to achieve greater autonomy and efficiency appear insufficient. Greece is making important efforts to provide education to refugee children, but numerous challenges remain with regard to their integration into mainstream education. The reform of vocational education and training is progressing, but there is scope to further increase its attractiveness and boost participation.
ES The Spanish Parliament is consulting stakeholders before drafting a proposal for a Social and Political National Pact on Education that would set the terms for a long-lasting education reform. This has put on hold several parts of the Law to improve the quality of education and other pending reforms. Students’ abilities as measured by PISA 2015 are stable at around the EU average and early school leaving continues to decrease. However, significant gaps between regions show that progress is uneven across the country. The increase in recruitment of teachers should help address the high levels of interim staff in schools, while reforming the teaching profession is one of the main features of the future pact. The Ministry of Education, Culture and Sport is making significant efforts to prevent violence and bullying in schools. Enrolment in higher education continues to fall and the education offer is very broad and not fully relevant to the job market. University-business cooperation has improved in the field of research and innovation but has yet to address education.
FI Reforms to the education system such as the curriculum for the 21st century, the new comprehensive school and the teacher development programme aim to maintain the quality of the education system, while acknowledging the increasing need to address inequalities. In 2016 early school leaving was significantly reduced for the first time in years, with a moderate gender difference. But young people with a migrant background do significantly worse. Finland’s performance in basic skills in PISA 2015 continued to slip, but it remains one of the best performing European countries. The education system continues to face public budget cuts. More migration and increasingly divergent educational outcomes in different regions have reduced the homogeneity of educational outcomes.
FR Recent education reforms focus on reducing inequalities. New curricula and pedagogical practices have entered into force and 54 000 new teaching posts were created in early stage and 'priority' education. The number of pupils leaving education annually with no qualification has fallen by 30 % between 2009 and 2016. Pupils’ performance in basic skills remains strongly linked to their socioeconomic background. Initial teacher education has been reformed, helping to make the profession more attractive, but continuing professional development has not been substantially improved. The tertiary educational attainment rate is high. Vocational education and training has seen important evolutions aiming at improving integration into the labour market for initial VET and improve access to relevant training for continuous VET.
relevance of skills acquired in vocational and higher education. A number of reforms have been prepared in the context of the Strategy for Education, Science and Technology and the associated curricular reform. However, progress in 2017 has been limited.
HU A revision of Hungary's national curriculum was launched in 2017 in response to declining performance in PISA 2015. Recent measures on early childhood education and care may contribute to closing performance gaps between pupils from disadvantaged and more privileged backgrounds. A 2017 increase in applications to initial teacher training suggests that recent measures are helping to attract new candidates to the profession. New graduate tracking surveys offer a good insight into the employment situation of recent graduates. Hungary faces skills shortages; responding to these is hampered by low enrolment and completion rates in tertiary education.
IE Irish students’ basic skills in reading, mathematics and science are high and relatively unaffected by socioeconomic background. Ireland continues to compare very well on education targets for early school leaving and tertiary education attainment. However, inequalities in participation and access are still to be addressed. A phased implementation of reforms at lower secondary level is set to be completed in 2019. These reforms will also inform reviews of upper secondary education. The major reforms of the further education and training and higher education sectors are progressing. Access to higher education remains closely linked to socioeconomic status and there is a need for alternative, more vocationally oriented pathways. Future funding of tertiary education is also a key issue.
IT The 2015 school reform has entered into force and could improve learning outcomes as well as increase equity. Although still above the EU average, the early school leaving rate is on a steadily downward trend; participation in early childhood education is almost universal for four- to six-year-olds. Italy's tertiary educational attainment rate for 30- to 34- year-olds is one of the lowest in the EU. The higher education system faces the challenge of ageing and declining teaching staff. The negative trend in higher education funding is being reversed, with additional resources allocated on a selective basis. Transition from education to work is difficult, also for high-qualified people. This is causing an outflow of highly skilled people.
LT Depopulation due to demographic trends and emigration is a big challenge for the efficiency of spending in education. In this context, low participation of adults in lifelong learning is a concern. Key challenges in early childhood education and care are to expand participation and to establish a system of external quality assurance. Large disparities between schools in urban centres and rural regions affect funding levels, quality of infrastructure, quality of teaching and, ultimately, educational outcomes. The set-up of the working conditions for teachers is having a negative effect both on the quality of teaching and the supply of young teachers to the profession. The higher education sector is quantitatively strong, but there is evidence of quality and efficiency challenges. These are expected to be addressed by major reforms.
LU The PISA performance of 15-year-olds in the 2015 survey was significantly below the EU average in all three components: mathematics, reading and science. Calculated according to national surveys, the early school leaving rate is high and has been on the rise since 2009. An ambitious reform to improve access and quality in early childhood education and care started in September 2016. A number of actions were taken to improve the quality of teaching and support for children with special learning needs. To meet the strong demand for high-skilled workers, Luxembourg has made further adjustments to the 2014 reform of financial aid to students as of September 2016.
work-based learning and updating the curriculum. The gender gap in education is a challenge across the board, with women outperforming men significantly both in qualifications and basic skill proficiency.
MT Malta is investing heavily in its education and training system. Despite steady progress, the early school leaving rate is still high and tertiary educational attainment remains low. The reform of secondary education has been launched and could help reduce early school leaving. Transition from education to the labour market is easier than in most other EU countries. Adult participation in learning is relatively low, particularly among the low-skilled.
NL The downward trend in early school leaving continued in 2016. Despite good overall school performance, there has been a decline in basic skills and an increase in educational inequality. The school performance and employment situation of young people from an immigrant background remains an important challenge. The Netherlands faces an increasing shortage of teachers. Following the transition from the grant-based system to student loans, enrolments dropped in higher education in 2015 but recovered in 2016.
PL Overall educational performance is strong. Poland is one of the best EU performers on early school leavers, tertiary attainment and the general level of basic skills of young people is high relative to other EU countries. Participation in early childhood education and care has increased significantly, but challenges related to the youngest children remain. The primary and lower-secondary school system is to be overhauled from September 2017, in conjunction with a later extension of upper-secondary education. These changes are raising concerns among a number of stakeholders. The government has launched a new higher education reform to improve quality, performance and internationalisation. The labour market relevance of vocational education is still limited, despite recent initiatives. The reform of vocational training starts in September 2017. Scattered adult education policy results in low interest and low participation in education and training compared to the EU average.
PT Portugal is making progress in improving educational outcomes, reducing early school leaving and ensuring full public provision of pre-school education for all children aged 3 to 5 years by 2019. Implementation of the ‘National Plan to Promote Success at School’ — the flagship initiative to prevent school failure — is under way. The number of participating schools has exceeded expectations. Tertiary attainment is improving, but meeting the ambitious national Europe 2020 target will be a challenge. Several measures are under way to help streamline the higher education offer. Promotion of adult education plays a central role in the current education policy, with the aim of addressing the adult population’s low level of basic skills.
RO Romania is implementing a competence-based curriculum in school education. Plans are underway to train teachers to teach the modernised curriculum. Underachievement in basic skills remains one of the highest in the EU. This is due to educational factors and equity challenges. Access to quality mainstream education is particularly a challenge for students in rural areas and for Roma. Funding for education is low. Early school leaving risks remaining high, with consequences for the labour market and for economic growth. The labour market relevance of higher education is improving, but tertiary educational attainment is the lowest in the EU. Efforts to introduce dual vocational education and training are underway. Adult participation in learning remains very low despite the need for upskilling.
SI With a low rate of early school leaving and a high share of tertiary attainment, Slovenia has a highly educated population and has already met its national targets under the Europe 2020 strategy. High attendance in early childhood education and care provides a strong basis for later success in basic skills. The higher education sector is undergoing reforms which aim to link funding with performance, increase completion rates, encourage internationalisation and strengthen quality assurance. Vocational education is attended by a large number of young people. However, apprenticeships are being reintroduced to engage employers further and help young people make the transition to working life.
SK Slovakia is aiming to develop more strategic central steering of education policies. PISA 2015 results showed a decline in basic skills and a high level of inequality, with low achievement strongly linked to socioeconomic background. There are large regional disparities, particularly affecting the Roma community. Teachers are insufficiently paid and their status is low, limiting the attractiveness of the profession. Their continuing professional development is not sufficiently targeted to development needs. Initial teacher education is not clearly focused on preparing for practical teaching. Education continues to be relatively underfunded at all levels. Slovakia's tertiary attainment rate has made substantial progress. Quality assurance of higher education does not yet meet international standards, the sector is insufficiently internationalised and lacks a professionally oriented short-cycle study offer.
Part 1
1
Equity, a challenge for education
1.1
Education and the inequality debate — an
introduction
Key findings
High levels of inequality can be corrosive for social cohesion and economic sustainability. Ensuring equity remains a key challenge for Europe as students from disadvantaged backgrounds fare worse in educational attainment and learning outcomes than their better-off peers.
Education can play a crucial role in equalising opportunities. Offering the same quality education to children from poor socio-economic and migrant backgrounds means that they will enjoy greater chances for successful living. Conversely, unequal education systems aggravate inequality.
A key feature of inequality is its intergenerational transmission, or the impact of parents' socio-economic position on their children's educational attainment, occupational status, income or health4.
The following analysis makes extensive use of PISA data. PISA: the Programme for International Student Assessment is a key international educational competence assessment among 15-year-olds that has prompted intensive educational discussions and reforms since its first round in 2000. The 2015 edition was carried out in 72 countries and economies worldwide and — for the first time — in all Member States.
1.1.1
Socio-economic inequality
Inequality has featured prominently in the public debate of the last decade in advanced economies. Recent debates were fuelled by the post-crisis disillusionment with the previous promises about ‘trickle-down economics’ and the ‘rising tide lifting all boats’ as well as by ample reports of a widening gap between the rich and poor, as indicated by the European Commission, EU-financed research, the OECD, the International Monetary Fund and the World Bank5.
4 European Commission (2017). Employment and Social Developments in Europe 2017, Box 3.1. page
102-103.
5 See:
- European Commission (2011). Employment and Social Developments in Europe 2011, chapter 2,
pp. 65-95.
- European Commission (2013). Employment and Social Developments in Europe 2013, chapter 7,
pp. 377-418.
- GINI – Growing Inequalities' Impacts — a EU funded FP7 research project.
- OECD (2011). Divided We Stand: Why Inequality Keeps Rising.
- Ostry, J. D., Berg, A. and Tsangarides, C. G. (2014). Redistribution, Inequality, and Growth. An
IMF Staff Discussion Note.
- Milanovic, B. (2011). The Haves and The Have-Nots: A Brief and Idiosyncratic History of Global
Inequality.
Researchers such as R. Wilkinson, K. Pickett, G. Standing, J. Stiglitz or T. Piketty have become emblematic campaigners against inequality. Their widely discussed books and associated advocacy platforms have become influential in steering the public debate6.
It has been argued that increasing inequalities may have adverse social, political and economic consequences. Wilkinson and Pickett argue that more unequal societies display worse social outcomes: poorer health, lower education levels, higher violence, higher incidence of teenage pregnancies, lower child well-being. Hence, inequality harms society as a whole.
Standing argues that current trends in inequality are politically untenable as they create a large, frustrated and humiliated underclass of poor people who are potentially vulnerable to radicalisation, lacking career prospects, and who oscillate between short-term, precarious, low-paid and menial jobs.
Stiglitz argues that inequality is disruptive to the economy by destroying the foundation of the market economy, i.e. consumers’ purchasing power, hence undermining aggregate demand. Finally, Piketty sought to demonstrate that the growing inequalities can threaten the democratic order and must be moderated by state intervention.
The academic research on income and wealth distribution by several other economists and sociologists such as T. Atkinson, E. Saez and their projects like the World Wealth and Income
Database7 have offered critics of inequality a solid data underpinning. The research has also put
numbers on the inequality increases experienced in the most of the developed economies during the last three and a half decades.
Income inequalities in Member States have been widely analysed. The primary source of European statistics on income inequality is the EU SILC8 data collection. The three measures derived from EU SILC designed to capture income inequality are:
- the Gini coefficient of equivalised disposable income (Gini), monitored for example
through the Joint Employment Report 2017;
- the income quintile ratio (S80/S20), monitored for example through the Social Scoreboard9;
- the at-risk-of-poverty or social exclusion rate (AROPE) which is a combined relative and
absolute poverty measure developed in the context of the EU 2020 headline target of lifting 20 million people out of poverty and social exclusion by 202010.
Rising income inequalities have been a common trend across developed economies. Income inequalities in EU Member States in 2015 have stabilised at a historically high level, after increases between 2010 and 2014. Recently (2014-2015), inequalities as measured by S80/S20 increased most in the countries where they were already high. High inequality levels can reduce the output of the economy and the potential for sustainable growth. Large and persistent inequalities do not only raise concerns in terms of fairness, as they usually reflect a high risk of poverty and social exclusion, but also in economic terms, as they lead to an under-utilisation of human capital. Inter-generational transmission of poverty compounds these negative impacts11.
6 e.g.
- Wilkinson, R. G. and Pickett, K. (2009). The Spirit Level: Why More Equal Societies Almost Always
Do Better and the associated Equality Trust.
- Standing, G. (2011). The Precariat: The New Dangerous Class and the related Basic Income Earth
Network.
- Stiglitz, J. (2012). The Price of Inequality: How Today’s Divided Society Endangers Our Future.
- Piketty, T. (2013). Capital in the Twenty-First Century.
7 WID.WORLD is an online data base that has evolved from 15 years of income and wealth studies by T.
Piketty, E. Saez A. B. Atkinson and F. Alvaredo, following on from pioneering work by S. Kuznets and A. Harrison.
8 European Union Statistics on Income and Living Conditions, see Eurostat — Statistics Explained .
9 The Social Scoreboard of the European Pillar of Social Rights.
10 Europe 2020 strategy target on the risk of poverty and social exclusion.
11 European Commission (2017). The Joint Employment Report, as adopted by the EPSCO Council on 3
In 2014 the European Commission completed a comprehensive research project called Gini —
Growing Inequalities' Impacts12. The project brought together distinguished experts in the field
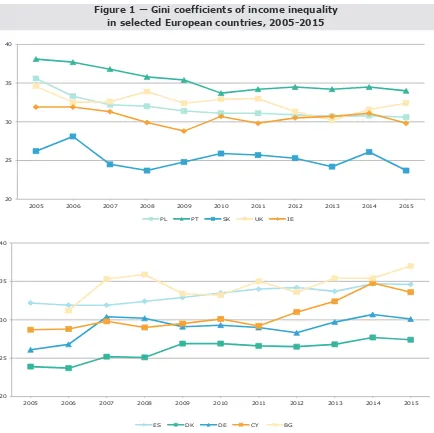
[image:27.624.82.516.178.611.2]to come up with detailed patterns of the evolution of income inequalities. The picture emerging from this research is nuanced and escapes any easy straightforward answers. Inequalities as measured by the Gini coefficient13 have remained by and large within a fairly narrow band. In the decade before 2015 Gini clearly dropped, i.e. inequality decreased, in Poland, Portugal, the UK, Ireland and Slovakia, but rose in Spain, Bulgaria, Denmark, Germany and Cyprus.
Figure 1 — Gini coefficients of income inequality in selected European countries, 2005-2015
Source: Eurostat, EU SILC. Online data code: [ilc_di12]. Figure 1 show only those European countries whose Gini coefficients (of equivalised income after social transfers) decreased or increased over 2 points between 2005-2015. Decreasing inequality (negative variation) are shown above: PL 5.0 points); PT 4.1 points); SK 2.5 points); UK (-2.2 points); IE (-2.1 points). Increasing inequality (positive variations): ES (+2.4 points); DK (+3.5 points); DE (+4.0 points); CY (+4.9 points); BG (+5.8 points). Reading note: data are not available for BG in 2005.
The marked decrease of inequalities in Poland and a slight decrease in Slovakia are manifestation of the long-term success of the transition to a market economy, sustained economic growth and the emergence of the middle class.
12 The GINI Project, 2014.
13 The Gini coefficient varies between 0 (equal income distribution) and 1 (total concentration) and
assumes values globally from 0.243 in Slovakia to 0.63 in South Africa. Depending on convention, Gini can also be given as 0 to 100 instead of 0 to 1.
20 25 30 35 40
2005 2006 2007 2008 2009 2010 2011 2012 2013 2014 2015 PL PT SK UK IE
20 25 30 35 40
With regard to income distribution, a tempting question to ask is whether more equal societies indeed score better in education performance or conversely, whether the countries scoring better in education are more equal14. Such a question escapes simple answers. Figure 2 and Figure 3 represent one possible attempt to map such a relationship by plotting the Gini coefficients against the mean 2015 PISA scores and the percentage of low achievers in science, respectively. However disappointing for the hypothesis, the image shows no straightforward relationship between equality in income distribution and the education performance of 15-year-olds, as numerous outliers can be seen and counter-examples can be cited to undermine the pattern. For example, in science, similarly high PISA results (Figure 2) were observed in low-inequality Finland and high-low-inequality Estonia. Similarly, medium-low results were observed in both Slovakia and Latvia, countries occupying two polar opposites in the Gini-inequality spectrum.
Figure 2 — Gini coefficients of income inequality and mean PISA scores in science, 2015
Source: OECD 2016: PISA 2015 results; EAC computations based on Eurostat data, the Gini coefficient from 2015 based on EU SILC 2015 data.
14 See also: European Commission (2017). Employment and Social Developments in Europe 2017,
chapter 3, and:
Coady, C and Dizioli, A. (2017). Income inequality and Education Revisited: Persistence, Endogeneity, and Heterogeneity, and IMF Working Paper, 26 May 2017.
AT BE
BG
CY CZ
DE
DK
EE
EL ES FI
FR
HR HU
IE
IT
LT LU
LV
MT NL
PL PT
RO SE
SI
SK
UK
y = -2.29x + 557.26 R² = 0.1446
420 440 460 480 500 520 540
Figure 3 - Gini coefficients of income inequality and percentage of low achievers in PISA in science, 2015
Source: OECD 2016: PISA 2015 results; EAC computations based on Eurostat data, the Gini coefficient from 2015 based on EU SILC 2015 data.
Moreover, comparing the Gini coefficient of income inequality with a country’s PISA performance can be regarded as problematic as the two measures relate to different groups of people: Gini characterises income across whole distribution and all age groups, whereas PISA only characterises the population of 15-year-old pupils. Further, comparing an average (PISA scores) and the Gini (a measure of dispersion) can in itself be problematic.
Although the relationship between the level of inequality and social outcomes has proven difficult to demonstrate with existing data, what can be shown is that both within societies and on the individual level, having a better education means better social outcomes in terms of prosperity, health and longevity. Access to quality education for all is, therefore, crucial for promoting equity.
Education occupies a special place in the inequality debate. Differences in educational attainment and status are important markers of inequalities. In turn, unequal educational opportunities potentially weaken social cohesion and, especially, social mobility. Detailed analyses can give indications as to which areas require the attention of policy-makers and policy action. Hence the role of education indicators can serve as a barometer for existing and future inequalities. The following paragraphs describe the influence of education and education inequalities on various key areas of life.
Education affects several quality of life outcomes, e.g. income, self-reliance, social support network, mortality risk, perceived health status and time invested in developmentally enriching activities with children15.
15 Edgerton, J. D.; Roberts, L. W. and Below, S. von (2012). Education and Quality of Life. , Chapter:
Education and the Quality of Life. In Land, K.C., Michalos, A.C. and Sirgy, J., Handbook of Social Indicators and Quality of Life Research pp. 265-296.
AT BE BG CY CZ DE DK EE EL ES FI FR HR HU IE IT LT LU LV MT NL PL PT RO SE SI SK UK
y = -2.6964x + 568.89 R² = 0.2619
0 5 10 15 20 25 30 35 40 45
22 24 26 28 30 32 34 36 38 40
1.1.2
Key areas of life affected by education inequalities
1.1.2.1 Education, income and socio-economic status
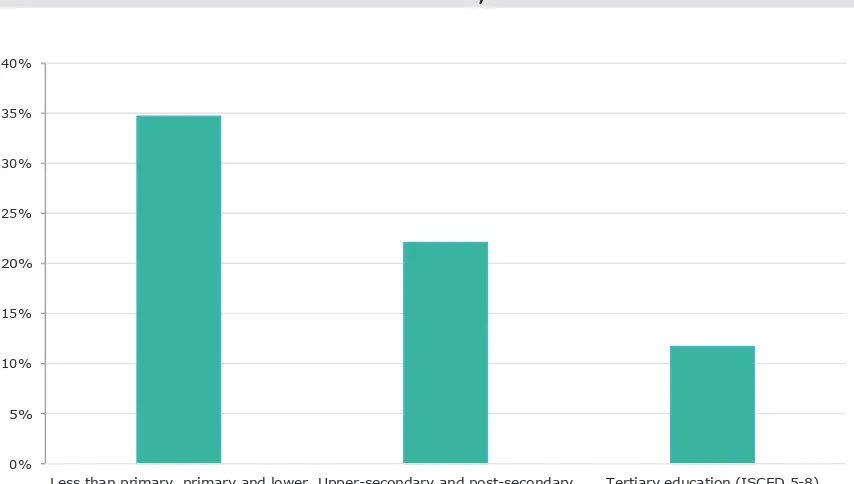
[image:30.624.84.511.213.455.2]The level of education has been demonstrated to have a direct impact on an individual’s income over his or her lifecycle16. Figure 4 shows that people without upper secondary education are almost three times more likely to be at risk of poverty, severely materially deprived and/or living in a low work intensity household than those with tertiary education.
Figure 4 — At-risk-of-poverty rate and social exclusion in EU by educational attainment level, 2015
Source: Eurostat, EU SILC. Online data code: [ilc_peps04].
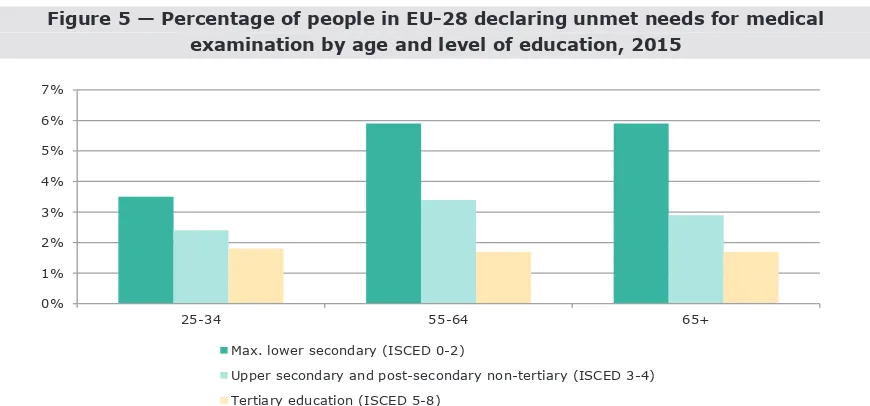
Education levels are linked to higher self-rated health rates and lower morbidity rates17, with the health returns to education being particularly high in disadvantaged families18. A recent analysis of the 2014 European Social Survey19 makes a link between high educational attainment and a reduced risk of depression, again particularly for people coming from disadvantaged families.
Across the EU, the perception of being in good or very good health in 2015 was highest among people who had completed tertiary education (80.4 %) while only 53.8 % of those with at most lower secondary education rated their health so highly. Similarly, people with lower education have higher rates of ‘self-reported unmet needs for medical examination’: In 2015, 4.8 % of those with at most lower secondary education reported unmet needs for medical examination, compared to 2.6 % of those with middle education and only 1.9 % among those with tertiary
16 Guidetti, G. and Rehbein, B. (2014). Theoretical Approaches to Inequality in Economics and Sociology.
A Preliminary Assessment, Transcience Vol. 5, Issue 1.
17 Badley, E. M., Canizares, M., Perryccio, A. V., Hogg-Johnson, S., Gignac, M. A. (2015). Benefits
Gained, Benefits Lost: Comparing Baby Boomers to Other Generations in a Longitudinal Cohort Study of Self-Rated Health. The Milbank Quarterly, 93(1), pp. 40-72.
18 Andersson, M. A. (2016). Health returns to education by family socio-economic origins, 1980–2008:
Testing the importance of gender, cohort, and age, SSM — Population Health 2 (2016), pp. 549-560.
19 Andersson, M. A. and Vaughan, K. (2017). Adult health returns to education by key childhood social
and economic indicators: Results from representative European data, SSM — Population Health 3, 2017, pp. 411-418.
0% 5% 10% 15% 20% 25% 30% 35% 40%
Less than primary, primary and lower
education20. This effect holds for all age groups though it is slightly affected by the recent expansion of education which implies that people with low educational attainment are more likely to be old.
Figure 5 — Percentage of people in EU-28 declaring unmet needs for medical examination by age and level of education, 2015
Source: Eurostat, EU SILC, [hlth_silc_14].
Reading note: The reasons evoked for the unmet needs are: too expensive or too far to travel or waiting list.
Life expectancy grows with education. As Figure 6 shows, the education premium can span up to 10 years between the low- and highly-qualified.
Figure 6 — Life expectancy (in years) by educational attainment level in selected EU countries, 2015
Source: Eurostat, online data code: [demo_mlexpecedu]
A recent study on health inequalities21 argues that the low educated have a higher mortality risk for preventable causes, which are causes sensitive to behaviour change, medical intervention and injury prevention.
20 Eurostat, 2017 data, on ‘Self-reported unmet needs for medical examination’. Online data code:
[hlth_silc_14].
0% 1% 2% 3% 4% 5% 6% 7%
25-34 55-64 65+
Max. lower secondary (ISCED 0-2)
Upper secondary and post-secondary non-tertiary (ISCED 3-4)
Tertiary education (ISCED 5-8)
50 55 60 65 70 75 80 85 90
SK BG HU RO PL CZ DK FI SI EL SE PT IT Less than primary, primary and lower secondary education (levels 0-2)
[image:31.624.83.515.431.634.2]1.1.2.2 Parental background and gender
[image:32.624.84.506.372.576.2]Recent studies document the psychological barriers to success in higher education among students from weaker socio-economic backgrounds that tend to underestimate their potential22. A Finnish study showed that children from families with more highly educated parents have higher chances of becoming more qualified and obtaining better paid jobs, with the father’s educational status prevailing as the explanatory factor23. While in infancy, the mother’s education better accounts for their children’s outcomes, the educational background of fathers accounted more for the outcomes of children in their early adulthood. That could be because parental education is a proxy of family wealth or social status, which equips children with social capital for finding good jobs. The role of education would be to equalise these opportunities. Gender has long been viewed as one of the key factors influencing educational achievements24. This is clearly demonstrated for the EU Europe 2020 benchmark targets. Male early leavers from education and training are more numerous by 3 pp, while male tertiary educational attainment is lower by 9.5 pp. Moreover, women accounted for 58 % of the 5 million tertiary graduates in 2015. Such clear differences in educational achievement between women and men spill over into the professions chosen by them and therefore have a direct influence on the labour market segmentations seen in many countries, with occupations that are clearly dominated by women and men respectively.
Figure 7 — Distribution of EU graduates in tertiary education by field and sex, 2015
Source: Eurostat, UOE 2015, online data code: [educ_uoe_grad02].
Women predominate in the academic fields of education and training, health, welfare, humanities and arts, while men dominate the fields of engineering, manufacturing and construction and ICT (this pattern being more visible among students than teachers).
21 Mackenbach et al. (2015). Variations in the relation between education and cause-specific mortality in
19 European populations: A test of the 'fundamental causes' theory of social inequalities in health. Social Science & Medicine 127, pp. 51-62.
22 Marginson, S. (2016). The Dream Is Over: The Crisis of Clark Kerr's California Idea of Higher
Education, p. 153.
23 Erola, J., Jalonen, S. and Lehti, H. (2016). Parental education, class and income over early life course and children's achievement. Research in Social Stratification and Mobility, Vol. 44, pp. 33–43.
24 For an early reference to gender differences in educational outcomes see Eurydice (2010): ‘Gender
differences in educational outcomes: Study on the Measures taken and the Current Situation in Europe’. See also: OECD 2014: ‘Are boys and girls equally prepared for life?’ (based on PISA 2012).
0% 10% 20% 30% 40% 50% 60% 70% 80% 90% 100% Information and Communication Technologies
Engineering, manufacturing and construction Agriculture, forestry, fisheries and veterinary
Services Natural sciences, mathematics and statistics Business, administration and law Social sciences, journalism and information Arts and Humanities
Health and welfare Education