This is a repository copy of
Acoustic insertion loss due to two dimensional periodic arrays
of circular cylinders parallel to a nearby surface
.
White Rose Research Online URL for this paper:
http://eprints.whiterose.ac.uk/105122/
Version: Accepted Version
Article:
Krynkin, A. orcid.org/0000-0002-8495-691X, Umnova, O., Vicente Sanchez-Perez, J. et al.
(3 more authors) (2011) Acoustic insertion loss due to two dimensional periodic arrays of
circular cylinders parallel to a nearby surface. Journal of the Acoustical Society of America,
130 (6). pp. 3736-3745. ISSN 0001-4966
https://doi.org/10.1121/1.3655880
Copyright 2011 Acoustical Society of America. This article may be downloaded for
personal use only. Any other use requires prior permission of the author and the Acoustical
Society of America. The following article appeared in J. Acoust. Soc. Am. 130 (6),
December 2011 and may be found at http://link.aip.org/link/?JAS/130/3736/.
Reuse
Unless indicated otherwise, fulltext items are protected by copyright with all rights reserved. The copyright exception in section 29 of the Copyright, Designs and Patents Act 1988 allows the making of a single copy solely for the purpose of non-commercial research or private study within the limits of fair dealing. The publisher or other rights-holder may allow further reproduction and re-use of this version - refer to the White Rose Research Online record for this item. Where records identify the publisher as the copyright holder, users can verify any specific terms of use on the publisher’s website.
Takedown
If you consider content in White Rose Research Online to be in breach of UK law, please notify us by
arXiv:1102.3159v4 [math-ph] 3 Jul 2012
Acoustic insertion loss due to two dimensional
periodic arrays of circular cylinders parallel to a
nearby surface
Anton Krynkin1, Olga Umnova1,
Juan Vicente S´anchez-P´erez2,
Alvin Yung Boon Chong3, Shahram Taherzadeh3, Keith Attenborough3
1
Acoustics Research Centre, The University of Salford, Salford, Greater Manchester, UK
2
Universitat Polit´ecnica de Valencia Cno. de Vera s/n 46022 Valencia, Spain
3
Department of Design Development Environment and Materials, The Open University, Milton Keynes, UK email: [email protected], [email protected]
July 4, 2012
Abstract
1
Introduction
Periodic arrangements of acoustic scatterers embedded in a medium with different physical properties give rise to band gaps i.e ranges of frequencies in which the transmission of acoustic waves is forbidden. If the scatter-ers are solid and the embedding medium is air then these arrays are called Sonic Crystals (SC). There is interest in the potential use of sonic crystals as environmental noise barriers. A semi-analytical approach for predicting the transmission properties of sonic crystals has been developed for circular scatterer cross-sections and it is based on the superposition of the solution for a single scatterer [1, 2]. However, this scattering approach predicts their acoustical performance in the absence of a ground plane. Clearly this will be unrealistic if SCs are to be used as noise barriers since a ground will always be present. Although the most interesting situation is likely to involve peri-odic vertical finite cylinder arrays above a ground plane, this would require solution of a 3D problem and hence involve numerical methods and high computation resources. Here is considered the more tractable 2D problem involving a periodic array of cylinders with their axes parallel to the ground. If the ground can be considered to be acoustically-rigid then the mul-tiple scattering method can be modified using the method of images to construct the reflected acoustic field [3]. For finite impedance ground, it is necessary also to satisfy impedance boundary conditions on the ground by, for example, using the Weyl–Van der Pol formula [4]. Alternatively, a semi-analytical solution has been developed for electromagnetic wave propagation that involves an integral representation of the reflected field [5]. Numerical approaches can allow for more complex geometries. The Boundary Element Method (BEM) based on the integral equation method is the most common of these. Specifically it is possible to modify the Green’s function [6] so that the domain with impedance ground transforms into an unbounded acous-tic medium. The result is that the boundary integral equations are only considered over the surface of the scatterers. With this approach the com-putation time can be relatively low compared to that for the full problem with the ground as an additional surface. The method has been widely used to predict the performance of the noise barriers in the presence of a finite impedance ground [7, 8].
In this paper, semi-analytical and numerical methods are used to predict
the performance of 5×3 and 7×3 square lattice arrays consisting of either
xxxxxxxxxxxxxxxxxxxxxxxxxxxxxxxxxxxxxxxxxxxxxxxxxxxxxxxxxxxxxxxxxxxxxxxxxxxxxxxxxxxxxxxxxxxxxxxxxxxxxxxxxxxxxxxxxxxxxxxxxxxxxx xxxxxxxxxxxxxxxxxxxxxxxxxxxxxxxxxxxxxxxxxxxxxxxxxxxxxxxxxxxxxxxxxxxxxxxxxxxxxxxxxxxxxxxxxxxxxxxxxxxxxxxxxxxxxxxxxxxxxxxxxxxxxx xxxxxxxxxxxxxxxxxxxxxxxxxxxxxxxxxxxxxxxxxxxxxxxxxxxxxxxxxxxxxxxxxxxxxxxxxxxxxxxxxxxxxxxxxxxxxxxxxxxxxxxxxxxxxxxxxxxxxxxxxxxxxx xxxxxxxxxxxxxxxxxxxxxxxxxxxxxxxxxxxxxxxxxxxxxxxxxxxxxxxxxxxxxxxxxxxxxxxxxxxxxxxxxxxxxxxxxxxxxxxxxxxxxxxxxxxxxxxxxxxxxxxxxxxxxx
... ... ...
... ... ...
O Hy
P r0
Rj
x y
Hx
... ... ...
... ... ... rj
r'j
R'j R0
R'0
(a)
xxxxxxxxxxxxxxxxxxxxxxxxxxxxxxxxxxxxxxxxxxxxxxxxxxxxxxxxxxxxxxxxxxxxxxxxxxxxxxxxxxxxxxxxxxxxxxxxxxxxxxxxxxxxxxxxxxxxxxxxxxxxxx xxxxxxxxxxxxxxxxxxxxxxxxxxxxxxxxxxxxxxxxxxxxxxxxxxxxxxxxxxxxxxxxxxxxxxxxxxxxxxxxxxxxxxxxxxxxxxxxxxxxxxxxxxxxxxxxxxxxxxxxxxxxxx xxxxxxxxxxxxxxxxxxxxxxxxxxxxxxxxxxxxxxxxxxxxxxxxxxxxxxxxxxxxxxxxxxxxxxxxxxxxxxxxxxxxxxxxxxxxxxxxxxxxxxxxxxxxxxxxxxxxxxxxxxxxxx xxxxxxxxxxxxxxxxxxxxxxxxxxxxxxxxxxxxxxxxxxxxxxxxxxxxxxxxxxxxxxxxxxxxxxxxxxxxxxxxxxxxxxxxxxxxxxxxxxxxxxxxxxxxxxxxxxxxxxxxxxxxxx
... ...
... ... ...
O
R0m
x y
... ... ...
... ... ... R'mp R'0m Rmp
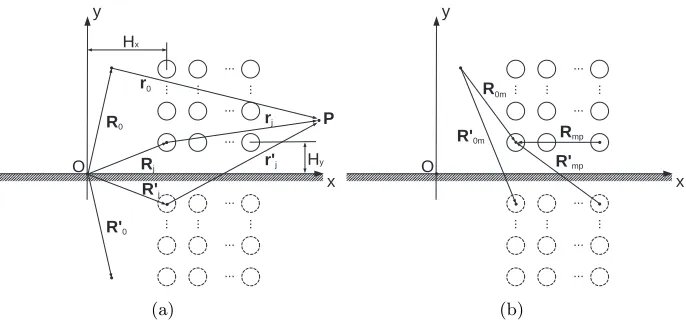
[image:4.612.135.478.127.287.2](b)
Figure 1: Square lattice array above a perfectly reflecting plane. (a) Set of vectors used in equation (4). (b) Set of vectors employed in equation (8).
data from experiments carried out in an anechoic chamber are compared with predictions. It is shown how the presence of the impedance ground affects the IL peaks associated with the so-called band gaps of the sonic crystals.
The analytical and numerical approaches are outlined and some of the resulting predictions are discussed in section 2. The experiments are de-scribed in section 3. Predictions and data are compared and discussed in section 4 before concluding remarks are made in section 5.
2
Analytical and numerical formulations
2.1 Multiple scattering
2.1.1 Rigid scatterers
Consider a point source and an array of M circular scatterers placed in a
(positive) half-space characterised by the sound speed in air c = 344 m/s
and densityρ = 1.2 kg/m3. Figure 1 illustrates the geometry of the array
and its image. The position of each scatterer Cm, m = 1..M, is given by
the vector Rm. The position of the image of scatterer Cm is defined by the
radius vector R′m. The scatterers are considered to be arranged in a square
lattice which is defined by the lattice constant L. However the methods
equation in the half-space that is written in polar coordinates (r, θ) as
∆p(r) +k2p(r) = 0, (1)
where ∆ = 1
r ∂ ∂r
r ∂ ∂r
+ 1
r2
∂2
∂θ2,r=r(cosθ,sinθ) is the radius vector,pis
acoustic displacement potential,k=ω/c,ω is angular frequency. Equation
(1) is solved in conjunction with radiation conditions
∂p
∂r −ikp=o
r−1/2, asr → ∞, (2)
and with the Neumann condition imposed on the boundary of acoustic half-space (i.e. rigid ground) and on the surface of the scatterers (this condition has to be replaced by continuity conditions if scatterer is an elastic shell [10]) that is
∂p
∂n = 0. (3)
Using the multiple scattering technique [1, 9] and the method of images [3] the general solution of the formulated problem can be written as [11]
p(r) =p0(r) +ps(r), (4) whereby contributions from the point source and its image are collected in
p0 i.e.
p0(r) =p0,d(r) +p0,r(r), (5a)
p0,d(r) =H0(1)(kr0), (5b)
p0,r(r) =H0(1)(kr0′), (5c)
whereas scattered direct and reflected acoustic fields are described by
ps(r) =ps,d(r) +ps,r(r), (6a)
ps,d(r) = M
X
m=1
+∞
X
n=−∞
AmnZnmHn(1)(krm)einθm, (6b)
ps,r(r) = M
X
m=1
+∞
X
n=−∞
AmnZnmHn(1)(krm′ )e−inθ′m. (6c)
The vectorr0=r0(cosθ0,sinθ0) connects the point source and the receiver
connects the centre of scatterer Cm and the receiver. The prime (′) is used
to indicate the geometrical parameters for the image source and the image
scatterers placed in the negative half-space. Amn, n ∈ Z, m = 1..M are
unknown coefficients.
The factors describe the type of conditions imposed on the surface of the scatterers and in case of rigid cylinders they can be expressed as [1]
Znm = ∂rJn(kam)
∂rHn(1)(kam)
. (7)
wheream is the radius of scatterer Cm and ∂r is the derivative with respect
to polar coordinate r.
The solution for the unbounded acoustic space can be retrieved from equation (4) by putting to zero in equations (5a) and (6a) all terms related
to the constructed images that are p0,r and ps,r respectively. One can also
deduce from equation (4) and vector definitions in Figure 1(a) that for the source and receiver both on the ground the acoustic pressure in a half-space is double the pressure in the unbounded acoustic space.
Applying the addition theorem [13, 14], described in Appendix A, to the solution (4) and substituting it to the boundary condition (3), the algebraic
system of equations can be derived to find the unknown coefficients Am
n.
This system is given by
Amn+ (8)
∞
X
q=−∞
M
X
p=1, p6=m
ApqZqpHq(1)−n(kRmp)ei(q−n)(π+αmp)+ M
X
p=1
ApqZqpHq(1)+n(kRmp′ )e−i(q+n)α′mp+iqπ
=−Hn(1)(kR0m)e−in(π+α0m)
−Hn(1)(kR′0m)e−in(π+α
′
0m), n∈Z, m= 1..M,
where vectorR0m =R0m(cosα0m,sinα0m) defines the position of scatterer
Cm with respect to point source and vector Rmp = Rmp(cosαmp,sinαmp)
defines the position of scatterer Cp with respect to scattererCm. Again the
system of equations (8) can be transformed to that for the case of unbounded acoustic space by eliminating all terms dependent on the geometrical param-eters of image source and scatterers. To be solved numerically the infinite
system of equations (8) is truncated to the finite number of M(2N + 1)
equations. If 5 < N < 7, the numerical solution is accurate up to four
true for the codes executed in the GNU Compiler Collection (GCC) as well as for the scripts using a commercial software MATLAB.
200 400 600 800 1000 1200 1400 1600 −5
0 5 10 15 20 25
5x3 over rigid ground 10x3 in the free field 5x3 in the free field
In
se
rt
io
n
L
os
s
(d
B
)
Frequency ω 2π Hz
(a)
... ... ...
... ... ...
O x
y
... ... ...
...
(b)
...
... ... ...
O x
y
...
xxxxxxxxxxxxxxxxxxxxxxxxxxxxxxxxxxxxxxxxxxxxxxxxxxxxxxxxxxxxxxxxxxxxxxxxxxxxxxxxxxxxxxxxxxxxxxxxxxxxxxxxx xxxxxxxxxxxxxxxxxxxxxxxxxxxxxxxxxxxxxxxxxxxxxxxxxxxxxxxxxxxxxxxxxxxxxxxxxxxxxxxxxxxxxxxxxxxxxxxxxxxxxxxxx xxxxxxxxxxxxxxxxxxxxxxxxxxxxxxxxxxxxxxxxxxxxxxxxxxxxxxxxxxxxxxxxxxxxxxxxxxxxxxxxxxxxxxxxxxxxxxxxxxxxxxxxx xxxxxxxxxxxxxxxxxxxxxxxxxxxxxxxxxxxxxxxxxxxxxxxxxxxxxxxxxxxxxxxxxxxxxxxxxxxxxxxxxxxxxxxxxxxxxxxxxxxxxxxxx
(c)
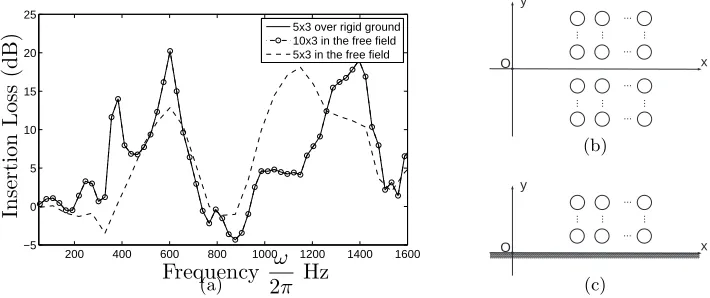
Figure 2: (a) Predicted insertion loss spectra with source and receiver
coor-dinates of (0,0) and (10,0) respectively (i) for a 5×3 square array of rigid
cylinders with am = 0.1 m above acoustically-rigid plane at y = 0, (ii) for
the same array in the free field and (iii) for the array plus its mirror image
(a 10×3 array) in the free field. (b) Diagram showing that the 10×3 array
in the free field consists of the original 5×3 array plus its mirror image in
the ground plane. (c) Diagram of the 5×3 array over rigid ground.
In Figure 2, the predicted insertion loss spectrum due to a 5×3 array
of rigid scatterers over an acoustically-rigid ground is compared with those obtained (a) for the same array in free field conditions and (b) for the original
array plus its mirror image array i.e. a 10×3 array in free field conditions. In
all configurations the nearest part of an array from the source is atHx= 1.5
m. Also note that throughout this paper the insertion loss is calculated as
IL= 20 log10
p0
p
. (9)
In the free field the cylinder locations in the lower half of the 10×3 array are
defined by the coordinates of the image cylinders in the half-space problem.
The distance to the ground, Hy = 0.15 m, of the centers of the lowest
cylinders in the array is half of the lattice constantL= 0.3 m so that they
[image:7.612.128.483.171.320.2]500 1000 1500 2000 2500 3000 3500 4000 4500 5000 −15
−10 −5 0 5 10 15 20 25 30 35
7x3 array over rigid ground, xr=1.203 m, yr=0 m 7x3 array over rigid ground, xr=1.203 m, yr=0.235 m 7x3 array in the free field
In
se
rt
io
n
L
os
s
(d
B
)
[image:8.612.210.402.129.275.2]Frequency ω 2π Hz
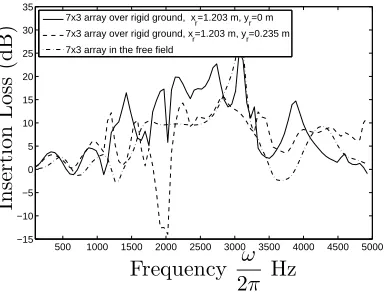
Figure 3: Predicted insertion loss spectra with source coordinates (0,0.235)
m for 7×3 array of rigid cylinders with am = 0.0275 (i) over
acoustically-rigid ground with receiver coordinates (1.203,0) m (solid black line) (ii) over acoustically-rigid ground with receiver coordinates (1.203,0.235) (bro-ken line) and (iii) in free field (dash-dot line) with receiver coordinates (1.203,0).
on the ground, the predicted insertion loss spectrum of the 5×3 array in
the presence of the rigid ground is the same as that predicted for an array of
double the size (10×3) in the free field. It is also observed that the insertion
loss of a 5×3 array in a half-space is predicted to be higher near 573 Hz
(the first Bragg band gap) than that for the same size of the array in the unbounded acoustic space.
Figure 3 compares predicted insertion loss spectra for 7×3 array of
rigid cylinders with its counterpart in the free acoustic field. As before the
cylinders are arranged in a square lattice with L = 0.069 m. The nearest
part of the array from the source is atHx = 0.755 m and the distance of the
array to the ground isHy = 0.0345 m. The predicted effect of raising the
receiver is clearly detrimental to insertion loss at frequencies corresponding to the (rigid) ground effect dip. It is also observed that performance of the array over the rigid ground with receiver on the ground is predicted to be improved between 2000 Hz and 3000 Hz compared to that in the unbounded acoustic space.
2.1.2 Elastic shell scatterers
200 400 600 800 1000 1200 −5
0 5 10 15 20 25
rigid
elastic, 2h=0.001m elastic, 2h=0.002m
In
se
rt
io
n
L
os
s
(d
B
)
Frequency ω 2π Hz
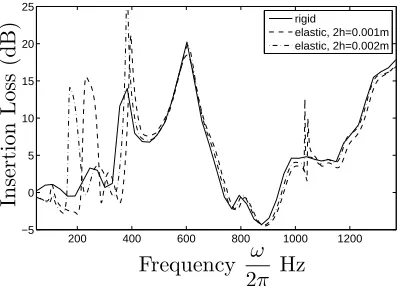
Figure 4: Predicted insertion loss spectra for the source-receiver-array
(5×3) geometry specified for Figure 2(c) in the presence of
acoustically-rigid ground at y = 0, with rigid cylinders (solid line), elastic shells
(ρs = 1650kg/m3, E = 1.75 MPa, ν = 0.4998, c2 = 23 m/s, am = 0.1)
with wall thickness 2h= 0.001 m (broken line) and elastic shells with wall
thickness 2h= 0.002 m (dot-dash line).
rigid ground. The identical elastic shells are characterised by their density
ρs, Young’s modulusE, Poisson’s ratio ν, shear velocity c2, half-thickness
h and the mid-surface radius S = am −h. For certain ranges of values
of these parameters, the first elastic shell resonance (i.e. the axisymmetric resonance) can be observed below the first Bragg band gap associated with the lattice constant of the array in the unbounded acoustic space. This results in additional positive insertion loss peaks [10].
The asymptotic theory of thin elastic shells [15] has been used [10, 11] to derive the factors
Znm = ∂rJn(kS)
∂rHn(1)(kS) +iUn
, (10)
where
Un=
ǫ κ
n2
−k32S2
πSh 1 +n2−k2 3S2
∂rJn(kS)
. (11)
ǫ=ρc/(ρsc2) is the relative impedance,κ=c/c2andk3=ω
p
ρ(1−ν2)/E.
If the relative impedance (ǫ) tends to zero, thenUn becomes negligible and
the form ofZm
n in (10) reduces to that in (7).
[image:9.612.206.406.129.272.2]plus its mirror image array i.e. doubled in size. Additional insertion loss peaks due to axisymmetric resonances of the elastic shells are observed below the peak related to the Bragg band gap. The frequency of the axisymmetric resonance reduces with the increased shell thickness.
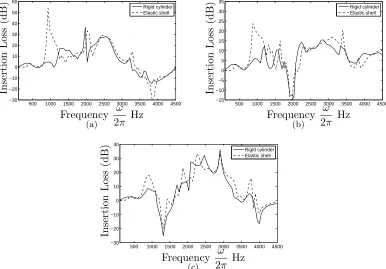
Figure 5 compares insertion loss spectra for 7×3 rigid cylinder and elastic
shell arrays above acoustically-rigid ground with different receiver heights.
Scatterers are arranged in square lattice with L = 0.069 m. The position
of the arrays with respect to the source and ground plane is identical to that described in Figure 3. It is shown that the existence of the predicted effect due to axisymmetric resonances of the elastic shells (see Figure 4) is dependent on the geometrical parameters of the problem such as receiver coordinates. For the receiver heights 0.117 m and 0.235 m considered in Fig-ures 5(a) and (b) respectively, the additional peak due to the axisymmetric resonance of the shell appears around 1000 Hz. On the other hand this peak does not exist when receiver is raised to the 0.352 m (see Figure 5(c)) since there is a destructive interference in the ground effect at this frequency.
2.2 Calculations based on the boundary integral equation
To investigate the influence of finite impedance of a ground plane on the insertion loss due to an array of regularly spaced cylinders parallel to the impedance surface the solution has been sought to an appropriate boundary integral equation.
The Laplacian in equation (1) is rewritten in terms of (x, y) coordinates
using ∆ =∂2/∂x2+∂2/∂y2.
The boundary condition imposed on the ground surface is written as
∂p
∂y−ikβp= 0, (12)
whereβis admittance of the homogeneous impedance plane [6, eq. (1.2.11)].
Then, applying relations (1),(2), (12) and condition of rigid scatterer
surface∂p/∂r= 0 to the Green’s theorem [16] the integral equation forp(r)
can be derived in the following form [11, 12]
ǫ(r)p(r) =Gβ(r0,r) +
M
X
m=1
Z
∂Cm
∂Gβ(rs,r)
∂n(rs)
p(rs)ds, (13)
where
ǫ(r) =
(
1, r∈/Cm
500 1000 1500 2000 2500 3000 3500 4000 4500 −30 −20 −10 0 10 20 30 40 50 60 Rigid cylinder Elastic shell In se rt io n L os s (d B ) Frequency ω 2π Hz (a)
500 1000 1500 2000 2500 3000 3500 4000 4500
−15 −10 −5 0 5 10 15 20 25 30 35 Rigid cylinder Elastic shell In se rt io n L os s (d B ) Frequency ω 2π Hz (b)
500 1000 1500 2000 2500 3000 3500 4000 4500
−30 −20 −10 0 10 20 30 40 Rigid cylinder Elastic shell In se rt io n L os s (d B ) Frequency ω 2π Hz
[image:11.612.128.514.211.480.2](c)
Figure 5: Predicted insertion loss spectra with source coordinates (0,0.235)
m for a 7×3 array of (i) rigid cylinders of radius am = 0.0275 m (solid
black line) and (ii) elastic shells of radius am = 0.0275 m and thickness
2h = 0.00025 m (broken line) over acoustically-rigid ground with receiver
200 400 600 800 1000 1200 −5
0 5 10 15 20 25 30 35 40
semi−analytical numerical
In
se
rt
io
n
L
os
s
(d
B
)
Frequency ω 2π Hz
(a)
200 400 600 800 1000 1200
−5 0 5 10 15 20
25 σ=250 kPa s/m
2
σ=168 kPa s/m2
σ=20 kPa s/m2
In
se
rt
io
n
L
os
s
(d
B
)
Frequency ω 2π Hz
[image:12.612.126.507.131.274.2](b)
Figure 6: Predicted insertion loss spectra with source and receiver
coordi-nates (0,0) m and (10,0.45) m respectively for a square 5×3 array of rigid
scatterers of radius 0.1 m with lattice constant L= 0.3 m, Hx = 1.5 m and
Hy = 0.15 m. The array of scatterers is placed above (a) an
acousticallyrigid ground (scattering theory solid line; boundary element calculation -broken line) and (b) an impedance ground (the solid, -broken and dash-dot lines correspond to the different values of effective flow resistivity in the key).
with r = (x, y), n(rs) is the unit vector normal to the scatterer surface
and directed outward, and ∂Cm is the surface of scatterer Cm. Gβ(r0,r),
which is the solution for a half space above an impedance plane, is given by equations (2.1.2), (2.1.20), (2.1.21), (2.1.44) and (3.6.21) in [6] and is not repeated here. Note, that in relation (14) the corner points of an obstacle are not defined due to the circular shape of the scatterers.
Figure 6(a) demonstrates that the boundary integral formulation yields results close to those obtained using multiple scattering theory for an array of horizontal cylinders above acoustically-rigid ground. In case of the rigid ground the computation time is comparable with that of the semi-analytical method (8). The difference in the predictions at higher frequencies can be reduced by finer discretization of the surface of the scatterers. This however increases the computation time.
that for the rigid ground. The predicted insertion loss spectrum for the
lowest value of effective flow resistivity (20 kPa s/m2 corresponding to a
mineral wool) shows more or less complete elimination the band-gap effect whereas the predicted insertion loss spectra for the higher flow resistivities
(168 kPa s/m2 and 250 kPa s/m2 corresponding to hay and grassland
respec-tively) indicate that in the presence of a relatively acoustically-rigid surface
the IL spectrum due to the 5×3 array is predicted to include maxima in
the frequency intervals corresponding to the array band-gaps.
An alternative approach to BEM is that based on the Weyl-Van der Pol formula modeling locally reacting ground [19]. This approach has been employed for a single scatterer above an impedance plane [20, 21]. Com-pared to BEM the use of the Weyl-Van der Pol formula has the advantage of reduced computation time comparable with that of the semi-analytical approach for the scatterers over the rigid ground. However its application to an array of scatterers is heuristic and can only be used within a limited range of source-array and array-receiver distances. An example in section 4 shows that the results deteriorate with increasing receiver height.
3
Laboratory experiments
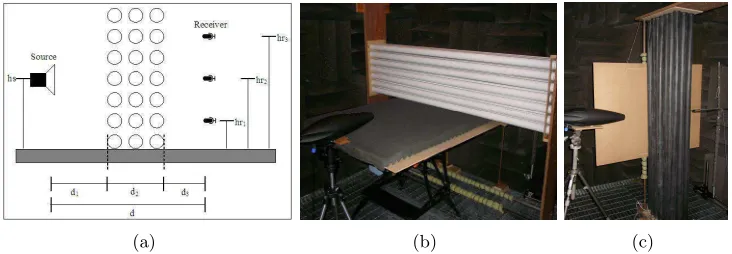
Measurements of the insertion loss spectra due to arrays of regularly spaced parallel rigid cylinders and elastic shells without and with ground planes have been carried out in an anechoic chamber. Rigid cylinders consisted of 2 m long PVC pipes with outer diameter 0.055 m. 2 m long elastic shells were made from 0.25 mm thick sheets of Latex by overlapping the edges and gluing them together. The sound source was a Bruel & Kjaer point source loudspeaker controlled by a Maximum-Length Sequence System An-alyzer (MLSSA) system enabling determination of impulse responses in the presence of noise. A Bruel & Kjaer 1/2 inch microphone was used as the re-ceiver. Figures 7 (a), (b) and (c) show example measurement arrangements. Supports for the 2 m long cylinders were provided by holed MDF boards at the top and base of each array. To maintain their shape and vertical orien-tation, the latex cylinders were slightly inflated above atmospheric pressure through a common pipe connecting to a small pump.
(a) (b) (c)
Figure 7: (a) Schematic of the experimental configuration showing the source location, the sonic crystal array and three receiver locations. (b) Photograph of experimental arrangement with rigid cylinder array above an impedance (polyurethane foam layer) ground. (c) Photograph of experimental arrange-ment with Latex shell array near to rigid (MDF board) ground
were parallel to the board. For simplicity all distances to the MDF board in both setups are referred to as heights. As shown in Figure 7(a), the
loud-speaker point source was positioned d1 = 0.755 m from the array of rigid
cylinders and d1 = 0.35 m from the array of Latex shells at the height of
the horizontal mid-plane of the array (hs = 0.23 m above the ground). The
height of the receiver microphone was hr1 = 0.117 m, hr2 = 0.235 m or
hr3 = 0.352 m and it was placed in a vertical plane d3 = 0.257 m from the
back of the array. The receiver heights were chosen to be below, at, and above, the horizontal mid-plane of the array. In all cases, the distance be-tween the microphone and the cylinder array has been considered the same.
The difference between the sound levels recorded in the X direction (0◦) at
the same point behind the array with and without the ground was measured [22].
4
Comparisons between data and predictions
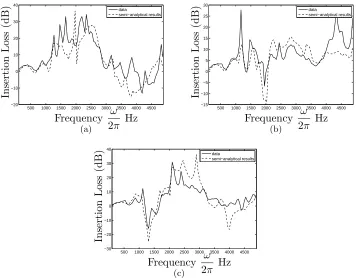
Figure 8 compares measured and predicted insertion loss spectra for a 7×3
[image:14.612.125.491.131.258.2]500 1000 1500 2000 2500 3000 3500 4000 4500 −20 −10 0 10 20 30 40 data semi−analytical results In se rt io n L os s (d B ) Frequency ω 2π Hz
(a)
500 1000 1500 2000 2500 3000 3500 4000 4500 −15 −10 −5 0 5 10 15 20 25 30 data semi−analytical results In se rt io n L os s (d B ) Frequency ω 2π Hz
(b)
500 1000 1500 2000 2500 3000 3500 4000 4500 −30 −20 −10 0 10 20 30 40 data semi−analytical results In se rt io n L os s (d B ) Frequency ω 2π Hz
[image:15.612.128.484.128.406.2](c)
Figure 8: Measured (solid line) and predicted (broken line) insertion loss
spectra for a square 7×3 array of rigid cylinders of diameter 0.055 m over
acoustically-rigid ground with source coordinates (0,0.235) m and receiver coordinates (a) (1.203,0.117) m, (b) (1.203,0.235) m and (c) (1.203,0.352) m.
Both data and predictions in Figures 8(a) and 8(c) show IL maxima near 2500 Hz which are associated with the Bragg band gaps expected in the unbounded domain. Both data and predictions for the elevated receiver heights (0.235 m and 0.352 m) show the adverse influences of destructive interference associated with the (rigid) ground effect on the IL spectra near 2000 Hz and 1250 Hz. Indeed in Figure 8(b), for the receiver at 0.235 m height, it is clear that the destructive interference in the ground effect near 2500 Hz is rather dominant.
The measured and predicted performances of 7×3 array of Latex shells
500 1000 1500 2000 2500 3000 −20 −10 0 10 20 30 40 data semi−analytical results In se rt io n L os s (d B ) Frequency ω 2π Hz (a)
500 1000 1500 2000 2500 3000
−20 −10 0 10 20 30 40 data semi−analytical results In se rt io n L os s (d B ) Frequency ω 2π Hz (b)
0 500 1000 1500 2000 2500 3000
−20 −10 0 10 20 30 40 data semi−analytical results In se rt io n L os s (d B ) Frequency ω 2π Hz
[image:16.612.124.515.125.404.2](c)
Figure 9: Measured (solid line) and predicted (broken line) insertion loss
spectra due to a square 7×3 array of Latex shells of diameter 0.055 m,
thickness 0.00025 m and material parameters specified for Figure 4 over acoustically-rigid ground. The source is at coordinates (0,0.235) m and the receiver coordinates are (a) (1.203,0.117) m, (b) (1.203,0.235) m and (c) (1.203,0.352) m.
corresponding positive IL peak is no longer present.
Figure 10 compares the measured and predicted insertion loss spectra
for 7×3 rigid cylinder arrays over finite impedance ground using the
source-array-receiver geometries described in section 3. To obtain the predictions in Figure 10 the properties of impedance of the hard-backed foam layer have been deduced from best fits short range measurements of complex excess attenuation[23]. As a result the finite impedance (open cell foam
layer) surface is represented by a two parameter impedance model withσe=
4 kPa s/m2,α
e= 105 m−1. There are discrepancies between predictions and
Figure 8 the IL minima associated with the ground effect are shifted towards lower frequencies. Both measurements and predictions show that as a result of this shift in the ground effect the IL maxima related to the Bragg band gap can be observed for all three positions of the receiver.
500 1000 1500 2000 2500 3000 3500 4000 4500 −10 −5 0 5 10 15 20 25 30 35 data BEM In se rt io n L os s (d B ) Frequency ω 2π Hz
(a)
500 1000 1500 2000 2500 3000 3500 4000 4500 −10 −5 0 5 10 15 20 25 30 35 data BEM In se rt io n L os s (d B ) Frequency ω 2π Hz
(b)
500 1000 1500 2000 2500 3000 3500 4000 4500 −10 −5 0 5 10 15 20 25 30 data BEM In se rt io n L os s (d B ) Frequency ω 2π Hz
(c)
Figure 10: Measured (solid lines) and predicted (broken lines) insertion loss
spectra for a square 7×3 array of rigid cylinders of diameter 0.055 m over
finite impedance ground with source coordinates (0,0.235) m and receiver coordinates (a) (1.203,0.117) m, (b) (1.203,0.235) m and (c) (1.203,0.352) m.
The Weyl–Van der Pol formula [19] can also be used to predict the field due to a point source above an impedance plane by using the multiple scat-tering technique and method of images. For a line source over an impedance ground the acoustic wave field is approximated by [21]
p0(r) =H0(1)(kr0) +Q0H0(1)(kr′0), (15)
whereQ0is the spherical wave reflection coefficient described below by
500 1000 1500 2000 2500 3000 3500 4000 4500 −10 0 10 20 30 40 50 data BEM semi−analytical results In se rt io n L os s (d B ) Frequency ω 2π Hz (a)
500 1000 1500 2000 2500 3000 3500 4000 4500
−30 −20 −10 0 10 20 30 40 50 data BEM semi−analytical results In se rt io n L os s (d B ) Frequency ω 2π Hz (b)
500 1000 1500 2000 2500 3000 3500 4000 4500
−10 0 10 20 30 40 data BEM semi−analytical results In se rt io n L os s (d B ) Frequency ω 2π Hz
[image:18.612.126.516.129.403.2](c)
Figure 11: Measured (solid line), predicted with BEM (broken line) and pre-dicted with the Weyl–Van der Pol formula (dash-dot line with open circles)
insertion loss spectra for a square 7×3 array of rigid cylinders of
diame-ter 0.055 m over finite impedance ground with source coordinates (0,0.235) and receiver coordinates (a) (1.203,0.117) m, (b) (1.203,0.235) m and (c) (1.203,0.352) m.
By the analogy with the source over the ground the scattered wave field for the array of circular scatterers can be written as
ps(r) = M
X
m=1
+∞
X
n=−∞
AmnZnmhHn(1)(krm)einθm+QmHn(1)(krm′ )e−inθ
′
m i
. (16)
The spherical wave reflection coefficientQm, m= 0..M, is given by
where
Vm=
cosαm−β
cosαm+β
(18a)
wm=
r
ikr′
m
2 (cosαm+β) (18b)
F(wm) = 1 +i√πwmexp −w2m
erfc(−iwm) (18c)
within whichαm is the angle of incidence defined by either position of the
source or centre of the scatterer [21].
In Figure 11 predictions based on (a) BEM and (b) the semi-analytical approach described by equations (4) and (15)-(18) are compared with the
measured insertion loss for 7×3 array of rigid scatterers over the impedance
ground with the parameters identical to those used for Figure 10. Figure 11(a) shows that semi-analytical results using (15)-(18) are in good agree-ment with the data if the receiver is close to the ground. However, when the receiver is at heights of 0.235 m and 0.352 m, the semi-analytical approach predicts a peak and dip in the IL above 4000 Hz and a dip near 2500 Hz respectively that are not observed in the data or in the BEM predictions (see Figures 11(b) and 11(c)). It may be concluded that the accuracy of the heuristic semi-analytical solution (equations (15)-(18)) decreases as the receiver height increases.
5
Concluding remarks
IL spectra due to finite cylinder arrays over impedance ground has been compared with an alternative semi-analytical approach based on the Weyl– Van der Pol formula. The results show that heuristic approximation of the influence of the impedance ground in the semi-analytical approach becomes worse as receiver height is increased.
Acknowledgment
This work was supported by the UK Engineering and Physical Sciences Research Council (grants EP/E063136/1 and EP/E062806/1) and by MEC (Spanish Government) and FEDER funds, under Grant No. MAT2009-09438. Authors are also grateful to reviewers and editor for their valuable comments.
Appendix A: Graf ’s addition theorem
R
mpr
mr
pθ
mα
mp [image:20.612.224.388.368.451.2]θ
pFigure 12: Geometry for Graf’s addition theorem.
In this section Graf’s addition theorem is modified so that it can be
applied to the solution of the reflected scattered field ps,r in equation (4).
First the addition theorem is stated for the solution of the direct scattered fieldps,d, yielding
Hn(1)(krp)einθp =
∞
X
q=−∞
Jq(krm)Hn(1)−q(kRmp)ei(n−q)(π+αmp)eiqθp, (19)
forrm <Rmp, m∈Z. The outlined form of the additional theorem is based
on the configuration shown in Figure 12. To adapt theorem (19) to solution
Using the relationH−(1)n(z) =einπHn(1)(z) the addition theorem is written as
Hn(1)(krp)e−inθp =
∞
X
q=−∞
Jq(krm)Hn(1)+q(kRmp)e−i(n+q)αmp+inπeiqθp, (20)
The latter can be used in equation (4) to transform image solution to that defined by the variables of the real scatterer.
References
[1] C.M. Linton and D.V. Evans, “The interaction of waves with arrays of
vertical circular cylinders”, Journal of Fluid Mechanics, 215, 549–569
(1990).
[2] O. Umnova, K. Attenborough and C.M. Linton, “Effects of porous cov-ering on sound attenuation by periodic arrays of cylinders”, The Journal
of the Acoustical Society of America, 119, 278–284 (2006).
[3] P. Boulanger, K. Attenborough, Q. Qin and C.M. Linton, “Reflection of sound from random distributions of semi-cylinders on a hard plane:
models and data”, Journal of Physics D: Applied Physics, 38, 3480–
3490 (2005).
[4] K.M. Li, W.K. Lui and G.H. Frommer, “The diffraction of sound by an impedance sphere in the vicinity of a ground surface”, The Journal of
the Acoustical Society of America, 115, 42–56 (2004).
[5] R. Borghi, F. Gori, M. Santarsiero, F. Frezza and G. Schettini, “Plane-wave scattering by a set of perfectly conducting circular cylinders in the presence of a plane surface”, Journal of the Optical Society of America
A, 13, 2441–2452 (1996).
[6] S.N. Chandler-Wilde, “Ground Effects in environmental sound propa-gation”, PhD thesis, University of Bradford, 1988, p. 67.
[7] D.H. Crombie and D.C. Hothersall, “The performance of multiple noise
barriers”, Journal of Sound and Vibration, 176, 459–473 (1994).
[8] D.H. Crombie, D.C. Hothersall and S.N. Chandler-Wilde,
“Multiple-Edge Noise Barriers”, Applied Acoustics, 44, 353–367 (1995).
[9] F. Zaviska, “The deflection of electro magnetic waves on parallel,
[10] A. Krynkin, O. Umnova, A.Y.B. Chong, S. Taherzadeh, and K. At-tenborough, “Predictions and measurements of sound transmission through a periodic array of elastic shells in air”, Journal of the
Acous-tical Society of America, 128, 3496–3506 (2010).
[11] A. Krynkin, O. Umnova, “On performance of Sonic Crystals in presence of ground plane”, Proceedings of Inter-noise, Lisbon, 2010.
[12] A. Krynkin, O. Umnova, “The effect of ground on performance of Sonic Crystal Noise barriers”, Proceedings of Euronoise, Edinburgh, 2009.
[13] M. Abramowitz and I.A. Stegun,Handbook of Mathematical Functions,
National Bureau of Standards, Washington, 1964, p. 255.
[14] P.A. Martin,Multiple Scattering: Interaction of Time-Harmonic Waves
with N Obstacles, Cambridge University Press, Cambridge, 2006, p. 39.
[15] J.D. Kaplunov, L.Yu. Kossovich and E.V. Nolde, Dynamics of thin
walled elastic bodies, Academic Press, London, 1998, p.110.
[16] R.F. Millar, “Scattering by a grating”, Canadian Journal of Physics,
39, 81–103 (1998).
[17] M.E. Delany and E.N. Bazley, “Acoustical properties of fibrous
ab-sorbent materials”, Applied Acoustics, 3, 105–116 (1970).
[18] Y. Miki, “Acoustical properties of porous materials - modifications of Delany-Bazley models”, Journal of the Acoustical Society of Japan (E),
11, 19–24 (1990).
[19] K. Attenborough, K.M. Li and K. Horoshenkov, Predicting Outdoor
Sound, Taylor & Francis, London, 2007, p. 41.
[20] S. Hasheminejad and M. Azarpeyvand, “Modal vibrations of an infinite cylinder in an acoustic half-space”, International Journal of Engineering
Science, 41, 2253–2271 (2003).
[21] W.K. Lui and K.M. Li, “The scattering of sound by a long cylinder above an impedance boundary”, Journal of the Acoustical Society of
America, 127, 664–674 (2010).
[23] S. Taherzadeh and K. Attenborough, “Deduction of ground impedance from measurements of excess attenuation spectra”, The Journal of the