Unsupervised Content Classification Based Nonrigid
Registration of Differently Stained Histology Images
Y. Song, D. Treanor, A. J. Bulpitt, N. Wijayathunga, N. Roberts, R. Wilcox, and D. R. Magee
∗Abstract—Registration of histopathology images of consecutive tissue sections stained with different histochemical or immunohis-tochemical stains is an important step in a number of application areas, such as the investigation of the pathology of a disease, vali-dation of MRI sequences against tissue images, multiscale physical modeling, etc. In each case, information from each stain needs to be spatially aligned and combined to ascertain physical or functional properties of the tissue. However, in addition to the gigabyte-size images and nonrigid distortions present in the tissue, a major chal-lenge for registering differently stained histology image pairs is the dissimilar structural appearance due to different stains high-lighting different substances in tissues. In this paper, we address this challenge by developing an unsupervised content classification method that generates multichannel probability images from a roughly aligned image pair. Each channel corresponds to one auto-matically identified content class. The probability images enhance the structural similarity between image pairs. By integrating the classification method into a multiresolution-block-matching-based nonrigid registration scheme (N. Roberts, D. Magee, Y. Song, K. Brabazon, M. Shires, D. Crellin, N. Orsi, P. Quirke, and D. Treanor, “Toward routine use of 3D histopathology as a research tool,”Amer. J. Pathology, vol. 180, no. 5, 2012.), we improve the performance of registering multistained histology images. Evaluation was con-ducted on 77 histological image pairs taken from three liver spec-imens and one intervertebral disc specimen. In total, six types of histochemical stains were tested. We evaluated our method against the same registration method implemented without applying the classification algorithm (intensity-based registration) and the state-of-the-art mutual information based registration. Superior results are obtained with the proposed method.
Index Terms—Computerized diagnosis, digital pathology, histol-ogy registration, image analysis, multistains, mutual information, virtual slides.
Manuscript received April 9, 2013; revised June 14, 2013; accepted August 5, 2013. Date of publication August 8, 2013; date of current version Decem-ber 16, 2013. This work was supported by WELMEC, Center of Excellence in Medical Engineering funded by Wellcome Trust and EPSRC under Grant WT088908/Z/09/Z.Asterisk indicates corresponding author.
Y. Song was with the School of Computing, University of Leeds, Leeds, LS2 9JT, U.K. He is now with the Centre for Medical Image Computing, University College London, London, WC1E 6BT, U.K. (e-mail: yi.song@ ucl.ac.uk).
D. Treanor is with the Leeds Institute of Molecular Medicine, University of Leeds, Leeds, LS2 9JT, U.K., and also with Leeds Teaching Hospitals NHS Trust, Leeds, LS9 7TF, U.K. (e-mail: darrentreanor@nhs.net).
A. J. Bulpitt is with the School of Computing, University of Leeds, Leeds, LS2 9JT, U.K. (e-mail: a.j.bulpitt@leeds.ac.uk).
N. Wijayathunga and R. Wilcox are with the School of Mechani-cal Engineering, University of Leeds, Leeds, LS2 9JT, U.K. (e-mail: V.N.Wijayathunga@leeds.ac.uk; R.K.Wilcox@leeds.ac.uk).
N. Roberts is with the Leeds Institute of Molecular Medicine, University of Leeds, Leeds, LS2 9JT, U.K. (e-mail: N.J.Roberts@leeds.ac.uk).
∗D. R. Magee is with the School of Computing, University of Leeds, Leeds, LS2 9JT, U.K. (e-mail: d.r.magee@leeds.ac.uk).
Color versions of one or more of the figures in this paper are available online at http://ieeexplore.ieee.org.
Digital Object Identifier 10.1109/TBME.2013.2277777
I. INTRODUCTION
T
HE histological examination of adjacent tissue sections prepared with different stains or biomarkers (e.g., histo-chemical, immunohistohisto-chemical, and special stains) can pro-vide valuable information to aid understanding of the physical or functional properties of tissue [1]. For example, liver cirrho-sis is characterized by dense fibrous scars traversing the tissue and dividing it into nodules. The hematoxylin and eosin (H&E) stain (the most common histological stain) enables cell nuclei and cytoplasm to be identified. The Sirius Red, reticulin, and Masson trichrome stains highlight the fibrous scarring by stain-ing different histochemical components of the scar tissue (Col-lagen subtypes). Combining multiple stain modalities allows a complete picture of the relationship between the causative liver disease and the resulting scarring to be built up. In addi-tion to its utility in medical diagnosis, histological examinaaddi-tion of differently stained tissue sections has seen increasing usage in biomedical engineering [2]. In this domain, one of the ob-jectives of our work is to help build multiscale physics based models of the intervertebral disc. The Alcian blue stain can characterize proteoglycan-rich extra cellular matrix as a blue color—a component necessary for maintaining spinal flexibil-ity under different loading scenarios, whereas the Elastic Picro Sirius Red (EPSR) stain shows collagen-rich structural areas within and at the periphery of the disc. Combining this infor-mation allows an improved understanding of the biomechanical behavior of the disc, leading to better numerical evaluation of treatment methodologies [3].Traditionally, pathologists and researchers view glass mi-croscopy slides serially with a microscope and combine the in-formation mentally to derive an opinion or diagnosis. Although this works for global assessment of tissue sections, detailed as-sessment and measurement requires more detailed side-by-side comparison. However, due to the nature of the slide prepara-tion and the fact that different stains characterize different sub-stances, the tissue sections do not have the same morphology, appearance, or spatial alignment, making it a nontrivial task to even find the same region on adjacent slides. The introduction of digital pathology (scanning tissue sections and digitizing them into images) allows the development of automatic computer-aided registration algorithms [4]–[10] to assist pathologists and researchers quantitatively analyzing the spatial co-occurrence of structural and functional elements in different modalities.
Our study on multistain histology image registration is moti-vated by the research demands of both medical research (liver disease) and biomedical engineering (intervertebral disc) appli-cations. The common interest is to spatially align differently stained adjacent tissue sections for information integration. The
Fig. 1. Dissimilar appearance between differently stained adjacent sections. Slides are viewed at 1.25×magnification. Adjacent liver sections are stained with H&E (left) and Sirius Red (right).
experiments in this paper cover various stain types including H&E, Sirius Red, Alcian blue, EPSR, CK7, and FAST. Al-though discussions are mainly based on liver and intervertebral disc specimens, the proposed method makes no assumption of the existence of particular anatomic structures and could be ap-plied to any similarly produced histological sections. The main challenges for registering histology images with different stains are:
1) Dissimilar appearances: Different stains highlight differ-ent substances in tissues. Consequdiffer-ently, the same tissue structures on adjacent tissue sections often appear very different. For example, the H&E stain allows cell nuclei and cytoplasm to be identified at high magnifications, e.g., 20×. However, as shown in Fig. 1 left, the content at low magnification (1.25×) appears as a rather uniform tex-ture of cellular components. On the other hand, at the same magnification, the fibrous tissue (e.g., scarring of liver tissue) in an adjacent section is clearly selectively highlighted by the Sirius Red stain (see Fig. 1 right). 2) Nonrigid distortions: Introduced by slice preparation, such
as bending, shearing, stretching and tearing, etc. At micron resolutions, even minor deformations appear conspicuous. 3) The large size of digital microscopy images. For example, one uncompressed three-channel, 8-bit digital microscopy image of an intervertebral disc at 40×magnification used in our study has file size∼20 GB.
4) The image pair is not the exact same piece of tissue. They are usually at best serial sections 5μm apart.
In this paper, we address these challenges with:
1) A multiresolution-block-matching-based nonrigid regis-tration scheme, which aims to tackle the large image size and nonrigid distortion.
2) A novel two-dimensional (2-D) unsupervised content clas-sification method (the main contribution of this paper, detailed discussion in Section II). The objective of this method is to enhance the structural similarity between the differently stained image pairs. The output from the al-gorithm is multichannel probability images (the default is three-channel in this paper). Each channel corresponds to an emergent appearance (content) class that may or
may not map to a single anatomical tissue type [see Fig. 2(c)–(e)].
Our multiresolution-block-matching-based registration sche-me has been presented in our previous work on registering con-secutive histological sections stained with the same stain [9]. For the multistained case presented in this paper, we extend this scheme to register the multichannel probability images obtained from the unsupervised content classification method presented in this paper (see Figs. 3 and 4).
A. Related Work
There are a limited number of previous studies related to the registration of microscopy data with different stains that largely concentrate on specific feature matching. For example, Can et al. [4] rigidly registered bright field and fluorescent microscopy images by extracting a nuclear image from each modality, and Cooperet al. [5] extracted features based on color that are matched and combined by fitting a polynomial trans-form. Earlier, Cooperet al. [6] presented a more general frame-work for nonrigid registration that involved detecting anatomic features based on high local pixel variance and using normalized cross-correlation to match these at specific locations within the image. However, for some tissue specimens, anatomic features such as blood vessels, etc., are distributed sparsely across the image, giving rise to insufficient information for calculating a precise deformation field for nonrigid registration. There are also intensity based approaches. The mutual information maxi-mization based method, which is widely adopted for registration of multimodal radiology images [18], has been extended to reg-ister differently stained histology images where they exhibit a certain structural similarity [7], [15]. However, such similarity is not necessarily guaranteed for some differently stained pairs, as exemplified in Fig. 1. Therefore, in this paper, we propose an unsupervised content classification method to enhance the struc-tural similarity between image pairs that consequently improves the registration accuracy.
[image:2.595.40.289.91.223.2]Fig. 2. (a) Images of two adjacent liver tissue sections stained by H&E (reference image) and Sirius Red (floating image) separately. The pair has been aligned using the transformation estimated at resolution 1.25×. (b) The subimages marked in (a) at resolution 2.5×. (c–e) Three channel probability images obtained by applying the 2-D unsupervised tissue classification method on the subimages. Each channel corresponds to one appearance (content) class emerging from the subimages.
Fig. 3. Registration of multichannel probability blocks by calculating displacement vectors. We use the central blocks highlighted in Fig. 2(c)–(e) to demonstrate. (a1–c1) are reference blocks, (a2–c2) are floating blocks, and (a3–c3) are the transformed floating blocks (images are enlarged for clarity). (d) The registration of the floating block is represented by 5×nvectors (i.e., displacement vectors) for anchannel probability image(n=3 in this figure).
[image:3.595.82.517.500.724.2]than that often used in block matching in the literature. The advantage of this is that a greater amount of detail can be used in the registration process, increasing robustness. The disadvan-tage of using larger blocks is that a sparser set of displacement vectors is produced. However, our use of five vectors per block (thus taking into account block rotation; see Fig. 3), 50% block overlapping, and B-spline approximation alleviate this to an extent.
There is a rich literature on employing unsupervised clas-sification algorithms (e.g., clustering) for applications such as gene expression analysis [23], data mining [24], information retrieval [25], image segmentation [26], etc. However, unlike previous works that process images individually, our method processes image pairs simultaneously to capture the statistically significant structures shared by both images. This approach has not been seen in the literature to the best of our knowledge.
The rest of this paper is organized as follows: An overview of our registration implementation integrated with the 2-D unsu-pervised content classification method is presented in Section II. In Section III, we present the classification algorithm in five steps: (A) appearance feature selection and generating feature vector sets; (B) clustering the appearance feature vector set of each image; (C) partitioning the obtained two sets of clusters into content classes common to both images; (D) iteratively refin-ing the emergent content classes by introducrefin-ing spatial features; (E) generating probability images based on the refined content classes. The datasets and experimental results are described in Section IV. Conclusions are made in Section V.
II. OVERVIEW ONREGISTRATIONIMPLEMENTATION
Our registration implementation is based on a rigid block matching approach that we have previously presented for the same stain registration [9]. The novel extension here is generat-ing multiple channel probability images from images of differ-ent stains using an unsupervised contdiffer-ent classification method to increase the similarity of the two images (see Section III). The sequence of processes is as follows.
1) Transform each image into a multichannel probability im-age, where the individual channels of each image corre-spond (see Section III).
2) Perform block matching based registration for each proba-bility channel separately (see Fig. 3(a)–(c), the rigid trans-form of the block is estimated by using phase correlation, a combination of [11] and [12] to recover rotation and translation).
3) Represent the rigid transform of each block by five vec-tors [located at the four corners and center of the block, Fig 3(d)]. The results from different channels are com-bined into a displacement vector set.
4) Compute a single approximating nonrigid transform (cu-bic B-spline) from the displacement vector set (see Fig. 4) by using a regularized least squares difference minimizing method (see [9] for details).
The approach is applied in a multiscale manner from coarse to fine. In addition, except for the initialization (which is performed by rigidly registering whole grayscale images at the coarsest
res-TABLE I NOTATION
olution), the registration problem is decomposed into numerous small block matching problems. So we bypass the infeasible practice of directly handling gigabyte images.
III. UNSUPERVISEDCONTENTCLASSIFICATION
In this section, we present our novel 2-D unsupervised content classification method, which generates multichannel probability images from a roughly aligned image pair. The purpose of this method is to increase the structural similarity of the two im-ages and thus increase registration performance. Each derived probability channel corresponds to an emergent “content class” [see Fig. 2(c)–(e)], where a pixel value in a specified channel image is the probability that it belongs to the corresponding con-tent class. It should be noted that the automatically identified content classes do not necessarily map to real anatomical tissue classes as they are solely emergent from co-occurrence statistics between image pairs. The key idea is that we capture the sta-tistically significant structures common in images, by studying two images simultaneously.
Without loss of generality, we explain the proposed classifica-tion method based on images at levelXi(which have previously been registered at lower resolution levelXi+1) in the following context. Since it is impracticable to directly classify a whole image when the images are very large, we divide the image pair into a set of subimages and apply the proposed content classifi-cation algorithm on each subimage pair separately. This also has the advantage of being more robust to color variations over the images. The multiresolution registration scheme ensures similar tissue regions are present in the corresponding subimage pairs. The size of subimages is balanced between being big enough to be representative, but small enough to allow for stain varia-tion. We have used subimages sized 1024×1024 pixels in our experiments. Notation used in the following discussion is listed in Table I. The five-step unsupervised classification algorithm is outlined in algorithm I. In step D of the algorithm, spatial loca-tion features are introduced as complementary to the appearance features. This overcomes the problem where the appearance fea-tures alone (for some stains) are not sufficient to separate certain regions on an image that have similar appearance, but belong to different content classes.
A. Appearance Feature Vector Sets(URandUF)Generation
Each pixel is represented as a feature vector. These form the feature vector set used to derive content classes based on co-occurrence statistics. To tackle the various stains and tissue types used in our study, we include a step to automatically select appearance features for each type of image from a feature pool consisting of color, intensity and texture information. This feature selection process is performed only once for each type of image pair.
The feature pool is as follows:
1) Each RGB color channel of the original image and Gaus-sian smoothed images. The GausGaus-sian kernels are: 7×7 (σ=3), 15×15(σ=5).
2) A texture descriptor based on grayscale images defined in (1) and (2). The kernel sizes(w×h)used are: 15×15, 30×30. The grayscale image is obtained by averaging RGB color channels.
The texture representation (2) is a one-dimensional feature that is the root squared sum of the difference operators (1) in directions (1,0), (0,1), (1,1)
I(w ,h,dx,dy)(x, y)
= 1 (w×h)
w /2
Δy=−w /2 h/2
Δx=−h/2
I(x+Δx, y+Δy)
−I(x+Δx+dx, y+Δy+dy)
(1)
I(w ,h)∗ (x, y)
=I2
(w ,h,1,0)(x, y) +I(w ,h,0,1)2 (x, y) +I(w ,h,1,1)2 (x, y). (2) It should be noted the features listed in the pool could be potentially replaced by other more complicated features if these prove insufficient for a particular image type. However, these features have proved sufficient for the images studied in this pa-per. The rationale for using these simple appearance features in our study is based on two criteria: 1) low computational cost and 2) we are interested in co-occurrence statistics common between the image pairs, rather than trying to extract specified texture information from a single image to identify a particular tissue type, as proposed in [19], which differentiates the cancerous glands from normal glands by knowing that normal glands tend to be strongly oriented in a particular direction and cancerous glands not.
From the feature pool, the best set of features for each type of image pair is selected by maximizing (3) (Section III-C) over all feature subsets. A greedy search method (as exhaustive search is prohibitively expensive) is used to explore subsets of feature combinations. In Table III, we list the selected features.
From this point forward, we assume the appearance features have been determined for the image pairIR, IF by this method. For every pixel (x,y) inIR, a feature vectoruR(x,y) is com-puted, which forms the feature vector set UR. Similarly, the feature vector setUF is computed forIF.
B. Clustering Appearance Feature Vector Sets
A clustering algorithm is applied to the appearance feature vector sets UR, UF to obtainNR, NF clusters and the corre-sponding cluster-label imagesIC
R, IFC, respectively. We propose a principal eigenvector binary tree clustering algorithm that cre-ates a binary tree structure for a feature vector set and uses the leaf associated index as cluster labels. Take the feature vector setURfor instance, the root of the tree consists of a single clus-ter containing all elements ofUR. Principle component analysis (PCA) is applied at each level of the tree, and the elements are partitioned into two children by thresholding their projections onto the first principle component at zero (the mean). This pro-cess results inNRclusters. Each cluster corresponds to a leaf of the tree. The same clustering algorithm is applied to the feature vector setUF to getNF clusters.
It should be noted that the main objective of the proposed clustering method is to guarantee the maximal separation of pixels belonging to different content categories even under sim-ilar appearance. For example, the intervertebral image stained with Alcian blue, etc., in Fig. 4 has only a very subtle difference between the light blue tissue and the white background. An-other aim of developing this clustering method is computational efficiency (provided by the tree structure).
Denoting the labels of theNR clusters as{cRi}and the la-bels of the NF clusters as {cF j}, we obtain a cluster-label image IC
R corresponding to the reference image IR, where IC
R (x, y) =CR(uR(x, y)) =cRi.CR(.) is the mapping func-tion output from the principal eigenvector binary tree cluster-ing algorithm for image IR. Similarly, a cluster-label image IFC corresponding to the floating imageIF is obtained, where IC
F (x, y) =CF(uF (x, y)) =cF j.
C. Partitioning of Clusters into Content Classes
The objective of this step is to partition the obtainedNR, NF clusters from the two images into NT common groups (NT “content classes”).2This is in keeping with our aim to increase
the similarity of the representation of the image pair. Denoting the labels of theNT classes as{ti}. Letφ(n)be a hypothesized partition scheme of cluster-label imageIC
R, which gives content-label image IT
R(x, y) =φ(n)(IRC(x, y)) =ti; and ψ(m) a hy-pothesized partition scheme of IC
F, which gives content-label
2In our implementation, the default number of content classes is three. If havingNT >3, some content classes may contain very few pixels and their
Fig. 5. Process of partitioning clusters: partitioning each set of six clusters into three content classes(t1, t2, t3). Each line betweenφ(n)andψ(m)represents a hypothesized partition scheme, i.e., a combination for which mutual information is calculated.
imageIT
F(x, y) =ψ(m)(IFC(x, y)) =tj. The “optimal” content classes are determined by the (nth,mth) hypothesized partitions that maximize mutual information betweenφ(n)(IC
R(x, y))and ψ(m)(IC
F(x, y)), as described by (3). Fig. 5 is a simplified ex-ample demonstrating hypothesized schemes of partitioning six clusters into three groups (aka. content classest1, t2, t3)
n, m∗= arg max n,m(MI(φ
(n)(
IRC);ψ(m)(IFC))) (3)
As the complexity of an exhaustive search of NT classes partitions isO(Nmin(NR,NF)
T ), which is prohibitively computa-tionally expensive, we approximate theNT class problem using the principle of alpha-expansion [20] and conduct exhaustive searches of binary assignments for each class. In this search we consider the binary problems of assigning a cluster to a particular class, or it retaining its original assignment. Search is initialized by assigning all clusters of the reference image to a single class, and iteratively repeating the binary searches until convergence. The complexity is therefore reduced toONT ∗2min(NR,NF).
D. Iteratively Refining Content Classes by Introducing Spatial Features
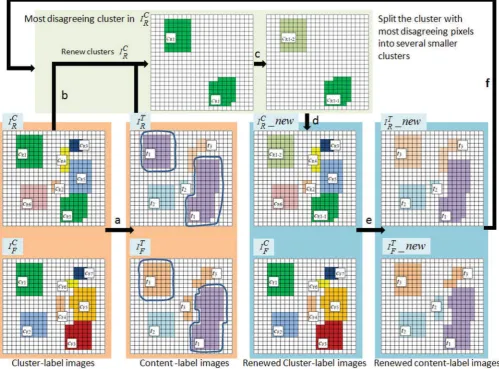
In this step, we iteratively refine the derived content classes based on spatial features. Due to the fact that the appearance features are sometimes not sufficient to distinguish pixels of different content categories, those pixels could be wrongly clus-tered into one cluster. This consequently affects the result of the partition, as exemplified in Fig. 6. Comparing the cluster-label imagesIC
R andIFC, the pixels belonging to two clusterscF1and cF3 inIFC are clustered into a single clustercR1 inIRC, which results in the number of pixels belonging to the emergent con-tent classt1inIRT andIFT being significantly different (enclosed by blue curves). We overcome this by introducing spatial in-formation to enforce the separation of wrongly clustered pixels, e.g., dividing the clustercR1inIC
R into several smaller, spatially separate clusters, as shown in Fig. 6 (steps b and c).
We define “conflicting pixels” as pixels labeled as ti inIT R but labeled astj (i=j)inIT
F, at the corresponding locations. The cluster containing the largest number of conflicting pixels in the cluster-label imageIRC or IFC is identified, as described in (4). To distinguish it from other cluster labels, we name it asc∗. For clarity, in the following discussions we useIC
R as an example
c∗=argmax
{cR i}
⎛
⎝
x,y∈IC R
1
, ifIC
R(x, y)=cRiandIRT (x, y)=IFT (x, y)
0, otherwise
⎞ ⎠.
(4)
Next, for every pixelIC
R(x, y) =c∗, a spatial feature vector sRi= [x, y]is created, which constitutes a spatial feature vec-tor setSR. By applying the principal eigenvector - binary tree clustering method (discussed in Section III-B) toSR, the clus-terc∗is split into a set of smaller clusters{ri}. Consequently, the cluster-label imageIC
R is updated by replacing labelc∗with {ri}. Fig. 6(c) demonstrates a synthetic example in which the clustercR1inIC
R is split into two new clusterscR1−1andcR1−2. The pixels previously labeled as cR1 are replaced by the new labels.
Using the renewed cluster-label image IC
R, as shown in Fig. 6(d), the content classes are recalculated using (3) (Section III-C). Consequently, we have the refined content-label images IT
R, IFT, as shown in Fig. 6(e). This refinement process is re-peated until the number of “conflicting pixels” in any cluster is about 1% of the total number of pixels (typically ten itera-tions). This threshold is based on the fact that we expect the following errors: 1) the anatomical structures on adjacent tissue sections are similar but not identical and 2) misalignment exists between adjacent tissue sections at levelXi. The resultant par-tition scheme after the refinement is denoted asφ, ψforIC
Fig. 6. Synthetic example of partitioning clusters into content classes (see Section III-C) and the following refinement process (see Section III-D). (a) Finding the best partition schemeφ(n), ψ(m) that maps cluster-label imagesIC
R, IFC to content-label imagesIRT, IFT by maximizing mutual information, (b) identifying
the cluster containing the largest number of conflicting pixels, (c) dividing the identified cluster from (b) into several smaller clusters using spatial information, (d) renewing the cluster-label imageIC
R with the results of (c), and (e) finding the new optimal partition schemeφ(n), ψ(m)and renewing content-label images IT
R, IFT.
E. Generation of Probability Images
We convert the refined classification result into probability images that provide a continuous image representation that can be used within our image registration framework. First, we calculate the normalized joint probability density matrix PIC
R =a, IFC =b
, a∈ {cRi}, b∈ {cF j}. For each emer-gent content classtm, we generate a pair of probability images IR,tP m, I
P
F ,tm for the input image pair, described as follows:
IR,tP m (x, y) =
NF
j=1
PIC R, IFC
, ifψIC F
=tm
0, otherwise (5)
IF ,tP m (x, y) =
NR
i=1
PIC R, IFC
, ifφIC R
=tm
0, otherwise . (6)
Taking Fig. 6 as an example, pixels in the content-label image IT
R which identified as thet3 class are assigned the probability value calculated from (5); pixels that do not belong tot3classes, are assigned zero probability.
Fig. 2(c)–(e) shows an example of a set of calculated mul-tichannel probability images. The image pair (taken from the liver#1 specimen) is stained by H&E and Sirius red stains, re-spectively.
IV. EVALUATION
A. Materials
[image:7.595.50.294.648.717.2]TABLE II SPECIMENS
final image resolution of 0.46 or 0.23μm per pixel. A summary of the datasets is given in Table II. Figs. 7 and Fig. 8 show the examples of the image pairs and their manual annotations. Local NHS research ethical approval was obtained for use of the human tissue. The ovine disc (vertebra specimen) was harvested from a mature (7–8 years old) spine released by the Official Veterinarian of the local abattoir, subsequent to the approval of the application made to the area Veterinary Manager at the Food Standards Agency.
Among 77 image pairs, we include some images with artefacts that are often introduced during the preparation of histopathol-ogy images, such as:
1) Luminance gradient: Sections mounted close to the edge of the glass slide produce images with significant lumi-nance gradients (e.g., in Fig. 7, liver#3 section stained with CK7).
2) Nontissue noise: Dust and air bubbles in the slide (see Fig. 8).
3) Staining variations: Differences in section thickness, staining duration, and stain concentration result in color variations (e.g., in Fig. 7, liver#3 section stained with H&E).
B. Evaluation Design
The goal of developing our 2-D content classification method is to improve registration accuracy by using probability im-ages that enhance the structural similarity between image pairs. Therefore, to evaluate the content classification method, we use registration performance as a criterion, which is measured by the Hausdorff distances (μm) between manually annotated corre-sponding regions (boundaries) on image pairs after registration. The corresponding regions were annotated by the first author and reviewed for approval by a consultant pathologist using the Aperio ImageScope slide-viewing software on the original virtual slide image.
Multiresolution registration (see Section II) is applied with 3 or 4 levels such that image size at the lowest resolution is clos-est to 1 K×1 K and the “final” level of the registration resolution is closest to 4μm/pixel. The resulting transformations are then
applied to the full-resolution images (and thus to those manual annotations on the images) to calculate the Hausdorff distances (μm) between the corresponding annotations for evaluation.
The size of blocks for matching is a constant 256×256 (pix-els) for each scale and blocks are 50% overlapping. This gave the best results in our previous study [9].
By covering a wide range of stain types and two very differ-ent types of tissues, our experimdiffer-ents try to reflect the fact that our content classification method makes no assumptions about either anatomic structures or stain types. Moreover, there is no other preprocessing required except conducting automatic ap-pearance features selection once for each pairwise image type. Our evaluation consists of four experiments:
1) The application of automatic appearance feature selection, given in Section IV-C.
2) In Section IV-D, we compare registration performance between using content classification (CC) and not using content classification (NC), i.e., intensity based registra-tion. The data groups 1–6 (28 image pairs in total, each having 20–30 manual annotations, as shown Fig. 7) are used in this evaluation.
3) In Section IV-E, we compare our content classification based registration against the state-of-the-art mutual in-formation based registration [7]. The data groups 1–6 are used in this evaluation.
4) In Section IV-F, we evaluate the influence of sectioning distance between the stained sections on our classification method. Dataset 7 (49 image pairs, with manual annota-tions of the four artificial holes, as shown Fig. 8) is used in this evaluation.
C. Experiment 1: Feature Selection
Fig. 7. Examples of image pairs and their manual annotations. From top to the bottom, they are sections taken from liver#1 (H&E/Sirius Red), liver#2 (H&E/Sirius Red), liver#3 (CK7/H&E), intervertebra disc (EPSR/Alcian blue), intervertebra disc (Alcian blue/FAST), intervertebra disc (FAST/EPSR). Three liver specimens are viewed at 0.5×magnification. Sections of vertebra discs are viewed at 0.6×magnification. Manual annotations used in the evaluation are superimposed on the images.
[image:9.595.323.542.337.519.2]Fig. 8. Data group 7, four artificial vertical holes were manually annotated (in green).
Fig. 9. Boxplot of the registration accuracy of consecutive tissue sections stained by H&E/Sirius Red (data group 1). In total, six image pairs of the liver#1 specimen. The registration performance is compared between registra-tions using content classification (CC) and not using content classification (NC), i.e., intensity-based registration.
Fig. 10. Boxplot of the registration accuracy of consecutive tissue sections stained by H&E/Sirius Red (data group 2). In total, five image pairs of the liver#2 specimen.
the images with little difference in the final registration perfor-mance. Generally, the features selected from the center are more representative, and are adopted in the following experiments.
[image:9.595.71.266.646.742.2]TABLE III
[image:10.595.50.298.112.459.2]SELECTEDFEATURES FOR THEFINALREGISTRATIONLEVEL
Fig. 11. Boxplot of the registration accuracy of consecutive tissue sections stained by H&E/CK7 (data group 3). In total, seven image pairs of the liver#3 specimen.
The feature selection process was also applied on other data groups covering various stains: H&E/DAB, Alcian blue /EPSR, Alcian blue /FAST and FAST/EPSR. The selected features sets of the “final” level of registration resolution are exemplified in Table III.
D. Experiment 2: Registration Performance
As mentioned in Section IV-B, we use registration per-formance as a criterion to evaluate the content classification method. We compared the registration accuracy between using no content classification (NC), and the registration process using the content classification (CC). We report registration results for 28 histology image pairs (data groups 1–6), evaluated by mea-suring the Hausdorff distances (μm) between the corresponding annotations (transformed by the registration result at full reso-lutionX0). There are 20–30 corresponding regions (see Fig. 7) manually annotated on each image.
[image:10.595.310.536.114.461.2]Figs. 9–14 show that there is improvement in registration ac-curacy using the content classification (CC), when compared to the registration process without using content classification (NC). In Fig. 15 visualizes the boundary smoothness of an
Fig. 12. Boxplot of the registration accuracy of consecutive tissue sections stained by Alcian blue/EPSR (data group 4). In total, five image pairs of the intervertebral disc specimens.
anatomical structure (blood vessel), and illustrates that CC based registration can achieve better accuracy than NC based registra-tion. A paired t-test was performed and a statistically significant improvement in error was detected for CC over NC for all data sets, as listed in Table IV.
E. Experiment 3: Content Classification Based Registration Versus Mutual Information-Based Registration
We compared our content classification based registration against to the state-of-the-art mutual information based regis-tration [7]. We replicate the implementation as described in [7], except:
1) Fifty bins are used in Mattes mutual information [21], instead of 32 bins. We have tested both 50 bins and 32 bins on the 28 datasets. The performance using 50 bins is better than, or similar to, that using 32 bins.
Fig. 13. Boxplot of the registration accuracy of consecutive tissue sections stained by Alcian blue/FAST (data group 5). In total, three image pairs of the intervertebral disc specimens.
Fig. 14. Boxplot of the registration accuracy of consecutive tissue sections stained by EPSR/FAST (data group 6). In total, three image pairs of the inter-vertebral disc specimens.
Performance of mutual information based registration is eval-uated on data groups 1–6 (28 image pairs), with the same mul-tiresolution levels applied as in Experiment 2. Comparative re-sults are summarized (groupwise) in Fig. 16. These show that our method slightly outperforms MI-based registration.
[image:11.595.308.557.460.649.2]Computational efficiency is also an important factor. We com-pare the two methods by execution time, at the specified image sizes and the number of multiresolution levels as listed in Ta-ble V. Results are summarized (groupwise) in Fig. 17. These show that MI based registration generally takes a significantly longer time than our method and has larger variance between the different image pairs from the same group. This can be ex-plained by the iterative nature of the MI algorithm, which has a stopping criteria based on convergence. All computations were carried out on a desktop computer with the following specifi-cations: Inteli7 dual core×3.07 GHz, 8 GB RAM, Windows 7. It should be noted that our method is not yet optimized for parallel computation.
Fig. 15. Checkerboard visualization (at magnification 10×) of the registration accuracy (liver images stained by H&E and Sirius Red). (a) Results of regis-tration done at the magnification of 2.5×, without applying classification (NC). (b) Results of applying content classification.
TABLE IV PAIREDt-TEST
TABLE V
[image:11.595.308.555.680.765.2]Fig. 16. Comparison of registration performances between content-classification-based method (CC) and a state-of-the-art MI-based method [7].
Fig. 17. Comparison of execution times between MI-based registration and content classification based registration (CC).
F. Experiment 4: The Influence of Sectioning Distance
The influence of sectioning distance between the differently stained sections on our classification method is of interest since we calculate co-occurrence statistics between image pairs. Large distances between sections (e.g., when the pair is not consecu-tive serial sections) may lead to noticeable variations in tissue structures between the image pairs, which could affect the cor-rectness of the classification.
It is not ideal to use the real anatomic structures as the ground truth to evaluate the influence of sectioning distance on the reg-istration accuracy, since there are natural variations between anatomical structures on different tissue sections. Data group 7 (see Table II and Fig. 8) was designed for this experiment as four artificial vertical holes were drilled before the speci-men was sectioned, and subsequently annotated (see Fig. 8). In total, 49 image pairs were evaluated, with 25 consecutive
sec-Fig. 18. Comparison between the registration accuracy of the consecutive image pairs (25 pairs, 100 annotations) and that of nonconsecutive image pairs (24 pairs, 96 annotations).
tions (section distance∼5μm), and 24 nonconsecutive sections (average section distance∼30μm). Fig. 18 shows that the dis-tance between sections can affect the registration accuracy that is decreased when the gap between image pairs increases. This experiment indicates the desirability of registering as closely spaced sections as possible.
V. CONCLUSION
[image:12.595.55.275.90.282.2] [image:12.595.56.274.323.526.2]REFERENCES
[1] M. B. Klevesath, L. G. Bobrow, S. E. Pinder, and A. D. Purushotham, “The value of immunohistochemistry in sentinel lymph node histopathol-ogy in breast cancer,”Brit. J. Cancer, vol. 92, pp. 2201–2205, 2005. [2] C. Derham, H. Yow, J. Ingram, J. Fisher, E. Ingham, S. A. Korrosis,
and S. Homer-Vanniasinkam, “Tissue engineering small-diameter vascular grafts: Preparation of a biocompatible porcine ureteric scaffold,”Tissue Eng. Part A, vol. 14, no. 11, pp. 1871–1882, Nov. 2008.
[3] V. Wijayathunga, A. Jones, R. Oakland, N. Furtado, R. Hall, and R. Wilcox, “Development of specimen-specific finite element models of human ver-tebrae for the analysis of vertebroplasty,” inProc. Institution Mech. Eng. Part H: J. Eng. Med., 2008, vol. 222, pp. 221–228.
[4] A. Can, M. Bello, H. E. Cline, X. Tao, F. Ginty, A. Sood, M. Gerdes, and M. Montalto, “Multi-modal imaging of histological tissue sections,” in
Proc. 5th IEEE Int. Symp. Biomed. Imag. Nano Macro, 2008, pp. 288– 291.
[5] L. Cooper, O. Sertel, J. Kong, G. Lozanski, K. Huang, and M. Gurcan, “Feature-based registration of histopathology images with different stains: An application for computerized follicular lymphoma prognosis,” Com-put. methods programs biomed., vol. 96, no. 3, pp. 182–92, 2009. [6] L. Cooper, S. Naidu, G. Leone, J. Saltz1, and K. Huang, “Registering high
resolution microscopic images with different histochemical stains—A tool for mapping gene expression with cellular structures,” inProc. Workshop Microscopic Image Anal. Appl. Biomed., 2007, pp. 1–7.
[7] D. Mueller, D. Vossen, and B. Hulsken, “Real-time deformable registration of multi-modal whole slides for digital pathology,”Comput. Med. Imag. Graph., vol. 35, no. 7–8, pp. 542–556, 2011.
[8] B. Ma, Z. Lin, S. Winkelbach, W. Lindenmaier, and K. Dittmar, “Au-tomatic registration of serial sections of mouse lymph node by using Image-Reg,”Micron, vol. 39, no. 4, pp. 387–396, 2008.
[9] N. Roberts, D. Magee, Y. Song, K. Brabazon, M. Shires, D. Crellin, N. Orsi, P. Quirke, and D. Treanor, “Toward routine use of 3D histopathol-ogy as a research tool,”Amer. J. Pathology, vol. 180, no. 5, pp. 1835–1842, 2012.
[10] A. Ruiz, M. Ujaldon, L. Cooper, and K. Huang, “Non-rigid registration for large sets of microscopic images on graphics processors,”J. Signal Proc. Syst., vol. 55, no. 1, pp. 229–250, 2009.
[11] C. Kuglin and D. Hines, “The phase correlation image alignment method,” inProc. Int. Conf. Cybern. Soc., 1975, pp. 163–165.
[12] D. Casasent and D. Psaltis, “Position, rotation, and scale invariant optical correlation,”Appl. Opt., vol. 15, no. 7, pp. 1795–1799, 1976.
[13] J. P. W. Pluim, J. B. A. Maintz, and M. A. Viergever, “Mutual information matching in multiresolution contexts,”Image Vision Comput., vol. 19, no. 1–2, pp. 45–52, Jan. 2001.
[14] F. Maes, D. Vandermeulen, and P. Suetens, “Comparative evaluation of multiresolution optimisation strategies for multimodality image registra-tion by maximisaregistra-tion of mutual informaregistra-tion,”Med. Image Anal., vol. 3, no. 4, pp. 373–386, 1999.
[15] K. Mosaliganti, T. Pan, R. Sharp, R. Ridgway, S. Iyengar, A. Gulacy, P. Wenzel, A de Bruin, R. Machiraju, K. Huang, G. Leone, and J. Saltz, “Registration and 3D visualization of large microscopy images,”Proc. SPIE, vol. 6144, pp. 923–934, 2006.
[16] S. Ourselin, A. Roche, S. Prima, and N. Ayache, “Block matching: A general framework to improve robustness of rigid registration of medi-cal images,” inProc. Med. Image Comput. Comput. Assist. Intervention (MICCAI), 2000, vol. 1935, pp. 557–566.
[17] A. Pitiot, E. Bardinet, P. Thompson, and G. Malandain, “Piecewise affine registration of biological images for volume reconstruction,”Med. Image Anal., vol. 10, no. 3, pp. 465–483, 2005.
[18] J. P. W. Pluim, J. B. A. Maintz, and M. A. Viergever, “Mutual information based registration of medical images: A survey,”IEEE Trans. Med. Imag., vol. 22, no. 8, pp. 986–1004, Aug. 2003.
[19] S. Doyle, M. Feldman, J. Tomaszewski, and A. Madabhushi, “A boosted Bayesian multiresolution classifier for prostate cancer detection from digi-tized needle biopsies,”IEEE Trans. Biomed. Eng., vol. 59, no. 5, pp. 1205– 1218, May 2012.
[20] Y. Boykov, O. Veksler, and R. Zabih, “Fast approximate energy mini-mization via graph cuts,”IEEE Trans. Pattern Anal. Mach. Intell., vol. 23, no. 11, pp. 1222–1239, Nov. 2001.
[21] D. Mattes, D. R. Haynor, H. Vesselle, T. K. Lewellen, and W. Eubank, “Non-rigid multimodality image registration,”Med. Imag. Image Proc., pp. 1609–1620, 2001.
[22] Y. Song, D. Treanor, A. Bulpitt, and D. Magee, “3D reconstruction of mul-tiple stained histology images,” presented at 15th MICCAI Joint Workshop Histopathol. Image Anal.: Image Comput. Digit. Pathol. (HIMA), Nice, France, 2012.
[23] P. Boutros and A. Okey, “Unsupervised pattern recognition: An introduc-tion to the whys and wherefores of clustering microarray data,”Briefings Bioinform., vol. 6, no. 4, pp. 331–343, 2005.
[24] D. Judd, P. Mckinley, and A. K. Jain, “Large-scale parallel data cluster-ing,”IEEE Trans. Pattern Anal. Mach. Intell., vol. 20, no. 8, pp. 871–876, Aug. 1998.
[25] S. K. Bhatia and J. S. Deogun, “Conceptual clustering in information retrieval,”IEEE Trans. Syst., Man, Cybern. B, Cybern., vol. 28, no. 3, pp. 427–436, Jun. 1998.
[26] H. Frigui and R. Krishnapuram, “A robust competitive clustering algo-rithm with applications in computer vision,”IEEE Trans. Pattern Anal. Mach. Intell., vol. 21, no. 5, pp. 450–465, 1999.
![Fig. 2(c)–(e)].](https://thumb-us.123doks.com/thumbv2/123dok_us/7962058.198807/2.595.40.289.91.223/fig-c-e.webp)