Network modelling for road-based
faecal sludge management
Ruth Kennedy-WalkerMEng
PhD Student, School of Civil Engineering and Geosciences, Newcastle University, Newcastle upon Tyne, UK
Tomas HoldernessBSc, PhD
Geomatics Research Fellow, SMART Infrastructure Facility, University of Wollongong, NSW, Australia
David AldersonBSc
Research Assistant in Geoinformatics, School of Civil Engineering and Geosciences, Newcastle University, Newcastle upon Tyne, UK
Barbara EvansMSc, CEng
Associate Professor in Water and Environmental Engineering, School of Civil Engineering, Leeds University, UK
Stuart BarrBSc, PhD
Senior Lecturer in Geographic Information Science, School of Civil Engineering and Geosciences, Newcastle University, Newcastle upon Tyne, UK
Improvements in the collection and treatment of sewage are critical to reduce health and environmental hazards in rapidly urbanising informal settlements. Where sewerage infrastructure is not available, road-based faecal sludge management options are often the only alternative. However, the costs of faecal sludge transportation are often a barrier to its implementation and operation and thus it is desirable to optimise travel time from source to treatment to reduce costs. This paper presents a novel technique, employing spatial network analysis, to optimise the spatio-topological configuration of a road-based faecal sludge transportation network on the basis of travel time. Using crowd-sourced spatial data for the Kibera settlement and the surrounding city, Nairobi, a proof-of-concept network model was created simulating the transport of waste from the 158 public toilets within Kibera. The toilets are serviced by vacuum pump trucks which move faecal sludge to a transfer station, and from there a tanker transports waste to a treatment plant. The model was used to evaluate the efficiency of different network configurations, based on transportation time. The results show that the location of the transfer station is a critical factor in network optimisation, demonstrating the utility of network analysis as part of the sanitation planning process.
Notation
clt large tanker capacity in litres cvt Vacutug capacity in litres
dij shortest path between toilet node i and transfer stationjweighted by travel time, as defined by Dijkstra’s algorithm
djk shortest path between transfer stationjand treatment plantkweighted by travel time, as defined by Dijkstra’s algorithm
i public toilet node
in number of toilets serviced by transfer stationj
j transfer station node
k treatment plant node
tj minimum sewage travel time in hours for stationjwhere stationjhas the lowest time of any station, using the single station model configuration
tm total minimum sewage travel time in hours using the multiple station model config-uration
x
x mean
s standard deviation
1. Introduction
Poor sanitation poses major health and environmental risks to urban populations in low-income countries around the world (United Nations, 2005). Currently, 714 million people in urban areas worldwide lack access to improved sanitation (World Health Organisation, 2012). In areas where wastewater and sewage are not safely collected and treated before discharge risks to public health and the environment are greatly increased (Asian Productivity Organisation, 2007). Such risks are often exacerbated in informal settlements and rapidly urbanising areas, such as the peri-urban fringe, due to high population densities, poor infrastructure and limited access to formal water and sanitation services (Isunjuet al., 2011). With current global populations projected to double by 2050 and 90% of urban growth to take place in developing countries these risks will become even more prominent in the future (Drechselet al., 1999).
an in-house water supply (Mara, 1996; Veenstraet al., 1997). In Africa, for example, studies have shown that only half of Africa’s large cities have sewerage networks and these serve only a fraction of the total population in each city (Banerjee and Morella, 2011). Where conventional sewerage networks are unavailable, on-site sewage collection methods (e.g. pit latrines and septic tanks) are utilised to store faecal waste for on-site treatment or later collection (Veenstraet al., 1997). In many cases, facilities are shared by many households, owing to the dense nature of LIUEs, which makes it impossible to safely abandon and construct a new pit (Hawkins et al., 2013). Therefore, there is a need to hygienically remove and transport faecal sludge for treatment, reuse or disposal (Hawkinset al., 2013).
In LIUES more suitable options for the utilisation of the sanitation service chain are through low-cost sewerage (e.g. condominial sewerage) linking to on-site treatment facilities (e.g. decentralised wastewater treatment systems) or the servicing of on-site sanitation facilities through faecal sludge management (FSM) services (Hawkinset al., 2013). This study focuses on systems in which faecal sludge is removed from pits and tanks either by manual or mechanised means, and transported over the road network.
In LIUEs infrastructure constraints mean motorised vehicles struggle to reach facilities, and manual emptying and trans-portation of faecal sludge is commonplace (Tilleyet al., 2008). Pit emptiers will manually empty the faecal sludge from latrines using buckets and shovels and then transport the waste to its end point by foot or through the utilisation of a manually driven cart or bike (O’Riordan, 2009). More recently hand pumps specifically designed for faecal sludge (e.g. pooh pump or gulper) and portable, manually operated pumps (e.g. manual pit-emptying technology) have come into operation and specifically aim to improve the ease of collection (Tilley et al., 2008). Additionally, there has been a range of locally developed motorised solutions; these have been successfully employed to meet the transportation component and infra-structure challenges of LIUEs, and allow access to toilets and latrines on narrow or poorly constructed roads which were previously inaccessible to larger pump trucks (Issaias, 2007; Tilleyet al., 2008). One such example is the Vacutug; a small vacuum pump truck which was developed by the United Nations Habitat programme, which has proved successful in a number of small-scale trials (O’Riordan, 2009).
A major barrier to the success of road-based FSM systems is the operational and maintenance costs of faecal sludge trans-portation vehicles (Chowdhry and Kone´, 2012; O’Riordan, 2009; Thyeet al., 2009). This is especially the case when using motorised vehicles such as Vacutugs owing to their limited capacity and speed (O’Riordan, 2009). In field trials using
Vacutugs in Mozambique and Ghana, it was found that latrine emptying time was relatively quick (,5 min), but long Vacutug journey times and their associated costs were the biggest limitation of the system (O’Riordan, 2009). One method to reduce costs, which has successfully been employed in the aforementioned field trials, is to use an intermediate transfer station for waste; this reduces Vacutug transport time (O’Riordan, 2009). A transfer station is a holding tank sited at the edge of the settlement from where larger tanker trucks collect and transport faecal sludge the remaining distance to the treatment plant over the main road network (O’Riordan, 2009; Tilleyet al., 2008). The location of the transfer stations can be optimised with respect to faecal sludge transportation time using spatial network factors. Other factors which would also influence the siting of transfer stations, including local planning restrictions, residents’ influence on decision making, and the cost of land, would be taken into consideration alongside transportation costs but do not lend themselves to inclusion in the spatial modelling step.
In high-income countries, analysis of transport networks is traditionally undertaken using formal spatial data (e.g. topographic survey) within a geographical information system (GIS), to calculate travel time between points on a network based on distance and speed (Barthe´lemy, 2011; Gastner and Newman, 2006; Newman, 2010). In low-income countries the use of such techniques is often restricted due to limited availability of spatial data with which to create and model transportation networks (Hagen, 2010; Paar and Rekittke, 2011). Furthermore, LIUEs represent the most un-surveyed areas of mega-cities (Hagen, 2010; Paar and Rekittke, 2011) and thus may entirely lack the spatial data coverage critical for urban development and resource flow planning (Hagen, 2010).
network and the location of amenities such as water taps, toilets and health clinics (Berdou, 2011; Hagen, 2010; Paar and Rekittke, 2011). Follow-up analysis, beyond a demonstrative exercise that utilises only existing data, could collect informa-tion on factors such as the cost of land and the views of residents, using crowd-source mapping, to strengthen the land availability model.
Crucially, crowd-sourced spatial data present an invaluable insight into the infrastructure of LIUEs, which has not previously been captured by traditional formal data sources. Such information, combined with existing modelling techni-ques, affords the opportunity to quantify and improve infrastructure provision for the urban poor in developing nations, in a manner that has not previously been possible. With respect to these issues the present study presents an evaluation of the utility of spatial network modelling for improved sanitation using crowd-sourced spatial data. Using a simple network model representing a road-based faecal sludge transportation system, the optimisation of one component of the sanitation service chain for FSM, total faecal sludge travel time, is demonstrated to be a potential method of cost reduction for road-based FSM systems in LIUEs.
2. Materials and methods
The informal settlement of Kibera lies 5 km south-west of the centre of Nairobi, Kenya and spans an area of more than 550 acres (Hagen, 2010). Kibera comprises 13 ‘villages’ and is home to between 235 000 and 270 000 residents with a population density of between 1055 and 1213 persons per hectare (Map Kibera Project, 2008). Sanitation provision in Kibera is poor, with little or no formal sewage infrastructure, and high risk of drinking water contamination (Binale, 2011). The Map Kibera project shows 158 public toilets within the Kibera boundary (Bongi and Morel, 2005; Guliset al.2004). This study models a hypothetical road-based improved sanitation scheme using a Vacutug and transfer station system to manage waste from the 158 public toilets indicated by the Map Kibera project. There are additionally numerous pri-vately controlled on-site pit latrines and hanging latrines, usually shared between multiple households. Were additional data to become available on the nature and location of these toilets, either through Map Kibera or a more formal survey, they could readily be incorporated into the spatial model. However, for the purposes of demonstrating the approach, the model focuses on the public toilets. Owing to the transporta-tion element of FSM being noted as a limiting factor for success, this model focuses on the transportation of faecal sludge and does not include consideration of emptying time requirements. The Vacutug technology has been selected within this analysis as it is available in Kibera at present. However, this network modelling technique could be used to assess the travel times associated with various local transportation options as
well as the likely travel time reduction that may occur if the roads in Kibera were improved and could therefore support other types of transport technologies. The network model used the Dandora treatment plant as a potential end-point for transportation of faecal sludge from Kibera, although there is no evidence in the literature as to whether the plant has provision for additional tanker-transported faecal waste. Dandora is Nairobi’s largest treatment plant and is situated approximately 20 km east of the city centre (Engineering and Consulting Firms Association, 2008). Dandora is a lagoon-based plant with a daily treatment capacity of 80 000 m3which it discharges in the form of partially treated effluent to the Nairobi river system north-east of the city (Engineering and Consulting Firms Association, 2008).
Road, footpath and land-cover data for Kibera were extracted from OpenStreetMap data for Nairobi and Kibera. The Kibera boundary and the locations of public toilets were obtained from the Map Kibera project (Hagen, 2010). For the purpose of storing, managing and analysing the data, spatial database tables representing each of the acquired data sets were created. Prior to building the road network model a number of data pre-processing steps were undertaken. First, to identify areas suitable for transfer stations at the Kibera–Nairobi boundary a Boolean multi-criteria evaluation (MCE) was performed. MCE can be used within a GIS as a spatial analysis technique to locate suitable areas as defined by a series of Boolean rules (Carver, 1991; Store and Kangas, 2001). In this instance MCE was used to locate available areas of land at the Kibera– Nairobi boundary which could be used to locate transfer stations, based on descriptions of previous implementations in the literature (O’Riordan, 2009; Tilley et al., 2008). Suitable land areas were selected if they were within 50 m of the Kibera boundary and within 5 m of a road connected to both Kibera and Nairobi. This ensured that Vacutug journey distances were minimised, and that there was suitable road access for both Vacutugs into Kibera and larger tanker trucks to Nairobi. Only land areas without existing development and with an area greater than 64 m2were selected, to ensure that a large enough area of land was available to build a transfer station, based on descriptions of previous projects (Binale, 2011; O’Riordan, 2009). The centroids of the areas identified as suitable for transfer stations were used to represent transfer station nodes in the network model.
Nairobi were set to 25 km/h based on averages recorded during a study for the International Vehicle Emissions Model (Davis et al., 2005); tracks and footpaths were excluded from large tanker journey analysis. In reality, Vacutugs would be unlikely to achieve maximum velocity on the poor quality roads inside Kibera. Therefore, the best locations of transfer stations highlighted in this study would need to be further reviewed once a more realistic assessment of possible Vacutug speeds in Kibera is available. There is currently limited availability of reliable empirical data about road speeds in Nairobi and data collection from the field would be required to establish infrastructure condition (Daviset al., 2005). The time to travel each road segment was calculated using road length and speed.
The final pre-processing step was the construction of a topological model of the sanitation road network. A spatio-topological representation allows the model to consider the spatial structure of the network as well as its topology (Gastner and Newman, 2006). The network model was created using the spatial database scheme and coupled Python interface to the NetworkX graph analysis package, developed by Newcastle University (Barret al., 2012). This software infers topological rules based on geographical relationships from spatial data, and stores the constructed network in a relational spatial database (Barret al., 2012). Examination of the network can then be undertaken using the NetworkX Python package, which provides functions for network exploration and analysis (Hagberg et al., 2008). Once created, the complete road network for Kibera and Nairobi comprised 19 558 edges covering 4 686 483 m of road (including all classes of roads), and 16 347 nodes representing road junctions, toilets, the transfer stations and the treatment plant.
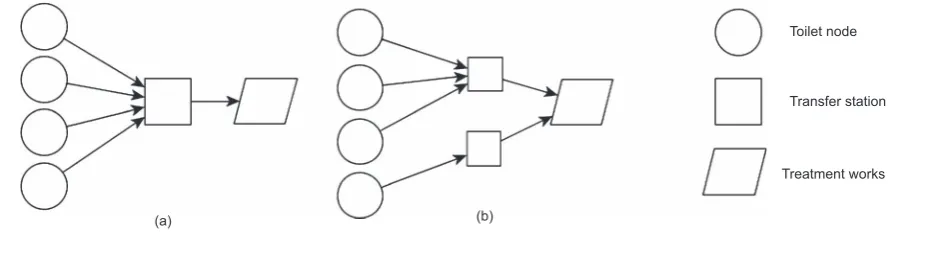
For analysis of faecal sludge transportation time by way of different transfer station locations the network model was used to create two topological configurations (Figure 1). For both models, travel time was defined as the journey distance divided by maximum speed for the vehicle in question. In the first configuration the network model was used to identify a single transfer station which represented the minimised time of transporting one Vacutug load of faecal sludge from each toilet in Kibera to a transfer station, and then transporting the accumulated waste to the treatment plant (Figure 1(a)). To achieve this the sum of the journey time over the shortest paths from each of the toilets in Kibera to each transfer station, plus the travel time from the transfer stations to treatment plant was computed. The shortest path between network locations was calculated based on the travel time for each road using Dijkstra’s algorithm (Newman, 2010). The transfer station with the minimum total faecal sludge transport time (tj) was then identified as the most efficient (Equation 1).
In the model the number of large truck trips is inversely proportional to the truck’s capacity and directly proportional to the capacity of the Vacutugs. In the modelled example a Vacutug capacity (cvt) of 500 litres was assumed along with a large tanker capacity (clt) of 10 000 litres (Tilleyet al., 2008). For every 20 Vacutug journeys to the transfer station the larger tanker must make one journey to the treatment plant. Thus, the total number of large tanker journeys is this ratio
clt=cvt~1=20
ð Þ multiplied by the number of toilets (in5158) (Equation 1). Therefore total faecal sludge transport time by way of each transfer station is the time taken for a Vacutug journey from each of the 158 toilets in Kibera (i) and the 7?9 large tanker trips required from the transfer station (j) to the treatment plant (k).
1. tj~min
Xn i~1dij
zdjkinclt
cvt
Vj
Equation 1 was used to determine the station with the minimum total faecal sludge transportation time using single transfer station model configuration. In the second model configuration the possibility of more than one transfer station (with multiple Vacutugs) was examined to see whether this reduced overall transportation time by reducing the distance of Vacutug journeys (Figure 1(b)). In this configuration the shortest-path travel time from each toilet (i) to the treatment plant (k), by way of each transfer station (j) in hours was calculated (Equation 2). For each toilet the transfer station which gives the minimum transport time is recorded, and the sum of times for all 158 toilets (travelling by way of multiple transfer stations) is the total transportation time for the network (tm). This model optimises the transfer station location on a per-toilet basis, with the number of transfer stations only limited by the number of suitable areas identified in the MCE analysis.
2. tm~
Xn
i~1 min dijzdjkin
clt
cvt
Vj
Equation 2 was used to calculate the total faecal sludge transportation time based on the sum of the minimum transportation time for each toilet using the multiple station model configuration.
journeys required for each of the 158 toilets to be serviced by a Vacutug once (7?9 journeys), and as a result the sum of the minimum times from Equation 2 is comparable to the minimum times from the single station model in Equation 1.
3. Results
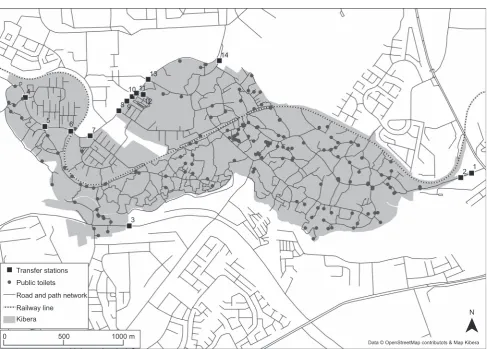
Figure 2 shows the locations of 14 areas of land identified as suitable for transfer stations by the MCE. The spatial distribution of stations around Kibera is uneven with 11 of the 14 stations lying to the north-west. Two stations lie to the far east of the settlement (stations 1 and 2), and are closest by straight line distance to the Dandora treatment plant (,25 km). One additional station (station 3) is situated to the south-west of Kibera. Stations 4, 5 and 6 present interesting locations selected by the MCE as they are situated on a road which bisects two segments of Kibera, and so located between two ‘edges’ of the settlement are, unlike the other stations, positioned among a number of toilets in north-western Kibera, reducing the distances to nearby toilets at these sites.
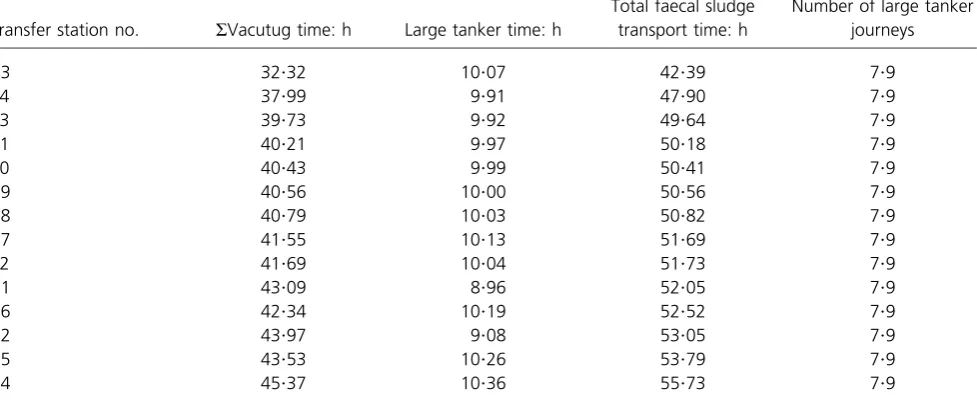
Table 1 shows the total faecal sludge transport time for each station as calculated using the first model configuration. Total faecal sludge transportation time from station 3 is 42?39 h, the minimum value for all stations (Equation 1). Station 3 represents the location which provides the best balance between overall distance to the treatment plant and total distance for all 158 Vacutug journeys. The total faecal sludge transportation time from station 3 is 5?51 h less than the next fastest route by way of station 14 which lies to the north of Kibera, and 13?34 h less than station 4, the least efficient station which is situated at the western end of the settlement. These results are to be expected somewhat as the geography of Kibera shows that the settlement runs broadly east–west (Figure 2), meaning that station 4 is not only furthest from the Dandora treatment plant but also from the majority of Kibera’s toilets, increasing both its Vacutug and large tanker journey times. In contrast, stations 3 and 14 (the first and second most efficient station locations) are located more
towards the centre of Kibera, thus reducing the time for Vacutug journeys to toilets across the settlement.
However, whereas station 3 exhibits the overall lowest transport time, the journey time from transfer station to treatment plant (large tanker journey time) is between 1?61 and 0?04 h slower than the large tanker trip times from the next six fastest transfer stations (Table 1). Additionally, the standard deviation of Vacutug journeys across all stations in Table 1 (s53?03,
x
x540?97 h) is almost eight times that of the large tanker journeys (s50?39,xx59?92 h). As a result the Vacutug journey times have a greater influence on overall station transport time than large tanker journeys. The latter have a low variation due to the lack of ring roads in Nairobi which forces many vehicles traversing the city to pass through the central business district (Gonzaleset al., 2011), leading to convergence of shortest path route from each transfer station to the treatment works, thereby minimising differences in journey times.
Table 2 shows the faecal sludge transportation times from the second model configuration, with an unconstrained number of transfer stations in use. The results show that the model has identified eight transfer stations (listed in Table 2) for the Vacutugs to service all 158 toilets, based on minimum faecal sludge transport time from each toilet to the treatment plant. This new configuration gives a Vacutug transport time of 29?95, a large tanker transport time of 9?43 and a total faecal sludge transportation time of 39?38 h, respectively. The eight selected stations are distributed around the Kibera boundary (Figure 2), with each station servicing the toilets in its immediate vicinity to minimise Vacutug distances for each toilet. From the results it can be seen that the number of toilets serviced by each transfer station varies; station 1 at the eastern end of Kibera services the greatest number of toilets (88) whereas stations 8 and 5 to the north-west each only service one toilet. Figure 2 shows the greatest density of toilets occurs in the eastern half of Kibera, suggesting that this is the cause of the high number of toilets being serviced by station 1. The
(a) (b)
Toilet node
Transfer station
[image:5.595.76.541.148.276.2]Treatment works
weighting for the large tanker journeys increases proportionally for each station by the number of toilets serviced, as described by Equation 2. In this instance, for station 1 to service 88 toilets (e.g. 88 Vacutug journeys) 4?4 large tanker journeys will be required, whereas if station 5 only services one toilet then it can accommodate 20 Vacutug journey’s worth of waste before needing a large tanker journey (i.e. a weight of 0?05).
Overall the total transport time using the eight stations is 3?01 h less than that of the single station model presented in Table 1. This demonstrates that in terms of faecal sludge transportation time, a road-based sanitation network with multiple transfer stations could potentially be used to minimise time as compared to a system with only a single transfer station. Furthermore, it can be seen that the decrease in faecal sludge transport time in the second model configuration occurs in both Vacutug and large tanker journey times; Vacutug and large tanker transportation times are 2?37 and 0?64 h faster,
respectively. However, while all journey times in the second model configuration (total transport time 39?38 h, Table 2) are lower than any of the single station routes, the decrease only represents a 1?28% improvement in total faecal sludge transport time as compared to the minimum time from the single station model configuration (42?39 h by way of station 3, Table 1). These results highlight that further research is required to ascertain whether the marginal decrease in time using multiple stations would make a significant contribution to reducing network-associated costs of such a road-based FSM. Additionally, to assess the true benefits between single and multiple transfer station configurations it will be necessary for future research to include other governing factors which could attribute to further optimisation of the system; for example, emptying frequency, quantity of septage collection, operational service time, seasonality effects, costs of transfer station, optimisation of large tanker operation, etc. This mo-delling analysis can be utilised as a significant first step towards
14 13
11 12 10 9
7 6 5
3
Transfer stations Public toilets Road and path network
Data © OpenStreetMap contributots & Map Kibera
N Railway line
Kibera
0 500 1000 m
1 2 4
[image:6.595.49.537.138.487.2]8
such optimisation which can be fine tuned and enhanced further once such a system is implemented and in operation.
4. Discussion
The use of the model shows that it is possible to combine a range of complex local data to generate comparable estimates of key components of the faecal sludge value chain which could then be used to identify optimum arrangements for FSM in LIUEs. For road-based systems several further improvements could be made. The lack of formal spatial data necessitates the use of crowd-sourced information. There is no guarantee that these data are complete or accurate, although a number of studies have shown this to be the case in some instances
(Hagen, 2010; Zooket al., 2010). Crowd-sourced data have the advantage that they can be frequently updated and their open-source characteristic make the data particularly suitable for use in fast-changing, dynamic, informal settlements. However, key variables such as land cover and road conditions could usefully be validated in a real-life application of the approach. The lower density of toilets shown by Map Kibera in north-west Kibera suggests that not all public toilets have been captured in the data, or that private toilet facilities are prevalent in this area. A more detailed assessment of infrastructure provision would allow for a more detailed assessment of pit and rank emptying needs. The study by Paar and Rekittke (2011) demonstrates the rapid collection of land use data in informal settlements for Transfer station no. SVacutug time: h Large tanker time: h
Total faecal sludge transport time: h
Number of large tanker journeys
3 32?32 10?07 42?39 7?9
14 37?99 9?91 47?90 7?9
13 39?73 9?92 49?64 7?9
11 40?21 9?97 50?18 7?9
10 40?43 9?99 50?41 7?9
9 40?56 10?00 50?56 7?9
8 40?79 10?03 50?82 7?9
7 41?55 10?13 51?69 7?9
12 41?69 10?04 51?73 7?9
1 43?09 8?96 52?05 7?9
6 42?34 10?19 52?52 7?9
2 43?97 9?08 53?05 7?9
5 43?53 10?26 53?79 7?9
[image:7.595.61.550.150.351.2]4 45?37 10?36 55?73 7?9
Table 1.Faecal sludge transport times for each transfer station, based on the first model configuration
Transfer station no.
Number of toilets serviced by each
transfer station SVacutug time: h
Large tanker time: h
Total transport time: h
Number of large tanker journeys
1 88 22?50 4?99 27?49 4?40
14 28 3?93 1?76 5?68 1?40
7 18 1?57 1?15 2?73 0?90
3 13 1?23 0?83 2?06 0?65
6 4 0?35 0?26 0?61 0?20
13 5 0?19 0?31 0?50 0?25
8 1 0?15 0?06 0?22 0?05
5 1 0?02 0?06 0?08 0?05
Total 158 29?95 9?43 39?38 7?9
[image:7.595.58.551.574.731.2]architectural planning and it is recommended that this technique be applied in the future to improve knowledge of potential locations for transfer stations.
Accumulation rates related to FSM are complex to obtain. Additional specific data on this (e.g. environmental conditions, volume of collection unit) would enhance the detail of the analysis, but in reality rates are likely to be quite inconsistent throughout Kibera. Obtaining further detailed information on the number of users per toilet facilities would, however, help to improve the estimate considerably. In addition, the model para-meters are limited by available data, and a consistent speed of 5 km/h is assumed, based on maximum Vacutug velocity. How-ever, in reality this will vary as a function of path quality, con-gestion and obstacles. A collection of parameters to account for real road conditions would improve the accuracy of the results.
Finally, it is recognised that the removal of faecal sludge does occur from on-site sanitation facilities in LIUEs; however, this arrangement is often informal and does not safely dispose of faecal sludge through the sanitation value chain. The present study looks to support the formalisation of FSM by providing a useful planning approach to optimising the transportation part of the value chain. It should be noted that to support such FSM an ‘enabling environment’ would be required in terms of management structures, institutional arrangements, and ade-quate infrastructure, policy, standards and finance, which may be taken up in future study on the subject.
5. Conclusions
This study has demonstrated the use of network modelling to calculate faecal sludge transportation time over a road-based sanitation network, cited as a solution to poor sewage infrastructure in developing nations (O’Riordan, 2009; Tilley et al., 2008). This research was enabled by crowd-sourced geospatial data, which provide new information on the road network and existing sanitation infrastructure within Kibera (Hagen, 2010; Paar and Rekittke, 2011). Using the network model it was possible to identify the transfer station location with the minimum faecal sludge transportation time, which could be used as a more reliable proxy for optimising transport costs in a road-based improved sanitation scheme (O’Riordan, 2009). The study also found that by increasing the number of transfer stations to eight, the distance of Vacutug journeys was minimised and overall faecal sludge transportation times were further reduced. However, the results also highlighted that this reduction was marginal. Further research is required to attribute the cost of faecal sludge transportation across the road network, to quantify whether the reduction in transport time from multiple transfer stations would be cost-effective.
As populations in informal settlements around the world continue to rise (Drechselet al., 1999; Isunjuet al., 2011) it will
become increasingly necessary to evaluate the long-term operating costs of improved sanitation options, to provide an economically sustainable method of reducing health and environmental risks. As such, future feasibility studies will need to consider transportation network options for faecal sludge alongside conventional piped networks and, in parti-cular, the associated current and future capital, operation and maintenance costs of different systems. There is currently limited research about road-based faecal sludge emptying and transportation, and methods to assess its effectiveness (Chowdhry and Kone´, 2012). It is envisaged that the network modelling tools and methods presented herein will help improve the knowledge gap related to transport-based sanita-tion services and could be used by engineers as part of the sanitation planning process to optimise the configuration of improved sanitation networks in developing nations.
Acknowledgements
The authors would like to acknowledge the UK Engineering and Physical Science Research Council (EPSRC) for the PhD studentship awarded to R.K.-W. that supported this research.
REFERENCES
Asian Productivity Organisation(2007)Solid Waste Management: Issues and Challenges in Asia. Report of the Asian Productivity Organisation Survey on Solid Waste Management 2004–05. Asian Productivity Organisation, Mumbai, India.
Banerjee SG and Morella E(2011)Africa’s Water and Sanitation Infrastructure: Access, Affordability and Alternatives. The International Bank for Reconstruction and Development. Washington, DC, USA.
Barr S, Holderness T, Alderson D, Robson C and Ford A(2012) An open source relational database schema and system for the analysis of large scale spatial interdependent infrastructure networks.Proceedings of the 4th Open Source GIS Conference, Nottingham, UK.
Barthe´lemy M(2011) Spatial networks.Physics Reports499(1): 1–101.
Berdou E(2011)Mediating Voices and Communicating Realities. Using Information Crowdsourcing Tools, Open Data Initiatives and Digital Media to Support and Protect the Vulnerable and Marginalised. Vulnerability and Poverty Reduction Research, Institute of Development Studies, Brighton, UK.
Binale A(2011) Umande Trust Bio-Centre approach in slum upgrading.Les cahiers d’Afriquede l’estSeptember: 167–186. Bongi S and Morel A(2005)Understanding Small Scale
Providers of Sanitation Services: A Case Study of Kibera. Water and Sanitation Program, Nairobi, Kenya. Carver S(1991) Integrating multi-criteria evaluation with
geographic information systems.International Journal of Geographical Information Systems5(3): 321–339. Chowdhry S and Kone´ D(2012)Business Analysis of faecal
in Africa and Asia – Draft Final Report. Bill and Melinda Gates Foundation, Seattle, WA, USA.
Davis N, Lents J, Osses M, Nikkila N and Barth M(2005) Part 3: Developing countries: development and application of an international vehicle emissions model.Transportation Research Record1939(1): 155–165.
Drechsel P, Quansah C and Penning F(1999)Agriculture urbaine en Afrique de l’Ouest(Urban Agriculture in West Africa). International Development Research Centre, Ottawa, Canada. Engineering and Consulting Firms Association(2008)Project
Formulation Study on Nairobi Metropolitan Development Planning Project. Engineering and Consulting Firms Association, Tokyo, Japan, Study Report.
Gastner M and Newman M(2006) The spatial structure of networks.European Physical Journal B – Condensed Matter and Complex Systems49(2): 247–252.
Gonzales E, Chavis C, Li Y and Daganzo C(2011) Multimodal transport in Nairobi, Kenya: insights and
recommendations with a macroscopic evidence based model.Proceedings of the Transportation Research Board 90th Annual Meeting, Washington, DC, USA.
Gulis G, Mulumba J, Juma O and Kakosova B(2004) Health status of people of slums in Nairobi, Kenya.Environmental Research96(2): 219–227.
Hagberg A, Schult DA and Swart PJ(2008) Exploring network structure, dynamics, and function using NetworkX.
Proceedings of the 7th Python in Science Conference, pp. 11–15. Hagen E(2010) Putting Nairobi’s slums on the map.
Development Outreach12(1): 41–43.
Haklay M(2010) How good is volunteered geographical information? A comparative study of OpenStreetMap and Ordnance Survey datasets.Environment and Planning B. Planning and Design37(4): 682–703.
Haklay M and Weber P(2008) OpenStreetMap: user-generated street maps.IEEE Pervasive Computing7(4): 12–18. Hawkins P, Blackett I and Heymans C(2013)Poor-Inclusive Urban
Sanitation: An Overview. Targeting the Urban Poor and Improving Services in Small Towns. Water and Sanitation Program, The World Bank, Washington, DC, USA. Issaias I(2007)UN-HABITAT Vacutug Development Project:
Technical Report of Field Trials 2003–2006. UN-HABITAT, Nairobi, Kenya.
Isunju JB, Schwartz K, Schouten MA, Johnson WP and van Dijk MP(2011) Socio-economic aspects of improved sanitation in slums: A review.Public Health125(6): 368–376. Map Kibera Project(2008)Map Kibera Project – Maps and
Statistics(online).Map Kibera Project. See http:// mapkiberaproject.yolasite.com/maps-and-statistics.php (accessed 15/11/2013).
Mara DD(1996)Low Cost Urban Sanitation. John Wiley, New York, USA.
Newman M(2010)Networks: An Introduction. Oxford University Press, New York, USA.
O’Riordan M(2009)Investigation into Methods of Pit Latrine Emptying – Management of Sludge Accumulation in VIP Latrines. Water Research Commission (WRC), South Africa. Paar P and Rekittke J(2011) Low-cost mapping and publishing methods for landscape architectural analysis and design in slum-upgrading projects.Future Internet3(4): 228–247. Store R and Kangas J(2001) Integrating spatial multi-criteria
evaluation and expert knowledge for GIS-based habitat suitability modelling.Landscape and Urban Planning55(2): 79–93.
Thye PY, Templeton MR and Ali M(2009) Pit latrine emptying: technologies, challenges and solutions.Proceedings of Engineering Without Borders UK National Conference, London, UK.
Tilley E, Lu¨thi C, Morel A, Zurbru¨gg C and Schertenleib R(2008) Compendium of Sanitation Systems and Technologies. Swiss Federal Institute of Aquatic Science and Technology, Eawag, Du¨bendorf, Switzerland.
United Nations(2005)The Millennium Development Goals Report 2005. United Nations Publications, New York, NY, USA. Veenstra S, Alaerts G and Bijlsma M(1997)Water Pollution Control
– A Guide to the Use of Water Quality Management Principles. WHO/UNEP, London, published on behalf of the United Nations Environment Programme, the Water Supply & Sanitation Collaborative Council and the World Health Organization. Spon, London, UK.
World Health Organisation(2012)Progress on Drinking Water and Sanitation: 2012 Update. WHO/UNICEF Joint Monitoring Programme for Water Supply and Sanitation, USA. Zook M, Graham M, Shelton T and Gorman S(2010) Volunteered
geographic information and crowdsourcing disaster relief: a case study of the Haitian earthquake.World Medical and Health Policy2(2): 7–33.
WHAT DO YOU THINK?
To discuss this paper, please email up to 500 words to the editor at [email protected]. Your contribution will be forwarded to the author(s) for a reply and, if considered appropriate by the editorial panel, will be published as discussion in a future issue of the journal.