promoting access to White Rose research papers
White Rose Research Online
eprints@whiterose.ac.uk
Universities of Leeds, Sheffield and York
http://eprints.whiterose.ac.uk/
This is an author produced version of a paper published in
Lighting Research
and Technology
.
White Rose Research Online URL for this paper:
http://eprints.whiterose.ac.uk/76643
Published paper
Ramasoot, T. and Fotios, S.A. (2012)
Lighting and display screens: Models for
predicting luminance limits and disturbance
. Lighting Research and Technology,
44 (2). 197 - 223. ISSN 1477-1535
Lighting and display screens: Models for predicting luminance
limits and disturbance
T Ramasoota PhD and SA Fotios PhD
School of Architecture, University of Sheffield, Sheffield, UK.
a
Now at Faculty of Architecture, Silpakorn University, Bangkok, Thailand.
Ramasoot T and Fotios SA, Lighting and display screens: Models for predicting luminance limits and disturbance, Lighting Research & Technology, 2012; 44(2); 197-223
This version of the article is as revised following comments received during peer review.
Abstract
1. Introduction
The introduction of computers has transformed the visual environment of offices since the 1970s. In the 21st Century, the same transformation is taking place in classrooms. This paper develops methods for judging the acceptability of lighting for use in classrooms where a variety of display screen equipment is in use.The reason why lighting in classrooms needs to be judged is the potential for reflections to occur in display screens. Such reflections are disturbing when they produce a high luminance contrast between the reflected object and the screen background1. The magnitude and form of these reflections depends on the reflection properties of display screens2,3, which are characterized by three components; diffuse, specular and haze4 (Figure 1). Diffuse reflection occurs when the reflected light is scattered equally in all possible directions; it produces a uniform luminance that decreases the contrast between the displayed material and its background. Specular reflection produces a distinct reflected image in the mirrored direction which can easily draw attention from the intended tasks. Haze reflection combines the characteristics of specular and diffuse reflection, giving a blurred edge to the image caused by specular reflection. Display screens using different technologies and surface treatments have these reflection components in different proportions.
Disturbing reflection is caused by the presence of light sources within the reflected scene in a display screen. Therefore, the common recommendation in lighting guides to eliminate such reflection is to control the geometry between the display screen, light source and user, which is achieved by changing the position and orientation of the display screen. However, control of geometry between lighting, display screen and user is not always possible in real-world applications,
particularly for big screens like interactive whiteboards which are viewed by
multiple users at the same time. Therefore, many lighting guides found it necessary to specify quantitative standards for luminaires and surfaces reflecting light, these being the main sources of disturbing reflections in display screens.
applicable. For indirect lighting, average and maximum luminances for major reflecting surfaces such as ceilings and upper parts of walls are prescribed. For lighting with direct and indirect components, both direct and indirect lighting luminance limit criteria are applied. Guidance documents that use this approach include the SLL Lighting Guide 7: Office Lighting, British Standard BS EN 12464-1:2002 Lighting of Work Places and RP-1-04 American National Standard Practice for Office Lighting5-7. Although this approach is rational, it may be outdated
because display screen technology changes rapidly. Over the last few years, there has been a rapid move from CRT displays to LCD and plasma displays. Further, classrooms have seen the widespread introduction of interactive whiteboards and large screen displays as well as individual monitors. These new technologies have different reflection properties and different screen luminances and are viewed at different distances. For this reason, a study has been carried out using a range of screens likely to be found in classrooms. The key objectives of this work were:
• To determine the maximum acceptable luminance of a light source visible by
reflection from display screens representative of those used in classrooms.
• To identify the screen and lighting parameters that affect the acceptability of
reflections.
• To measure the effect of screen reflections on visual performance.
• To develop models to predict the maximum luminaire luminance and the level of
disturbance felt at different luminances based on known properties of the display and the lighting.
2. Methods
display are just starting to be unacceptable for users. Agreement between the two methods suggests the results are robust. In addition to psychophysical tests, the influence of screen reflections on reading was examined.
The adjustment measurements were made separately from the category rating and reading measurements, using two different panels of observers. However, the test environment, light box, display screens and viewing angles were identical in both sets of measurements.
2.1 Test environment
The test took place in a room 3.4m wide x 3.9m long x 3.2m high (Figure 2). The windows were sealed to prevent daylight entering the room. The surface
reflectances were 0.60 to 0.80 (walls and window blinds), 0.69 (ceiling) and 0.17 (floor). Ambient light was provided by two ceiling-mounted louvre luminaires. Each luminaire contained two T8 70W fluorescent lamps with a correlated colour
temperature (CCT) of 3450K and a colour rendering index (CRI) of 54. The display screens and the observer’s seat were positioned so that no direct reflection from the ceiling luminaires was visible on any screen during the tests. The illuminance on the surface of display screens from the room lighting ranged between 180 lx and 231 lx.
2.2 Light box
Two sizes of aperture were used, 48mm and 480mm diameter. With these apertures and by moving the light box to various positions to suit different screens and test conditions, three angular sizes of light source were produced subtending 1°, 10° and 15° at the eye of the observer. A pilot survey of lighting in classrooms suggested that the visual size of luminaires reflected from screens is typically less than 5° and that of windows ranges from 5° to 40°. The aperture subtense of 1° was taken to represent the reflection caused by a small source (luminaire) and the aperture size of 10° was chosen to represent reflection caused by a large source (window). The 15° subtense was chosen as it was one of the sizes used for the compliance test for screen reflection according to BS EN ISO 9241-7:199813 and BS EN ISO 13406-2:200114 the other being the 1° subtense.
2.3 Display screens
Five types of display screen were used in the tests: Three types of PC monitor for individual use and two types of interactive whiteboards for whole-class display (Table 1 and Figure 4). An interactive whiteboard is a large interactive display consisting of two separated parts: a display device and a physical input (touch-sensitive) device. Both parts are connected to a computer so that the integrated system is interactive. The computer can be controlled by touching the board directly or by writing on the board using a special pen. Figure 4 shows two types of interactive whiteboard used in the current study: front-projection interactive
whiteboard (PIWP) and flat-screen overlay interactive whiteboard (OIWP).
The screens chosen have different diffuse, specular and haze reflection properties. The reflection properties of the display screens are summarized in Table 2. The measurement of the reflection properties of the display screens was based on the methods given in BS EN ISO 9241-7:199813 and BS EN ISO 13406-2:200114. For consistency with previous studies2,12.15, the diffuse reflection properties of the display screens were characterized by diffuse reflectance, defined by Equation 1. The specular reflection properties were characterized by specular reflectance, defined by Equation 2. The haze reflection properties of display screens were characterized using the simplified method proposed by Howlett15, i.e., as the ratio between the measured reflected luminance with a large light source (15°) or LDS
calculated LDS which combines only diffuse reflection and specular reflection
(Equations 3 and 4). The ratio between these values indicates the haze reflection component.
E
L
R
D Dd
π
π
ρ
=
∗
=
∗
[1]A S S
s
=
R
=
L
L
ρ
[2]Effect from haze reflection = Measured L
DS/ Calculated L
DS [3](
d (EXT)) (
s(SML) A(EXT))
DS
E
L
L
Calculated
=
ρ
∗
π
+
ρ
∗
[4]Where: ρd = Diffuse reflectance
RD = Reflectometer value for diffuse reflection
E = Illumination on the display surface LD = Diffuse reflected luminance
ρs = Specular reflectance
Rs = Reflectometer value for specular reflection
Ls = Specular reflected luminance of the display
LA = Specular light source luminance
Measured LDS = Total reflected luminance due to the 15° light source
Calculated LDS = Total diffuse plus specular luminance
E(EXT) = Illumination on the display surface due to the 15° light source
ρs(SML) = Specular reflectance for the 1° light source
LA(EXT) = Average luminance of the 15° light source
out for all five display screens in positive polarity and on two display screens with glossy surfaces in negative polarity. The two glossier screens were intended to represent the worse cases for comparison. Hence there were seven display screen conditions in total (Tables 1 and 2 and Figure 4).
2.4 Viewing angles
During the experiment, the test apparatus (light box, display screen and participant’s seat) was arranged so that the angle of viewing (or the angle of reflection) was equal to the angle of incidence formed by the projected line from the centre of the light box aperture to the centre of display surface and the normal of display surface (Figure 2). In ICT classrooms, some display screens, interactive whiteboards in particular, are viewed from various directions which may affect the acceptability of reflections on display screens. Two viewing angles were used: 15° and 30° from normal to display surface.
3. Adjustment measurements
3.1 Visual task
the centre of the aperture of the light box and the eye level of the participant were aligned at a similar height above the floor (1.10m).
3.2 Participants
Forty participants were recruited to do the repeated-measures adjustment test, twenty aged 30 years or younger (mean age 27 years) and twenty aged 50 years old or older (mean age 63 years). The sample included female and male
participants in equal proportion. Participants who normally wore spectacles or contact lenses were instructed to wear them during the experiment.
3.3 Procedure
The adjustment test was divided into 38 blocks, corresponding to the 38
combinations of display screen (7 levels), size of light box aperture (3 levels) and viewing angle (2 levels). All display screens were tested with 1° and 10° apertures of the light box. The 15° aperture was tested with the 5 PC screens only (CRTP, LCGP, LCMP, CRTN and LCGN). All pairs of display screen and aperture size were tested with both the 15° and 30° viewing angle. The order of these combinations was randomised.
The adjustment procedure was adapted from the methods used in previous studies to find the disturbance borderline of subjects8.10 by adjusting the luminance of the screen reflection. In this study, there are three visual criteria used in the luminance adjustment: Disturbance, contrast and clarity borderlines. The disturbance
or clarity of the text, the participants were told to base their judgement on the area of the text that coincided with the reflection.
At the beginning of each adjustment trial the light box luminance was set at either the highest or the lowest level permitted by the dimming mechanism. This starting level was counterbalanced. The experimenter stated the visual criterion used for that trial and then asked the participant to read the text on the screen with the reflection superimposed and use his/her judgement to increase or reduce the light box luminance until the borderline was found. Having recorded the borderline level, the experimenter asked to participant to reset the light box luminance to the starting level and begin the trial for the next visual criterion. This process was repeated until all three adjustment trials were done. The test combination was then changed and the experimenter instructed the participant to begin another session of three adjustment trials. The process was repeated until all 38 combinations were completed.
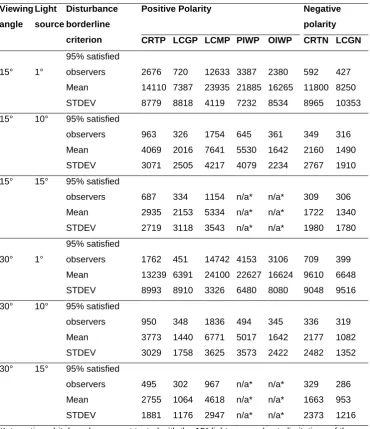
3.4 Results
Table 3 shows the mean luminances and the associated standard deviations for the disturbance borderline for all the combination tested. However, means are not a very useful way to identify the borderline since, assuming a normal distribution, fifty percent of observers will find lower luminances disturbing. An alternative approach is to determine the luminance which only 5 percent of observers find disturbing, i.e. the luminance which 95% of participants find acceptable. These luminances are also given in Table 3. The use of 95% acceptance follows good ergonomic practice in that equipment is usually designed to meet the needs of those who fall between the 5th and 95th percentile of the population16. The 95% satisfaction threshold was also the criterion used in a previous study with a similar adjustment method10.
Figure 5 compares the luminances at the disturbance, contrast and clarity
screen reflection will become disturbing before the contrast and clarity of the displayed text become unacceptable. The three borderlines were also strongly positively correlated; there were significant correlations between the disturbance and contrast borderlines (r=0.86, p<0.01), between the disturbance and clarity borderlines (r=0.87, p<0.01), and between the contrast and clarity borderlines (r=0.90, p<0.01). This means that it is likely that a display-lighting combination with a high disturbance borderline also has a high contrast borderline and a high clarity borderline. This suggests that the disturbance borderline should be the critical criterion in determining the limit of luminaire luminance. If the light source luminance is restricted to below the disturbance borderline, it is likely that the contrast and the clarity of the displayed text will still be acceptable to the observers.
It can also be seen from Figure 5 that the luminances at the disturbance borderline for the seven different display screens are different. The borderline levels of the negative polarity screens (CRTN, LCGN) are lower than those for the low gloss, positive polarity screens (CRTP, LCMP and PIWP). Among the positive polarity screens, the borderline luminances for the high gloss screens (LCGP, OIWP) are lower than those for the low gloss screens (CRTP, LCMP, PIWP). The disturbance borderline luminances obtained at the 15° and 30° viewing angles follow the same trend. Table 3 also shows that the borderline luminances for all display screens decreased as the size of the source of reflection increased.
A mixed design ANOVA was also carried out to determine the effect of age group on disturbance borderline. The analysis with seven screens, two viewing angles, two sizes of light source and two age groups showed that the main effect of age group was not statistically significant (p=0.87). In addition, there were no significant interactions involving age group. These results clearly indicated that the age group of the participants did not significantly affect their disturbance borderlines.
4. Category rating and reading measurements
4.1 Visual task
During the category rating and reading measurements, the screen being assessed displayed a set of fifty random words for participants to read. Random words have been used in a number of studies in vision to provide a reliable and context-free measure of visual capacity17-19. In all, ten sets of fifty words were used. The words in each set were randomly chosen from the ‘Spelling Bank: Lists of words and activities for KS2 spelling objectives, the Natural Literacy Strategy’20 which was designed for pupils aged between 8 and 11 years. To determine if the different sets of words influenced reading capacity, a pilot study was carried out with 20
participants reading the ten sets of words in randomized order. Statistical analysis (ANOVA) did not suggest that the reading speed was significantly affected by the set of the words used (p=0.92).
4.2 Participants
4.3 Procedure
The arrangement of apparatus for the category rating and reading measurements was the same as for the adjustment test (Figure 2). The category rating and reading measurementswere carried out together in the same experimental session. The experiment was divided into 16 blocks, corresponding to the 16 combinations of display screen, size of light source and viewing angle. The
measurements were made for seven display screens, each screen being examined for two sizes of light source (1° and 10°). These 14 combinations were examined at a 15° viewing angle. Two more combinations using a 30° viewing angle were added in order to study the effect of viewing angle on the two interactive
whiteboards. The order of test condition combinations seen by the participants was counterbalanced. In each block, a participant was required to complete four trials of reading and rating tests with the reflection at four different luminances. These luminances were 2000, 5000, 10000 and 20000 cd/m2 for the 1° source and 500, 1000, 3000 and 5000 cd/m2 for the 10° source. The order of the four luminances was also counterbalanced. The test was then repeated with other combinations until all sessions were done. There were 16 blocks or 64 (16x4) trials in total which took about 2 hours to complete.
To start the reading measurement, the experimenter set the light box luminance to a predetermined level. Once the participant was ready, he or she was instructed to click a mouse connected to a computer controlling the screen under test. Three countdown slides appeared, followed by a slide of the 50 words cued with a ‘beep’ sound. The participant then started reading aloud through the words as quickly as he or she could. If any word was read incorrectly, the experimenter gave an immediate signal that the participant must re-read the word again. Reading time for the set of 50 words was measured using a stopwatch.
• Can you see any reflection on the screen? Yes / No
Participants reported whether they could see reflection on the screen on test. If the reflection outline was not well-defined but the participants could notice that there was a brighter area on the display screen, they were instructed to answer ‘Yes’.
• Please rate the disturbance of the reflection while reading the text.
Participants gave a ‘Disturbance’ rating from 1 (very disturbing) to 6 (not at all disturbing).
• Please rate the acceptability of the contrast of the text shown on the screen.
Participants gave a ‘Contrast’ rating from 1 (highly unacceptable or poor to read) to 6 (highly acceptable or good to read). Participants were told to base their contrast ratings only on the part of the text that coincided with reflection.
• Please rate the clarity or distinctness of the text shown on the screen.
Participants gave a ‘Clarity’ rating from 1 (hazy or very blurred) to 6 (focused or very sharp). Participants were told to base their clarity ratings only on the part of the text that coincided with reflection.
Note that in a pilot test it was found that the reflection caused by the 1° light source was too small for an accurate assessment of the contrast and clarity of the text to be made. Therefore, for the combinations including the 1° source, the participants were required to give a rating for disturbance of the reflection only.
Having finished the reading speed measurement, answered the Yes/No question, and given the category ratings, the participant informed the experimenter who then adjusted the light box luminance to the next predetermined level and let the participant click a mouse to start a new trial. This procedure was repeated until the reading and rating measurements were completed at four luminances for the given combination of light source size, viewing angle and display screen. After that the experimenter told the participant to rest their eyes while another block of trials was prepared. This process was repeated until all the experimental combinations had been examined.
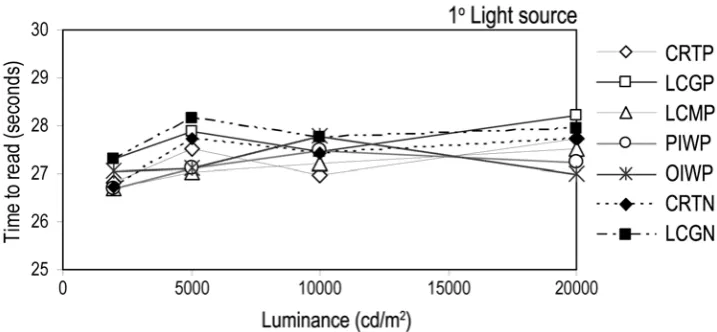
In the reading test, the participant responses to screen reflections were measured by the time taken to read aloud 50 random words which is the reciprocal of the reading speed. Figures 6 and 7 show the mean reading times for the different screens plotted against the luminances for the 1° and 10° light sources, respectively. It can be seen that as the luminance of the reflected light source increased, the mean reading times changed only slightly over a wide range of luminances for both sizes of light source and all screen types. Statistical analyses using ANOVA for the effects of screen types and luminance were carried out for the 1° and 10° light sources separately because different sets of four luminances were used for the two sizes of light source. The only statistically significant effect found was a main effect of luminance for the 1° source (p<0.01), this effect being a tendency to shorter reading times with higher luminances.
For the interactive whiteboards which are normally viewed from a variety of angles, the effect of viewing angle on reading time was investigated using a repeated measures ANOVA with three independent variables of screen type (2 levels), angles of viewing (2 levels) and luminance (4 levels). The only statistically significant effect was a main effect of viewing angle (p<0.01). Specifically, the mean time taken to read the words when the screen was viewed at 15° was significantly less than the mean reading time when the screen was viewed at 30° from the normal to the screen. In other words, the reading speed was higher at the smaller viewing angle. It maybe that this effect was caused by the increase in difficulty of reading text as the angle from the display normal increased rather than any effect of disturbing reflections.
4.5 Category rating results
percentage of participants noticing reflections ranged between 60% and 80%, depending on the size and the luminance of the light source.
Figures 8 and 9 show the mean ratings of disturbance for all the screens plotted against luminance, for the 1º and 10º light sources, respectively. Figures 10 and 11 shown the mean ratings of contrast and clarity, respectively, for all the screens, plotted against luminance for the 10º light source. All these figures have a common trend: The mean ratings decrease in a non-linear manner as the luminance of the reflected light source increases. Wang observed a similar non-linear trend in his study which also used the category rating method11.
It is apparent from Figures 8 to 11 that screens with different optical properties decline at different rates with increasing luminance. For screens with a more matt finish (LCMP, PIWP), the mean ratings decreased only a little with increasing luminance but screens with a gloss finish (CRTP, LCGP, OIWP, CRTN, LCGN), showed a greater decline in mean ratings with increasing luminances. This suggests that the relationship between the mean ratings and the luminance of the light source is associated with the reflection characteristics of display screens. For screens with similar reflection properties but different display polarities (i.e. CRTP vs. CRTN or LCGP vs. LCGN), the reduction in mean ratings for the different polarities showed a similar trend but when seen in positive polarity the mean ratings were better than for the same screens seen in negative polarity, under the same lighting conditions. This also suggests the influences of reflection properties as well as display polarity on acceptability of visual conditions at display screens.
Figure 12 compares the mean disturbance ratings obtained using two different sizes of light source, both at 5000 cd/m². It can be seen that the mean disturbance ratings for all screens decreased as the size of the reflected light source increased.
Figure 14 compares the mean disturbance, contrast and clarity ratings for the seven screens using the 10° light source at four different luminances. It can be seen that at the lowest luminance (500 cd/m²), where the mean disturbance, contrast and clarity ratings were high on the 6-point scales, the three ratings were very similar. As the luminance increased, differences between the disturbance, contrast and clarity ratings became apparent for all seven display screens but it is obvious that the disturbance rating was typically lower than the contrast and clarity ratings.
Analysis using Pearson’s correlation coefficient found very strong correlations between the disturbance and contrast rating (r=0.98, p<0.01), the disturbance and clarity ratings (r=0.95, p<0.01), and the contrast and clarity ratings (r=0.98, p<0.01). The significant correlations between the three category ratings suggest that it should be possible to use just one category rating (e.g. disturbance) to predict the other two ratings (e.g. contrast and clarity) with reasonable accuracy. Since the rating results suggest that the disturbance was the most sensitive criterion, it is likely that in the condition where the screen reflection becomes just disturbing, the contrast and clarity of the text would still be acceptable to users. This finding is consistent with that from the adjustment test which supports the idea of using the disturbance of the reflection as the main criterion to determine the luminance limit of the light source for environments where display screens are used. For this reason, it was decided to use the mean disturbance ratings to study the statistical significance of lighting and display variables on subjective responses.
source size (p<0.01) and screen type (p<0.01) as well as a significant interaction between the light source size and screen type (p<0.01). This interaction shows that the disturbance rating of the various screen types was affected differently by the size of light source. The effect of viewing angle on the disturbance rating was investigated using results from the two interactive whiteboards which were tested at two viewing angles. An ANOVA using the three independent variables of screen type (2 levels), angle of viewing (2 levels) and luminance (4 levels) was carried out. The results showed that there was a significant effect of viewing angle on the disturbance rating (p<0.01) but there were no statistically significant interactions. This indicates that the influence of the angle of viewing on disturbance rating did not change when varying other variables.
5. Discussion
The results presented above raise a number of issues. First, it is necessary to consider why there is the obvious effect of reflections on the two measures of disturbance and but very little effect on reading time. Second, the extent to which the two measures of disturbance show similar patterns of effects for the same variables needs to be assessed. Third, the performance of the interactive whiteboards relative to the conventional computer display screens is of interest. Fourth, it is useful to examine what levels of disturbance would be achieved for the various screen types if the recommended luminaire luminance limits were to be applied.
5.1 Disturbance and reading time
size of visual component in this reading task was small compared to the cognitive and motor components. Second, the stimulus presented by the text might have been on the plateau of visual performance, even in the presence of reflections. The Relative Visual Performance model shows that visual performance changes very little across a wide range of visual conditions until one or other of these variables reaches a low level where the visual performance decreases rapidly21,22. The reading materials used were representative of the sizes and luminance contrasts of materials found in classrooms. It is likely that although the luminance contrast of the text was affected by screen reflections, it remained within the range where visual performance was relatively stable. Hence, the change in reading time was minimal.
The lack of effect of screen reflections on reading are consistent with the results of Wang11 and Kubota and Takahashi9 who found that some lighting-display
parameters that explained subjective responses to disturbing reflections were not significantly associated with task performance in the presence of screen
reflections. These factors included area, edge length and number of screen
reflections11 and display polarity9. It is likely that the influences of screen reflections on observer responses are more subjective than objective. The observer may find screen reflections unacceptable before there is any reduction in task performance. For example, the rating test results suggested that for the 10° light source at a luminance of 5000 cd/m² (Figure 12), reflections on some screens (CRTP, CRTN, LCGP, LCGN, OIWP) were, on average, considered disturbing. Yet, at this luminance, the difference in task performance was barely noticeable. This
suggests that lighting recommendations with regards to screen reflection should be based on the disturbance felt by users rather than task performance which is less sensitive to lighting-display conditions.
5.2 Category ratings and adjustment luminances
viewing, though this variable did not seem to significantly interact with the other lighting-display variables. Further, the effect of light source size was consistent using both methods. The disturbance for the 10º light source was greater than for the 1º light source (Figure 12) and the source luminance considered acceptable by 95% of participants was lower for the 10º light source than for the 1º light source (Table 3).
5.3 Comparison of whiteboards
One of the reasons for reopening the question of reflections from display screens was the increased use of interactive whiteboards in classrooms. The two
interactive whiteboards examined (PIWP and OIWP) were both seen in positive polarity but were widely separated in the amount of disturbance they caused. The PIWP screen was consistently better than the OIWP screen in that, for the same visual conditions, it caused less disturbance (Figure 13) and had a higher light source luminance acceptable to 95% of participants (Table 3). This difference can be explained by the reflection characteristics of the two screens. The PIWP screen has a much higher diffuse reflectance, much higher background luminance, lower specular reflectance and lower haze effect (Table 2). In fact, the diffuse reflectance of the OIWP screen is so low that it might more accurately be called a blackboard rather than a whiteboard. Despite this, it is worth noting that the levels of
disturbance and acceptable luminances for the two whiteboard screens fall within the values found for the conventional computer screens. There are conventional screens that are better and worse then either of the two whiteboards (see Table 3 and Figure 12).
5.4 Comparison with recommendations
compared with the borderline luminances obtained by the adjustment method for the 1° light source since this source is about the same visual size as ceiling luminaires when reflected from the display screen. Based on these recommended limits, for positive polarity displays, there were four display screens (CRTP, LCMP, PIWP and OIWP) with disturbance borderline luminances much higher than the prescribed limit for class I and class II screens (≤1500 cd/m²). In particular, the disturbance borderline luminance of LCMP ataround 12,000 cd/m² was more than eight times the recommended limit. In contrast, the LCGP screen (class II), was found to have a disturbance borderline luminance lower than the recommended limit. For displays in negative polarity, it was found that while the disturbance borderline of the class III CRTN screen was well above its prescribed luminance limit (≤200 cd/m²), the actual disturbance borderline of the class II LCGN screen was less than its prescribed limit (≤1000 cd/m²).
The results of the adjustment test can also be used to estimate the percentage of the people who would not be disturbed by reflections of luminaires at the LG7 recommended luminaire luminance limits. From the results obtained at the 15° viewing angle, it can be shown that at the LG7 recommended luminaire luminance limits, all or nearly all people would not be disturbed by the luminaire reflections in the following screens: CRTP (100%), LCMP (100%), PIWP (98%), OIWP (100%) and CRTN (100%). On the other hand, only about 65% of people would not be disturbed by reflections in the LCGP and LCGN screens. This means that following the LG7 luminaire luminance limits would lead to more than one third of the people using these two screens being disturbed.
about the prescribed average surface luminance (≤ 500 cd/m²). From the results obtained at the 15° viewing angle for the 10° light source, it can be shown that at the LG7 surface luminance limit (500 cd/m²), 100% of the people would not be disturbed by reflections in the CRTP, LCMP and PIWP screens. At the same surface luminance limit, around 80% of the people would not be disturbed by the reflections in the OIWP and CRTN screens. For the LCGP and LCGN screens which have high gloss surface, the percentage of people who would not be disturbed by the reflections at the LG7 limit reduces to around 65-75%.
These results demonstrate that although current lighting recommendations attempt to prescribe various luminance limits to suit different screen reflection classes, the limits do not match actual observer responses to disturbing reflections on display screens. For display screens with a low-gloss surface, the disturbance borderline luminances were higher than the guidance suggests which indicates that the luminance limit can be raised. Yet, for display screens with a high gloss surface, the current luminance limits were found to be too high to prevent disturbing reflections. This suggests that the current recommended luminance limits need to be revised to take account of developments in the optical characteristics of display screens.
6. Modelling maximum source luminances
The results of the adjustment method allow the development of a model to predict luminaire luminance at the disturbance borderline. To select the parameters to be used in the model, a large number of lighting–display variables were studied for their relationship with the luminaire luminance at the disturbance borderline for 95% of users (LA). Some of these parameters were taken from other studies of the
relationship between screen reflections and disturbance2,12. The parameters examined included specular reflectance, diffuse reflectance, blur width, effect of haze reflection, foreground luminance, background luminance, space-averaged luminance, luminance ratio, luminance contrast, display screen modulation, visual size of the reflected light source, and viewing angle from normal. Stepwise
between lighting-display parameters and the luminance at borderline may not be linear. Therefore, a number of the stepwise regressions were carried out using the base-10 logarithm of the borderline luminance (Log10LA) as the dependent variable,
as well as the borderline luminance.
Three criteria were used to identify the best model. First, the chosen model should explain the most variance in the borderline luminance using the fewest variables. Second, the direction of the relationship between each variable in the model and the outcome should not contradict the results without a logical explanation. Third, the model should work for all the screen types and for both display polarities. Based on these three criteria, a model using four variables was found. The four variables were:
• Specular reflectance of the display surface for the particular size of light source (ρs).
• The effect of haze reflection (H).Haze reflection is the third component of
reflection that causes blurry reflection that can be seen surrounding the specular component. The effect of haze reflection (H) parameter is adapted from the blur effect parameter proposed by Howlett15. The effect of haze reflection can be calculated using the parameters obtained when measuring the reflection on display screens according to British Standards 9241-7 which uses 1° and 15° light sources.
• Background luminance of the display screen in cd/m² (LB). Background
luminance of display screen gives information on the screen brightness as well as the display polarity of the display screen. This parameter can be measured following the method in BS EN ISO 9241-7:199813.
The stepwise regression process used to obtain the model is summarized in Table 4. The model is defined by Equation 5:
(
10
.
668
) (
0
.
043
) (
0
.
001
)
(
4
.
550
)
013
.
3
10
L
A=
+
−
⋅
s+
⋅
H
+
⋅
L
B+
−
⋅
Ω
Log
ρ
[5]
Where: LA = Disturbance borderline luminance (cd/m²)
ρs = Specular reflectance for the particular size of light source
H = Effect of haze reflection
LB = Background luminance of the display screen (cd/m²)
Ω = Area that the reflected light source subtends at the viewing position (sr)
This model can explain up to 86% of the variance in Log10LA . The effects of the
four variables are consistent with what is known about visibility. In order to be seen, the reflection on a display screen must have a luminous contrast with its background above threshold, the threshold depending on the size of the object and the adaptation luminance. The visibility of a reflection also depends on how its edges are. Blurred edges mean the luminance profile of the reflection changes gradually, thereby reducing its perceived or subjective contrast and making it less conspicuous1. The predictors in the models affect the luminance contrast and the edge sharpness of the reflections in ways makes them logical determinants of the disturbance caused by reflections on display screens.
• Specular reflectance has a negative relationship with Log10LA (Figure 15)
because the specular reflection contributes to the brightness (and luminance contrast) of the reflections and the distinctness of their edges. When the reflection is more distinct, the minimum luminance needed to notice and be disturbed by the reflection is therefore lower.
• The effect from haze reflection relates positively with Log10 LA (Figure 15)
• Background luminance of display screen has a positive relationship with
Log10LA (Figure 16) because the increased background luminance reduces the
luminous contrast between the reflection and the background which makes the reflection less conspicuous and disturbing. The luminance of the source of the reflection therefore can be higher. The behaviour of the background luminance in the model justifies how display screens in positive polarity with higher background luminance (e.g. 100 cd/m²) are less sensitive to reflections than the display screens in negative polarity with lower background luminance (e.g. 0.1 cd/m²).
• The size (area) of the reflected light source relates negatively withLog10LA
(Figure 16). Increasing the size of the reflection reduces the contrast threshold for seeing the reflection. This in effect lowers the luminance of the reflected source that the observers find disturbing.
Figure 17 shows the predicted log luminance at disturbance borderline plotted against the actual log luminance at disturbance borderline satisfied by 95% of participants in the adjustment test. The model is able to predict the luminance at the disturbance borderline for a variety of screens in our test with high accuracy (r²=0.86). The r² values for individual screens vary between 0.73 and 0.99.
7. Modelling disturbance rating
instead of the ratings from individual participants to reduce variance within the sample. Table 5 summarizes the hierarchy in the stepwise regression analysis. It can be seen that the inclusion of each successive variable significantly improves the variance of the disturbance rating accounted for by the model. With five predictors (specular reflectance, logarithm of the luminance of the light source, haze, area of the light source and background luminance), the goodness-of-fit of the model was r²=0.85. The model is given by Equation 6. Note that a higher disturbance rating means a less disturbing screen reflection.
(
s) (
Log
L
A) (
H
) (
) (
L
B)
Rating
=
10
.
277
+
−
22
.
263
⋅
ρ
+
−
1
.
515
⋅
10+
0
.
083
⋅
+
−
45
.
255
⋅
Ω
+
0
.
0014
⋅
[6]
The behaviour of the model can be seen from the regression coefficients in Equation 6. The disturbance rating increases (i.e., the reflections become less disturbing) as ρs decreases, Log10LAdecreases, Ω decreases, H increases and LB
increases. The directions of effect between each predictor and the disturbance rating are consistent with how human visual system functions. Disturbance by screen reflection depends on the visibility of the reflections to observers. Specular reflectance contributes to the brightness of reflections and the sharpness of their edges. More specular reflectance means more luminance contrast between the reflection and the display background and higher retinal image quality of the reflections. The reflections are thus more visible and disturbing to observers (i.e. lower rating). The effect of haze reflection contributes to the blurriness of the reflections, which reduces the perceived contrast of the reflection. Therefore more haze reflection makes the reflections less disturbing to observers (i.e. higher rating). Background luminance determines the state of the adaptation of the visual system and the luminance contrast between reflections and display background. A higher background luminance means a lower luminance contrast and less
Figure 18 shows the predicted disturbance rating plotted against the actual mean disturbance rating obtained from the experiment. The variance explained is r²=0.85 for the analysis with all screens included. For individual display screens, r² values vary between 0.71 and 0.93.
8. Applications of the models
There are a number of applications for the models in lighting design, both specific and general. An obvious specific use of the models is identification of the
appropriate lighting to match chosen or existing display screens. If the optical properties of the display screens are known or can be measured, for a given specular reflectance (ρs), effect of haze reflection (H) and background luminance
(LB), the models can be used to determine the limit of luminaire luminance (LA) that
can be used without producing disturbing reflections, for a given size of light source (Ω). For example, for a glossy LCD with ρs of 0.033, H of 1.31 and LB of 250 cd/m²,
the permissible luminance for a circular luminaire with a diameter subtending 1° (Ω =2.39*10-4 sr) is around 884 cd/m². It is worth noting that both models can be used in this way, the maximum luminance model can be used directly while the category rating model can be used indirectly by assuming an acceptable value of the mean disturbance rating. For guidance, a comparison between the results from the luminance adjustment test and the category rating test revealed that, at the disturbance borderline where 95% of the people were not disturbed by the
reflection, the disturbance rating was between 5 and 5.5, depending on the size of the light source23. The standard rating can be set lower on the scale but the percentage of people disturbed by the reflection will be increased.
One benefit of these models is that they allow a trade-off between the luminaire luminance limit and the size of the light source. Therefore on the condition that the luminaire has a high luminance, the appropriate size of the luminaire can be calculated in order to keep the reflection from being disturbing. Reduction of the apparent size of the luminaire can be achieved by locating it further away from the display screen, using appropriate louvres or by shielding the luminaire.
borderline luminaire luminance so that the lamps are dimmed accordingly and disturbing reflections are avoided. It should be noted that the models were
developed in experimental settings using a luminaire with uniform luminance, as is required by BS EN ISO 9241-7:199813 and BS EN ISO 13406-2:200214 to test screen reflection, whereas real luminaires often have a range of luminances. In order to ensure that disturbing reflections are avoided, it is recommended to consider the worst case and apply the model on that basis. That is, when using the model to determine the permissible luminaire luminance (LA), the outcome should
be treated as the maximum or the peak luminance of the luminaire that can be used for the specified screen. The most disturbing reflection comes from the light source with largest visual size and highest luminance. If the reflection coming from this light source is not disturbing, the reflections of other sources with smaller visual sizes and lower luminances are unlikely to be disturbing.
Another specific application of the models is the identification of the appropriate display screens to match existing lighting: For a given average luminance and size of light source, the models can be used to determine suitable combinations of display screen properties. Since the models are based on luminance, it is a relatively easy task to quantify any existing luminous environment using a
luminance meter or HDR camera system. The light source in the models does not have to be a luminaire, but may be generalised to other bright surfaces seen reflected in the display screen or even windows. Again, it should be noted that the models were developed based on a single luminaire of a certain size whereas a real room often has more than one light source and their visual sizes vary. To apply the models to a real room, it is recommended to consider the worst case and then use the model to find out display screen properties to suit that situation. The most disturbing reflection will be experienced when looking at a screen with a low background luminance and a high specular reflection and little haze effect. If the reflection seen with this screen is not disturbing, it is unlikely that reflections from other screens will cause disturbance.
these recommendations could be easily updated as screen technology changes. An alternative general approach in which the models would be useful would be to identify what screen types are most suitable for use with particular types of lighting.
9. Conclusions
The results presented in this paper have shown that the recommended luminaire luminance limits in current lighting guidance cannot ensure that disturbing screen reflections are prevented in all types of screen. For some screen types, including the interactive whiteboards now widely used in classrooms, the current
recommendations for luminaires are too strict whilst for others, they are too lax. Partly, this is because of the rapid development in screen technology and partly because of the need for recommendations to be simple to understand. To rectify this situation, the results have been used to construct two empirical models. One model expresses the relationship between four variables related to the lighting and the screen characteristics (size of light source and specular reflectance, effect of haze reflection and background luminance of the screen) and the luminance of the light source that would be acceptable to 95% of observers when reflected in the screen. The other expresses the relationship between five variables (luminance and size of light source and specular reflectance, effect of haze reflection and background luminance of the screen) and the level of disturbance expressed by observers on a six point rating scale. Both models can be used to assign luminaire luminance limits to ensure disturbing reflections are not seen in specific screens or to identify which screens can be used with specific lighting without disturbing reflections. Given information about a range screen types currently in use, the models could also be used as the basis for generating more general
recommendations on luminaire luminance limits, limits that could easily be updated as display technology changes.
However, before any of this can be done there is a need for independent testing and hopefully, validation of the models. The models have been developed from the data reported here so they can be expected to fit these data well. What is
than those tested here and for those predictions to be compared with actual
measurements of the 95% disturbance borderline or the mean rating of disturbance made by other observers. Some validation of the disturbance rating model was carried out by using the model to predict the conspicuity rating of screen reflection collected in a previous study by Miller24. To do this required estimation of the effect of haze reflection (H) from the blur width of the test screens measured by Miller. It was found that the R2 between the predicted disturbance rating and the actual conspicuity rating varied between 0.70 and 0.90 depending on the type and polarity of the screen. This suggests that the predictors used in the model can actually predict subjective responses to reflections on display screens in an independent set of data, although further tests are needed that actually use measured values of the variables rather than estimated values.
As well as different screen types, the predictions of the models should be tested with more people and for real luminaires with non-uniform luminances. This latter factor might indicate how to determine the effective size of the luminaire as regards the luminances likely to cause disturbing reflections when the luminaire luminance is not uniform. At the very least it would suggest whether or not further work is needed to establish how to quantify the effective area of a luminaire as a source of disturbing reflections.
Acknowledgements
References
1. Rea MS. Solving the Problem of VDT Reflections. Progressive Architecture
1991; 35-40.
2. Lloyd CJ, Mizukami M, Boyce PR. A preliminary model of lighting-display interaction. Journal of the Illuminating Engineering Society 1996; 25(2): 59-69. 3. Kubota S. (1997). Effects of the reflection properties of liquid-crystal displays
on subjective ratings of disturbing reflected glare. Journal of Light & Visual Environment 1997; 21(1): 33-42.
4. Kelly EF, Jones GR, Germer TA. The Three Components of Reflection.
Information Display 1998; 10: 24-29.
5. Society of Light and Lighting. Lighting guide 7: Office Lighting. London: SLL, 2005.
6. British Standards Institution. BS EN 12464-1:2002 Light and Lighting. Lighting of Work Places: Indoor Work Places, London: BSI, 2002.
7. Illuminating Engineering Society of North America. ANSI/IESNA RP-1-04
American National Standard Practice for Office Lighting. New York: IESNA, 2004.
8. Hentschel HJ, Klein E, Leibig J, Roll KF. Energy-effective direct/indirect office and VDU-lighting systems: Test and application. Journal of the Illuminating Engineering Society 1987; 16(2): 89-105.
9. Kubota S, M Takahashi. Permissible luminance of disturbing reflections of light source on CRT displays. Journal of the Japanese Illuminating
Engineering Society 1989; 314-318.
10. Pawlak U, K-F Roll. VDTs: Setting Levels for Reflected Luminance. Siemens Review 1990; 4: 27-29.
11. Wang X. An Assessment of Reflected Images in a VDT Screen. Master of Science Thesis, Rensselaer Polytechnic Institute, 1996.
12. Miller NJ, Boyce P, Ngai PY. A metric for judging acceptability of direct luminaires in computer offices. Journal of the Illuminating Engineering Society
2001; 30(2): 12-29
14. British Standards Institution. BS EN ISO 13406-2:2001 Ergonomic
requirements for office work with visual displays based on flat panels – Part 2: Ergonomic requirements for flat panel displays. London: BSI, 2002.
15. Howlett O. Reflectance characteristics of display screen equipment: application to workplace lighting design. Lighting Research and Technology
2003; 35(4): 285-296.
16. Pheasant S. Ergonomics: Standards and guidelines for designers. Milton Keynes, British Standards Institution, 1987.
17. Bailey I, J Lovie. The Design and Use of a New Near-Vision Chart. American Journal of Optometry & PhysiologicalOptics 1980; 57(6): 378-387.
18. Legge GE, Ross JA, Luebker A, Lamay J. Psychophysics of reading – VIII. The Minnesota low-vision test. Optometry and Vision Science 1989; 66: 843-853.
19. Lovie-Kitchin JE, Bowers AR, Woods RL. Oral and silent reading performance with macular degeneration. Ophthalmic and Physiological. Optics 2000; 20(5): 360-370.
20. Department for Education and Skills. Spelling bank: Lists of words and activities for the KS2 spelling objectives. [online] Department for Education and Skills. Available from:
http://ww.standards.dfes.gov.uk/primary/publications/literacy/63313/ [Accessed 1st August 2008].
21. Rea MS. Toward a model of visual performance: foundations and data,
Journal of the Illuminating Engineering Society 1986; 15(2): 41-58.
22. Rea MS, Ouellette MJ. Relative visual performance; a basis for application,
Lighting Research and Technology 1991; 23(3): 135-144.
23. Ramasoot T. Investigation of Lighting and Disturbing Reflections on Display Screens: A New Model for Judging Acceptability. PhD Thesis. Sheffield: The University of Sheffield, 2010.
Table 1 Description of the display screens and polarity conditions used.
No. Description of screen Initialism
1 Viglen 17” CRT display screen in positive polarity. CRTP
2 Sony VGN-NR21M laptop with 15.4” X-black LCD widescreen with anti-reflective treatment and glossy surface, in positive polarity.
LCGP
3 Viglen TS700 17” LCD display screen with matt anti-glare surface, in positive polarity.
LCMP
4 Front-projection interactive whiteboard system: 48” SMART Board 640 Becta and Epson EMP-S5+ LCD projector. The projector has image brightness of 2000 ANSI lumen. The projection interactive whiteboard was used in positive polarity.
PIWP
5 Flat-screen interactive whiteboard system: NEC 42XP10 42” Plasma (PDP) screen with SMART PX342 overlay on the top to make the screen surface interactive. The overlay interactive whiteboard was used in positive polarity.
OIWP
6 Viglen 17” CRT display screen, similar to a screen (1) but in negative polarity.
CRTN
7 Sony VGN-NR21M laptop with 15.4” X-black LCD widescreen, similar to a screen (2) but in negative polarity.
Table 2 Summary of the display screen reflection properties.
Display screen CRTP LCGP LCMP PIWP OIWP CRTN LCGN
Diffuse reflectance (ρd) 0.0587 0.0142 0.3334 0.9414 0.0582 0.0587 0.0142
Properties at 15° from display normal
Background luminance (LB) 77.51 146.30 188.00 409.40 90.45 0.05 0.13
Foreground image luminance (Lf) 1.49 1.05 1.88 13.12 2.53 74.50 142.30
Specular reflectance for 1° source (ρs) 0.0050 0.0382 0.0004 0.0001 0.0052 0.0050 0.0382
Specular reflectance for 10° source (ρs) 0.0272 0.0438 0.0321 0.0271 0.0912 0.0272 0.0438
Specular reflectance for 15° source (ρs) 0.0333 0.0442 0.0392 0.0370 0.1025 0.0333 0.0442
Table 3 Disturbance borderline luminances of seven display screens. Viewing angle Light source Disturbance borderline criterion
Positive Polarity Negative
polarity
CRTP LCGP LCMP PIWP OIWP CRTN LCGN
15° 1°
95% satisfied
observers 2676 720 12633 3387 2380 592 427 Mean 14110 7387 23935 21885 16265 11800 8250 STDEV 8779 8818 4119 7232 8534 8965 10353 15° 10° 95% satisfied
observers 963 326 1754 645 361 349 316
Mean 4069 2016 7641 5530 1642 2160 1490 STDEV 3071 2505 4217 4079 2234 2767 1910 15° 15° 95% satisfied
observers 687 334 1154 n/a* n/a* 309 306 Mean 2935 2153 5334 n/a* n/a* 1722 1340 STDEV 2719 3118 3543 n/a* n/a* 1980 1780
30° 1°
95% satisfied
observers 1762 451 14742 4153 3106 709 399 Mean 13239 6391 24100 22627 16624 9610 6648 STDEV 8993 8910 3326 6480 8080 9048 9516 30° 10° 95% satisfied
observers 950 348 1836 494 345 336 319
Mean 3773 1440 6771 5017 1642 2177 1082 STDEV 3029 1758 3625 3573 2422 2482 1352 30° 15° 95% satisfied
Table 4 Summary of the stepwise regression process of the models to predict luminaire luminance at the disturbance borderline.
Model R R² R² Change p
Specular reflectance 0.701 0.491 0.491 <0.01
Specular reflectance, haze, 0.877 0.770 0.278 <0.01
Specular reflectance, haze, background luminance
0.908 0.824 0.054 <0.01
Specular reflectance, haze, background luminance, area of light source
Table 5 Summary of the stepwise regression process of the model to predict the disturbance rating.
Model R R² R² Change p
Specular reflectance 0.595 0.353 0.353 <0.01
Specular reflectance, Log10LA, 0.750 0.562 0.209 <0.01
Specular reflectance, Log10LA, haze, 0.850 0.723 0.161 <0.01
Specular reflectance, Log10LA, haze, area
of light source
0.910 0.828 0.105 <0.01
Specular reflectance, Log10LA, haze, area
of light source, background luminance
Figure 1 Diffuse, specular and haze components of screen reflection.
Figure 3 Section through the light box.
[image:39.595.114.482.423.597.2]Figure 5 Luminances at the disturbance, contrast and clarity borderlines tested with the 10° light source at 15° viewing angle, showing the luminances satisfactory to 95% of participants.
Figure 7 Mean time taken by participant to read aloud 50 random words on 7 display screens, tested with the 10° light source.
Figure 8 Mean disturbance rating of seven display screens, tested with the 1° light
Figure 9 Mean disturbance rating of seven display screens, tested with the 10° light source.
[image:42.595.118.471.434.641.2]Figure 11 Mean clarity rating of seven display screens, tested with the 10° light source.
[image:43.595.112.385.427.662.2]Figure 15 Specular reflectance plotted against the predicted luminance at the disturbance borderline for two sizes of light source, 2.39*10-4sr and 2.39*10-2 sr. Each curve is for different values of haze effect, H=1, H=4 and H=8. The display background luminance is fixed at 200 cd/m².
Figure 16 Area of the reflected light source plotted against predicted luminance at the disturbance borderline for two specular reflectances, ρs=0.005 and ρs=0.01.
Each curve is for different background luminance of display screen, LB=0.1 cd/m²,
Figure 17 Predicted Log10LA plotted against actual Log10LA that satisfied 95% of
[image:47.595.122.437.418.646.2]participants in the adjustment test.