This is a repository copy of
Embodied hyperacuity from Bayesian perception: Shape and
position discrimination with an iCub fingertip sensor
.
White Rose Research Online URL for this paper:
http://eprints.whiterose.ac.uk/108439/
Version: Accepted Version
Proceedings Paper:
Lepora, N.F., Martinez-Hernandez, U., Barron-Gonzalez, H. et al. (3 more authors) (2012)
Embodied hyperacuity from Bayesian perception: Shape and position discrimination with
an iCub fingertip sensor. In: Intelligent Robots and Systems (IROS), 2012 IEEE/RSJ
International Conference on. 2012 IEEE/RSJ International Conference on Intelligent
Robots and Systems, 07 Oct - 12 Oct 2012, Vilamoura-Algarve, Portugal. IEEE , pp.
4638-4643. ISBN 978-1-4673-1737-5
https://doi.org/10.1109/IROS.2012.6385649
© 2012 IEEE. Personal use of this material is permitted. Permission from IEEE must be
obtained for all other users, including reprinting/ republishing this material for advertising or
promotional purposes, creating new collective works for resale or redistribution to servers
or lists, or reuse of any copyrighted components of this work in other works.
[email protected] https://eprints.whiterose.ac.uk/ Reuse
Unless indicated otherwise, fulltext items are protected by copyright with all rights reserved. The copyright exception in section 29 of the Copyright, Designs and Patents Act 1988 allows the making of a single copy solely for the purpose of non-commercial research or private study within the limits of fair dealing. The publisher or other rights-holder may allow further reproduction and re-use of this version - refer to the White Rose Research Online record for this item. Where records identify the publisher as the copyright holder, users can verify any specific terms of use on the publisher’s website.
Takedown
If you consider content in White Rose Research Online to be in breach of UK law, please notify us by
Embodied hyperacuity from Bayesian perception:
Shape and position discrimination with an iCub fingertip sensor
Nathan F. Lepora, Uriel Martinez-Hernandez, Hector Barron-Gonzalez, Mat Evans, Giorgio Metta, Tony J. Prescott
Abstract— Recent advances in modeling animal perception has motivated an approach of Bayesian perception applied to biomimetic robots. This study presents an initial application of Bayesian perception on an iCub fingertip sensor mounted on a dedicated positioning robot. We systematically probed the test system with five cylindrical stimuli offset by a range of positions relative to the fingertip. Testing the real-time speed and accuracy of shape and position discrimination, we achieved sub-millimeter accuracy with just a few taps. This result is apparently the first explicit demonstration of perceptual hyper-acuity in robot touch, in that object positions are perceived more accurately than the taxel spacing. We also found substantial performance gains when the fingertip can reposition itself to avoid poor perceptual locations, which indicates that improved robot perception could mimic active perception in animals.
I. INTRODUCTION
A casual observer can tell that the perceptual abilities of the most advanced robots lag far behind those of animals, which is a major bottleneck for enabling robots to interact fully with their environments. Meanwhile, in neuroscience, two lines of investigation are converging on an understanding of animal perception as statistically optimal sensory process-ing. First, perception is considered as Bayesian inference from noisy and ambiguous sensations [1], [2]. Second, the decisions resulting from this inference are considered optimal in terms of minimizing the costs of making mistakes plus the costs of waiting to gather more sensory data for improved accuracy [3], [4]. These inferential and reactive aspects of perception have been embodied in robots with biomimetic whisker sensors, using Bayesian sequential analysis to accu-mulate evidence for competing perceptual hypotheses until reaching a decision threshold on the beliefs [5], [6].
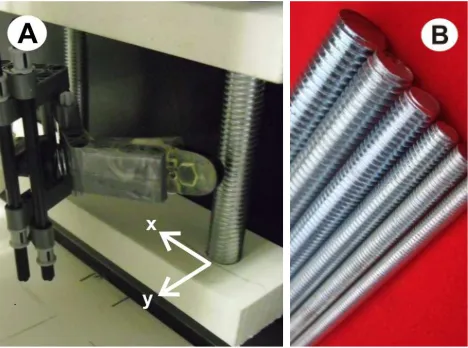
This study presents an initial implementation of this biologically-inspired framework for perception in a robot using a biomimetic touch sensor based on the human finger-tip [7] that was built for the iCub humanoid robot [8]. In do-ing so, we show that the approach applied previously to touch with whisker sensors applies also to the new problem domain of fingertip sensing, with potential applications in grasping and manipulation. To provide a standard set-up for systematic testing, the fingertip was mounted on a dedicated positioning robot (Fig. 1A) to test shape and position classification of range of cylindrical test objects (Fig. 1B). We emphasize
This work was supported by EU Framework project EFAA (ICT-270490). N. Lepora, U. Martinez-Hernandez, H. Barron-Gonzalez and T. Prescott are with the Adaptive Touch Laboratory at Sheffield, Department of Psy-chology, University of Sheffield, Western Bank, Sheffield S10 2TN, UK. Email:{n.lepora, uriel.martinez, h.barron, t.j.prescott}@sheffield.ac.uk.
[image:2.612.317.551.161.335.2]Giorgio Metta is with the Italian Institute of Technology (IIT), Italy. Email: [email protected]
Fig. 1. (A) The iCub fingertip sensor is mounted as an end-effector to an xy-table robot, which can move the finger accurately in a horizontal plane. (B) Close-up of the tactile stimuli (threaded steel rods with diameters from 4 mm to 12 mm; five were used, spaced every 2 mm in diameter).
that these are important percepts for the manipulation of objects; for example, shape discrimination is necessary to determine the grasp configuration for picking up an object, while position discrimination is necessary to appropriately position a manipulator onto an object.
There has recently been a surge in hardware development for robot touch sensing [9] accompanied by advances in tac-tile classification methods influenced by Bayesian methods from machine learning and probabilistic robotics [10], [11], [12], [13], [14], [15]. The approach to Bayesian perception in this study and related work [5], [6] differs by emphasizing the reactive aspects of decision making, rather than concentrating on the inference problem. In practise, this difference stems from the use of a threshold crossing rule on the beliefs for real-time decision making, rather than using a preset, fixed amount of data. In our opinion, utilizating the reactive aspects of perception is a necessary step to achieve robot perception comparable with that of animals.
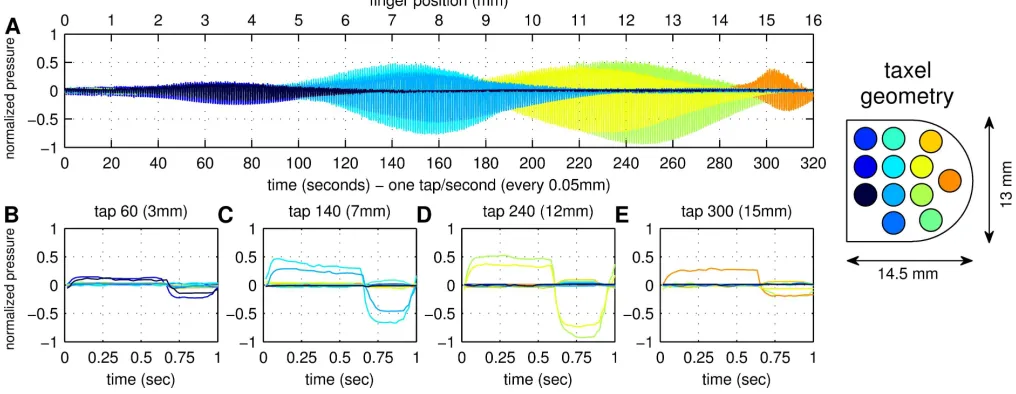
Fig. 2. (A) Fingertip pressure data recorded as the finger taps against a test rod (diameter 4 mm) at a constant frequency of 1 tap/sec. The range of finger positions spanned 16 mm over 320 s, giving 320 taps spaced every 0.05 mm. Tickmarks are shown every 1 mm displacement, or 20 taps. Data from the different taxels are represented in distinct colors depending on the taxel position shown on the diagram. (B-E) Examples of pressure data for individual taps taken from panel (A) at 3 mm, 7 mm, 12 mm and 15 mm finger displacement (tap number 60, 140, 240 and 300).
II. METHODS
A. Robot experiments with an iCub fingertip sensor
The iCub is a humanoid robot about the size of a 3 year old infant [8]. To enable the robot to grasp and manipu-late objects, touch sensors were initially integrated into its hands [7] and then later a tactile skin onto its forearms and body [16]. The iCub fingertips are 14.5 mm long and 13 mm wide with a rounded shape that resembles a human fingertip. They consist of an inner support wrapped with a flexible printed circuit board (PCB) containing twelve conductive patches for the touch sensor ‘taxels’. The PCB is covered first with a∼2 mm layer of non-conductive soft silicone foam and then with a thin layer of conductive silicone rubber. The PCB and silicone layers together comprise a capacitive touch sensor that detects pressure via the capacitance change due to compressing the foam between the conductive layers.
The present experiments test the capabilities of the iCub fingertip sensor mounted on an xy-positioning robot. This robot can move the sensor over a horizontal plane in a highly controlled and repeatable manner onto various test stimuli to 50µm accuracy (and was developed originally for testing tactile sensors based on rodent whiskers [17]). The fingertip was mounted at an angle appropriate for contacting axially symmetric shapes such as cylinders aligned along the
z-axis perpendicular to the plane of movement (Fig. 1A). Five threaded steel rods with diameters 4 mm, 6 mm, 8 mm, 10 mm and 12 mm were used as test objects (Fig. 1B). They were mounted with their axes vertically upwards but their centers offset in they-direction (by 4 mm, 3 mm, 2 mm, 1 mm and 0 mm) to align their closest point to the fingertip.
The touch data were collected while having the fingertip repeatedly tap in the y-direction onto and off each test object with rate 1 tap/sec, while moving at constant speed of 0.05 mm/sec in thex-direction across the closest face of the
object. The fingertip was angled so the rod axis lay across the fingertip (vertically across the taxels in Fig. 2), and moved so that the rod initially contacted the fingertip at its base and finally contacted only the tip. In each case, anx-range of 16 mm was considered. This gave 320 taps per object at increments of 0.05 mm. Each tap of the fingertip against the object resulted in a 1 sec time series of pressure readings for all 12 taxels covering the fingertip (Figs 2B-E). This data was sampled at 50 Hz, giving 50 samples per taxel per tap. One training and one test set was collected for each of the five rods and these data used for off-line Monte Carlo validation of the Bayesian perception.
B. Bayesian sequential analysis for perception
Here we adopt a statistical method for tactile perception based on Bayesian sequential analysis, which is closely related to a leading model of perceptual decision making in neuroscience [3], [4], [5]. The approach has two aspects: an inference part based on Bayesian filtering and a decision-making part that reacts to the inference. In this section, we describe the method of Bayesian sequential analysis, and in the following section describe how it is applied to our data. The inference part of this Bayesian model of tactile per-ception uses Bayes’ rule to update the posterior probabilities
P(cn|zt), or ‘beliefs’, for N perceptual classes cn after
receiving new measurement data zt. This is achieved by
using Bayes’ rule recursively as a Bayesian filter, with the prior given by the posterior on the previous time-step, which is combined with the present likelihoodP(zt|cn)to give
P(cn|zt) =
P(zt|cn)P(cn|zt−1) P(zt|zt−1)
. (1)
For the measurement model of the likelihoods, we assume the probability distributions P(z|cn) are identically distributed
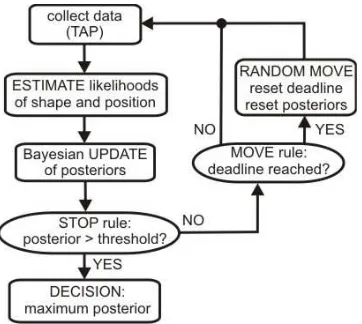
Fig. 3. Validation approach. After each tap to collect data, the perception algorithm first uses the measurement model to estimate the likelihoods of shape and position and then updates the posteriors using Bayes’ rule. If at least one posterior passes a threshold, a decision can be made. Otherwise, another tap is made, unless a deadline has been reached, in which case the finger randomly moves to another position to retry the procedure.
we drop z1:t−1 from the posteriors); the construction from
the training data is described below. The marginal probabil-ities are conditioned on the preceding measurement and are found from summing over allN classes
P(zt|zt−1) = N X
n=1
P(zt|cn)P(cn|zt−1) (2)
to give properly normalized posteriors PN
l=1P(cn|zt) = 1.
Taking a sequence of measurements z1,· · · , zt gives a
se-quence of posteriorsP(cn|z1),· · · , P(cn|zt)for each class,
which are calculated by iterating over the relations (1,2) starting from uniform priorsP(cn) =P(cn|z0) = 1/N.
The decision-making part of Bayesian sequential analysis uses a threshold-crossing decision rule on the belief, which allows the perception to be reactive to the quality of the test data and can enforce optimal balance of speed versus accuracy in the decision making [3], [4], [5], [18]. At least one posterior must cross a preset probability threshold to trigger the decision, after which the maximal a posteriori
(MAP) estimate is taken for the perceptual class:
if any P(cn|zt)> θ then c= arg max cn∈C
P(cn|zt). (3)
This decision rule implements free-response perception, in that the decision occurs at a time determined by the decision-maker. Previous robot work has demonstrated superior per-formance compared to fixed reaction time methods [5], [6]. In this study, we also consider a modification of standard sequential analysis in which null decisions are allowed if a preset ‘boredom’ deadlineD is reached before crossing the probability threshold:
if t=D then c =∅. (4) In a previous study with robot whisker sensors, we inter-preted a null decision as referring toforcedversusunforced
choices [6]. Here we make a different interpretation: if a
null decision is reported, then it signals that the present location gives a poor perception of the object and the robot should move its sensor elsewhere (Fig. 3). This is important, because past null decisions should then be included in the reaction times (rather than considering only reaction times for decisions that were made, as done previously [6]).
C. Bayesian perception applied to robot touch
The above Bayesian sequential analysis approach for robot perception was then applied to the fingertip data.
The perceptual classes denoted the cylinder being con-tacted and the position of the fingertip relative to the cylinder. To provide sufficient training data for each position class, we separated the data into 16 groups of 20 taps, each spanning 1 mm (delineated by the tick marks on Fig. 2A). Using all taps in a position class aided the robustness of the classifier, by training across the range of positions. This gave 16 position classes and 5 shape classes, or 80 classes in total.
The training data was then used to construct a measure-ment model of the likelihoods based on a ‘bag of mea-surements’ histogram approach. The histogram of pressure readingssof the training data for percept classcn defines a
sample distribution
Pk(s|cn) =
hk(s) P
shk(s)
, (5)
wherehk(s)is the number of measurement valuess in the
histogram occurring for taxel k. Altogether, 1000 samples
s were used for each taxel of each class, corresponding to 20 taps of 50 samples each. We extracted 12 histograms (one for each taxel) for each of the 80 training classes. Note that the pressure values must be binned to construct the histogram, which was implemented by uniformly partitioning each pressure range over 100 bins (see also [5], [19]).
The measurement model then gives the likelihoods for a test tap (denoted zt in the Bayesian update rule) from the
geometric mean over the sample distributions (5) evaluated over all samplessj in the test tap
P(zt|cn) =
J KqQJ j=1
QK
k=1Pk(sj|cn) (6)
whereJ = 50andK= 12are the time samples per tap and the number of taxels respectively. This model assumes a bag of measurements in which all samples are treated as indepen-dent and iindepen-dentically distributed for each taxel. The geometric mean prevents the product (6) from producing vanishingly small likelihoods by ensuring that the probabilities remain almost invariant for large sample numbers [5].
Fig. 4. Decision errors plotted against probability threshold. Panel A shows the mean absolute error for estimating rod diameter and panel B shows the mean absolute error for finger position. We distinguish fixed perception with no deadline (black lines) from when moves were allowed after a null decision upon reaching a deadline (colored lines).
Fig. 5. Decision errors plotted against reaction times. Plots are as in Fig. 4, apart from plotting the mean absolute errors against mean reaction time (by relating belief threshold to reaction time via Fig. 7B). We interpret these results as the mean real-time performance of accuracy versus reaction time.
per belief threshold) with randomly chosen test classes, the distributions of shape and position errors and reaction times could then be characterized. In general, the error distributions were near Gaussian centered on zero while the reaction time distributions were skewed as in Fig. 7. Suitable statistics to summarize the real-time performance are the mean absolute errors and the mean reaction times, which are displayed in the following results1.
III. RESULTS
A. Initial observations
Fingertip pressure data was collected for five steel rods (diameters 4 mm, 6 mm, 8 mm, 10 mm and 12 mm) by pass-ing the fpass-ingertip slowly over each rod tapppass-ing at a constant rate of once per second (see methods; configuration shown in Fig. 1). For the example data shown in Fig. 2A (4 mm diameter rod), at the start of the movement only the bottom taxels at the fingertip base are in contact (Fig. 2B), then the lower-center taxels contact and the bottom taxels detach (Fig. 2C), then the upper-center taxels contact and the
lower-1Note that the mean absolute error (rather than standard deviation) was
[image:5.612.374.494.54.175.2]chosen for ease of interpretation; note also that the standard deviation is close to the mean on the half-Gaussian of absolute errors.
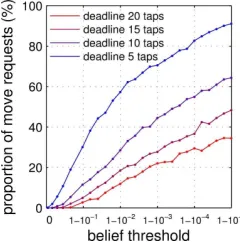
Fig. 6. Proportion of move requests plotted against probability threshold. Move requests are made after a null decision, in which the number of taps reaches a deadline without a decision being made (all posteriors below threshold). The proportion represents the number of validation trials resulting in a null decision relative to the total number of trials.
Fig. 7. Reaction times for Bayesian perception. Panel (A) shows example reaction time histograms with probability thresholds0.9(grey) and0.999
(white). Panel (B) plots the mean reaction time against probability threshold for fixed perception with no deadline (black curve) and when moves were allowed after a null decision upon reaching a deadline (colored lines).
center taxels detach (Fig. 2D) and finally only the top-most taxels at the tip of the finger contact (Fig. 2E).
Notice that the pattern of taxel pressures depends on both the curvature of the surface being contacted and the position of the fingertip over the object, permitting the simultaneous perception of object shape and location. Another key obser-vation is that each taxel has a receptive field size of about 5 mm (100 taps on Fig. 2a), with small pressure readings at the edges of this field that increase to peak in the center. The centers of the taxels are spaced about every 4 mm, so the receptive fields for different taxels overlap to permit tactile coverage across the entire fingertip. Position classes were considered here at 1 mm intervals along the 16 mm range (tickmarks on Fig. 2A), at about 25% of the taxel spacing.
B. Bayesian tactile perception from a fixed position class
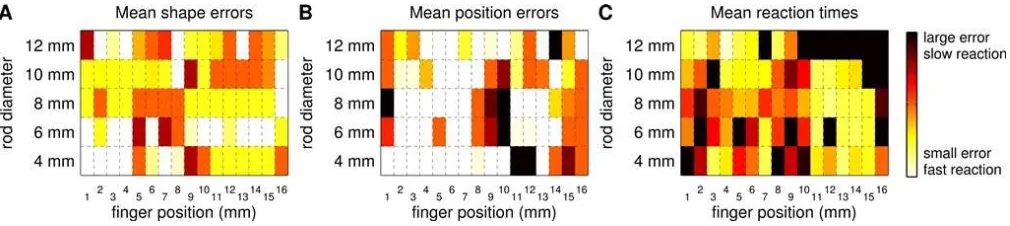
[image:5.612.315.556.239.368.2] [image:5.612.54.298.251.382.2]Fig. 8. Error and reaction times dependence on test class. Light/dark regions show position and shape classes with small/large mean errors (panels A,B) and fast/slow reaction times (panel C). Ranges encompass diameter errors between 0-4 mm (panel A), position errors between 0-2 mm (panel B) and reaction times from 0-20 taps (panel C). Results are displayed for a belief threshold of 0.9.
by when at least one of the posterior probabilities reached a preset belief threshold. The posteriors were updated using Bayes’ rule recurrently as a Bayesian filter with the priors given by the posteriors on the previous tap.
Average decision errors for perceived shape and position were examined over belief thresholds ranging from 0.05 to 0.99999 (Fig. 4; black curves). Statistically robust estimates of the mean errors were found by averaging the absolute classification errors over many test instances. These mean errors decreased steadily with belief threshold, reaching a minimum of about 2.2 mm for shape and 0.6 mm for position for thresholds above 0.9 (Fig. 4; black curves)
In accordance with the perception being freely responsive, the number of taps to reach a decision had a reaction time distribution (Fig. 7A). Increasing the belief threshold increased the mean reaction time (Fig. 7B; black curve) and decreased the decision errors. Treating this threshold as an implicit parameter gave a direct plot of decision error against mean reaction time (Fig. 5; black curves), in which for each threshold the mean decision accuracy from Fig. 4 was plotted against the mean reaction time from Fig. 7B. The resulting error plots decreased with longer reaction times, reaching their minimum values after about 5–10 taps.
The mean decision errors and reaction times were non-uniform across finger position and rod diameter, showing significant variance with test class (Fig. 8). In particular, neighboring position classes varied substantially in their classification properties, indicating a lack of overall structure in the variation of these errors. That being said, there was maybe a slight tendency for finger placements between 2– 7 mm to yield better position accuracy than elsewhere.
In summary, for the above Bayesian perception, the deci-sions of rod diameter reached an average error of about one shape class after a few taps (e.g.the 8 mm rod was commonly mistaken for a 6 mm or 10 mm rod but not for the 4 mm or 12 mm rod). Meanwhile, the decisions on position were less than the 1 mm width of a perceptual class, indicating that about half found the correct position and the other half were commonly about 1 mm out. These position errors were
≤25% of the 4 mm spacing between taxels. In consequence, the position discrimination performs at sub-taxel resolution, and thus constitutes an embodiment of hyperacuity in a biomimetic robot with brain-based perception.
C. Bayesian perception with random move after deadline
The second validation study considered tactile perception against a ‘boredom’ deadline, after which a null decision is reported and the fingertip sensor moved randomly to retry decision making at another location. The same method of Bayesian perception was used as for the fixed-position study from Sec. III-B, but with a deadline number of taps for the null decision (Fig. 3). This method can still be considered Bayesian sequential analysis, even though the standard opti-mality theorems [18] would need re-examining with respect to the costs of null outcomes. This study interprets this cost as from the accumulated delay in reaction time for the previous null results before finally making a decision.
We used random moves to re-position the fingertip because of the lack of structure in the error dependency on rod shape and location (Fig. 8). Discarding the data before the random move also simplified the validation. In general, the number of null decisions (move requests) increased as the belief threshold became closer to one and also as the deadline became shorter (Fig. 6). This behavior was expected, because more decisions should time out as the thresholds become harder to reach within a maximum allowed decision time.
The principal effect of allowing repositioning of the finger-tip is improved decision accuracy (Fig. 4; colored lines) and reaction times (Fig. 6B; colored lines). The most dramatic improvements were for the shortest considered deadline of 5 taps (Fig. 4; blue line), which reduced the average shape errors to about 1.4 mm and the average position errors to about 0.1 mm at the highest belief thresholds (compared with 2.1 mm and 0.6 mm originally). This was accompanied with an improvement in reaction time, provided the belief threshold was not too large. Both effects combined together to give a pronounced improvement in the speed-accuracy plots of decision making (Fig. 5; colored lines).
IV. CONCLUSIONS
We have implemented a brain-based framework of Bayesian perception in a robot using a biomimetic sensor based on the human fingertip. For this study, the touch sensor was mounted on a dedicated positioning robot to test its capabilities in a controlled setting (Fig. 1A). For test stimuli, we used five cylindrical steel rods with diameters ranging from 4 mm to 12 mm (Fig. 1B) offset by a 16 mm range of positions relative to the fingertip. The robot gathered sensory data by tapping its fingertip against the curved surface. These experiments were suitable for characterizing both the shape and position-sensing capabilities of the iCub fingertip, and inform about the real-time capabilities of Bayesian perception with this tactile sensor.
Using a simple ‘fixed-position’ instantiation of Bayesian perception, the fingertip sensor could reach mean accuracies of∼2 mm for the rod diameter and below 1 mm for relative fingertip-object position with just a few taps within a single position class. Given the taxel spacing was around 4 mm, the fingertip could achieve positional accuracy with mean errors less than 25% of the spatial resolution between taxels. In the biological literature, achieving a perceptual accuracy that is better than the sensor resolution is known as hyperacuity.
Progressing to a more complex reactive implementation of Bayesian perception, we found substantial improvements in shape and position discrimination when the robot could respond to the sensory data by randomly re-positioning the fingertip after a deadline. Hence, this movement strategy per-mitted an even greater degree of hyperacuity in the positional perception. The reaction time in Bayesian perception as-sessed the quality of a location for perceptual discrimination, which could be utilized to re-position the sensor for improved performance. Several other lines of enquiry remain open for improving robot perception. For example, the reactive perception considered here used random moves rather than purposively trying to improve the decision accuracy. In our opinion, significant gains could arise from allowing these movements to be guided with active perception [20], [21], such as by deciding the best move to disambiguate competing hypotheses during the perceptual process.
To the best of our knowledge, we have presented the first explicit demonstration of hyperacuity in robot touch. Hyperacuity is a generic aspect of animal perception, and while best known in vision also occurs for tactile perception. For example, Braille reading involves perceiving spatial patterns of a finer resolution than the spacing between touch receptors in the fingertips [22]. The hyperacuity in the present robot experiment was a consequence of the method of Bayesian perception being capable of utilizing the graded population response across taxels to interpolate between taxel positions. It arose from both the implementation of Bayesian perception and the morphology of the artificial fingertip sensor, coupled together by the statistics of the stimuli, and hence we refer to it as embodied hyperacuity. We expect that tactile hyperacuity will be a general phenomenon when Bayesian perception is applied to positioning tasks beyond
those considered here, and could be a key consideration in the design of tactile sensors (as it is in the composition of their biological counterparts).
REFERENCES
[1] D.C Knill and A. Pouget. The bayesian brain: the role of uncer-tainty in neural coding and computation. TRENDS in Neurosciences, 27(12):712719, 2004.
[2] D. Kersten, P. Mamassian, and A. Yuille. Object perception as Bayesian inference. Annu. Rev. Psychol., 55:271–304, 2004. [3] J.I. Gold and M.N. Shadlen. The neural basis of decision making.
Annu. Rev. Neurosci., 30:535–574, 2007.
[4] R. Bogacz, E. Brown, J. Moehlis, P. Holmes, and J.D. Cohen. The physics of optimal decision making: A formal analysis of models of performance in two-alternative forced-choice tasks. Psychological Review, 113(4):700, 2006.
[5] N.F. Lepora, C.W. Fox, M.H. Evans, M.E. Diamond, K. Gurney, and T.J. Prescott. Optimal decision-making in mammals: insights from a robot study of rodent texture discrimination. Journal of The Royal Society Interface, 9(72):1517–1528, 2012.
[6] N.F. Lepora, J.C. Sullivan, B. Mitchinson, M. Pearon, K. Gurney, and T.J. Prescott. Brain-inspired bayesian perception for biomimetic robot touch. InRobotics and Automation (ICRA), 2012 IEEE International Conference on, pages 5111 –5116, 2012.
[7] A. Schmitz, M. Maggiali, L. Natale, B. Bonino, and G. Metta. A tactile sensor for the fingertips of the humanoid robot icub. InIntelligent Robots and Systems (IROS), 2010 IEEE/RSJ International Conference on, pages 2212–2217, 2010.
[8] G. Metta, G. Sandini, D. Vernon, L. Natale, and F. Nori. The icub humanoid robot: an open platform for research in embodied cognition. In Proceedings of the 8th Workshop on Performance Metrics for Intelligent Systems, pages 50–56. ACM, 2008.
[9] R.S. Dahiya, G. Metta, M. Valle, and G. Sandini. Tactile sensingfrom humans to humanoids. Robotics, IEEE Transactions on, 26(1):1–20, 2010.
[10] Z. Pezzementi, E. Plaku, C. Reyda, and G.D. Hager. Tactile-object recognition from appearance information. Robotics, IEEE Transac-tions on, 27(3):473–487, 2011.
[11] A. Petrovskaya and O. Khatib. Global localization of objects via touch.
Robotics, IEEE Transactions on, 27(3):569–585, 2011.
[12] R. Platt, F. Permenter, and J. Pfeiffer. Using bayesian filtering to localize flexible materials during manipulation. Robotics, IEEE Transactions on, 27(3):586 –598, 2011.
[13] N. Wettels and G.E. Loeb. Haptic feature extraction from a biomimetic tactile sensor: Force, contact location and curvature. InRobotics and Biomimetics (ROBIO), 2011 IEEE International Conference on, pages 2471 –2478, 2011.
[14] S. Decherchi, P. Gastaldo, R.S. Dahiya, M. Valle, and R. Zunino. Tactile-data classification of contact materials using computational intelligence.IEEE Transactions on Robotics, 27(3):635–639, 2011. [15] J.A. Fishel and G.E. Loeb. Bayesian exploration for intelligent
identification of textures. Frontiers in Neurorobotics, 6, 2012. [16] A. Schmitz, P. Maiolino, M. Maggiali, L. Natale, G. Cannata, and
G. Metta. Methods and technologies for the implementation of large-scale robot tactile sensors.Robotics, IEEE Transactions on, 27(3):389 –400, 2011.
[17] M. Evans, C. Fox, M. Pearson, and T. Prescott. Tactile discrimination using template classifiers: Towards a model of feature extraction in mammalian vibrissal systems. From Animals to Animats 11, pages 178–187, 2010.
[18] A. Wald and J. Wolfowitz. Optimum character of the sequential proba-bility ratio test.The Annals of Mathematical Statistics, 19(3):326–339, 1948.
[19] N.F. Lepora, M. Evans, C.W. Fox, M.E. Diamond, K. Gurney, and T.J. Prescott. Naive bayes texture classification applied to whisker data from a moving robot. Neural Networks (IJCNN), The 2010 International Joint Conference on, pages 1–8, 2010.
[20] R. Bajcsy. Active perception. Proceedings of the IEEE, 76(8):966– 1005, 1988.
[21] T.J. Prescott, M.E. Diamond, and A.M. Wing. Active touch sens-ing. Philosophical Transactions of the Royal Society B: Biological Sciences, 366(1581):2989–2995, 2011.