This is a repository copy of Buses and the Economy II.
White Rose Research Online URL for this paper: http://eprints.whiterose.ac.uk/79728/
Monograph:
Johnson, DH, Mackie, P and Shires, J (2014) Buses and the Economy II. Report. Greener Journeys
[email protected] https://eprints.whiterose.ac.uk/
Reuse
Unless indicated otherwise, fulltext items are protected by copyright with all rights reserved. The copyright exception in section 29 of the Copyright, Designs and Patents Act 1988 allows the making of a single copy solely for the purpose of non-commercial research or private study within the limits of fair dealing. The publisher or other rights-holder may allow further reproduction and re-use of this version - refer to the White Rose Research Online record for this item. Where records identify the publisher as the copyright holder, users can verify any specific terms of use on the publisher’s website.
Takedown
If you consider content in White Rose Research Online to be in breach of UK law, please notify us by
Buses and the Economy II
Main Report
Daniel Johnson, Peter Mackie and Jeremy Shires
Institute for Transport Studies
2
Executive Summary
This study is a follow-up to our 2012 report for Greener Journeys on Buses and Economic Growth. Now, we drill deeper so as to improve understanding of the links between bus service and the wider economy and how these linkages could be taken into account in bus policy analysis. Among the key facilitating roles of the bus are: providing access to jobs, access to shopping and leisure facilities especially in town and city centres and as a form of social insurance fall back.
Some highlight results are:-
There is a significant relationship between accessibility by bus and employment. On the basis of our model results, if bus journey times for commuters in England could be improved by 10%, this would be associated with over 50,000 more people in employment.
In a policy test, allowing for this employment impact would increase the benefits of bus accessibility improvements by around 9-10% on top of their direct transport benefits.
People in urban areas who are currently unemployed and seeking work depend heavily on the bus for access to employment. This is particularly the case for younger people, females, those with no car available and those with lower skills . In our sample, 57% did not have a full car or motorcycle driving licence and a similar proportion would depend on bus to get to work.
The bus is a vital artery for shopping trips. In our s ample survey, 70% of non-food shopping trips are to town/city centres with 30% out of town. Bus has the largest market share (one third) of retail/expenditure trips to city centres. Bus users
contribute 22% of expenditures on non-food and entertainment across all locations. The bus has a social insurance dimension. We studied the value which local residents
in Market Drayton, Bridgnorth and Much Wenlock place on the existence of the hourly bus services linking them to the county town of Shrewsbury. We found people place a significant value, on average £2.50 per household per week, on the existence of the bus service over and above the value of the trips they actually make. This is the value to them of having the option available of using the bus, plus any social or community value they have on behalf of others.
In summary, the contribution of the bus to the working of the economy and society is multi -faceted. The bus is not simply a transport mode it is more than that.
3
1.
Introduction
In 2012, we carried out a piece of work for Greener Journeys on Buses and Economic Growth (Mackie, Laird and Johnson, 2012). In that work, we put forward and evidenced the proposition that bus service is multi-dimensional in its contribution to spatial public policy. We found that
2.5 million commuters use the bus to get to work with a further 1 milli on using bus as a back-up mode. Around 400,000 people are either in a job at all or in a better more productive job as a result of the access to jobs which bus service provides. There is a labour market dimension to bus policy.
Those who are reliant on the bus network for access to the labour market tend on average to be relatively disadvantaged. There is an equality of opportunity dimension to bus policy seen also in accessibility to education and training.
Bus service supports the vitality of town and city centres through spending on shopping and leisure services of £22bn in those places. There is a locational dimension to policy, supporting the benefit to society of strong attractive urban centres accessible to all.
People are willing to pay something to have a bus service available on tap over and above what they actually pay in fares. This is the option value, or social insurance dimension of bus service.
Following that study, Greener Journeys and the Department for Transport commissioned ITS to undertake further work with two main goals. The first was to drill deeper so as to
understand better the dimensions of bus service and its links to the wider economy which we had identified in the 2012 study. The second was to examine how the knowledge gained at the macro level could be developed and applied to the world of specific bus improvement projects and their appraisal.
In section 2 we turn the spotlight on to the unemployed and the role which bus service can play in helping to get people into jobs. In section 3 we look in more depth at the nature of the retail and entertainment market, competition between locations and the role bus service plays in providing access for all to town and city centres. In section 4 we report on a case study of two rural (or more properly town to market town passing through small communities) services, their pattern of usage, and the social insurance value placed on those services by users and non-users. In section 5, we return to the question of the labour
D
impacts in its guidance. In section 6, we take further the theme of the relationship between accessibility and employment and seek to develop a multivariate model to test the
4
to see what difference taking account of employment effects makes to appraisal. Section 8 concludes.
This main report is backed up by six theme reports corresponding to the sections of the main report which provide more detailed description and analysis for those readers who want the full story. In this report, our concern is to provide a clear and balanced exposition of the findings of the study; issues relating to sampling, statistical confidence, the reasons for choosing particular model forms and the caveats associated with results are discussed more fully in the supporting papers.
The project was funded jointly by Greener Journeys and the Department for Transport with an additional contribution from PTEG (who contributed to the surveying in Task 4). We are grateful for the moral and practical support of the Steering Group and of Claire Haigh (Greener Journeys) ,Rishi Mandavia (Department for Transport) and Pedro Abrantes (PTEG). We also thank Rachel Moyce D T D
accessibility data in suitable form, and we thank our contractors Accent Marketing and Research and Research Now for their efficient data collection work on our behalf. The study has been carried out by a team of Daniel Johnson, Peter Mackie, Jeremy Shires , Tony Fowkes and Phill Wheat of ITS, University of Leeds and Marco Ercolani of University of Birmingham. Responsibility for the analysis, interpretation and findings of the study is ours alone, and the views expressed here are not necessarily those of Greener Journeys or the Department for Transport.
2.
Bus service and jobseekers
The purpose of this strand of the research is to examine the role bus service plays in enabling people to participate in the world of work. Entering the labour market is not costless. First of all people have to engage in a search process. Then, if and when they are successful, they give up their time, spend time and money on travelling to their job and may incur other costs such as childcare. There are few national data sources which shed light on these issues. Therefore, we interviewed 912 unemployed1 individuals attending Job Centre Plus offices in June/July 2013 at a number of sites in cities2 in Britain outside London. Although our sample was not based on random sampling, nor was it nationally representative, it does facilitate comparisons between different sub groups in key dimensions. Extra caution needs to be applied to questions dealing with perception or attitudes from unemployed respondents who may be seeking to justify their lack of employment and may have difficulty with some questions.
1
Defined as not in paid work, seeking work and claiming benefits
2
5
Some very basic findings conditioned many of the results. 57% of the sample did not have a full car or motorcycle driving licence and 77% had no regular access to a car, van or
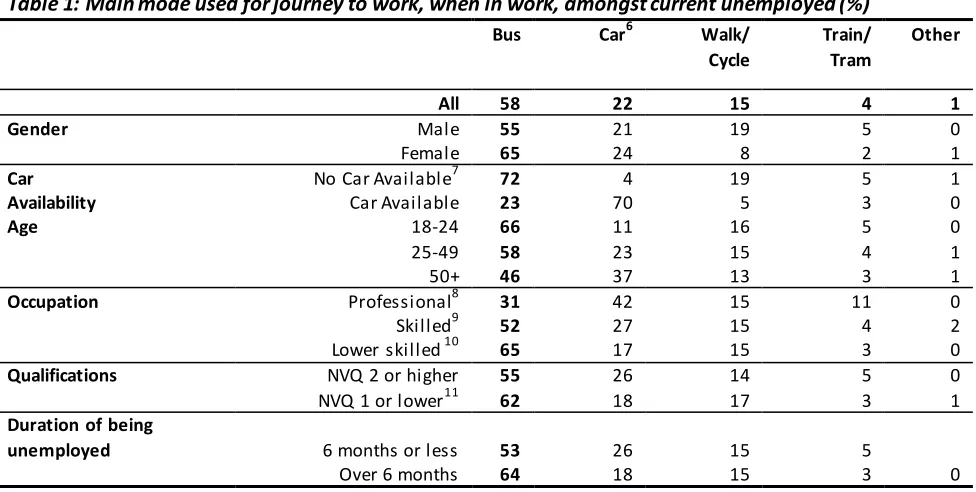
[image:6.596.69.557.306.552.2]motorcycle. Most of the sample had relatively recent experience of working . Table 1shows the main mode which the respondents reported using for travel to work Overall, 58% of our sample report that they use buses when in work3 - this figure rises to 72% for those without car availability. Our earlier study of the employed4 looked at National Travel Survey5 (NTS) respondents who use bus as their usual mode for travel to work. Focusing on those in metropolitan or dense urban areas outside London for 2009-10, this proportion in the NTS was 11%, rising to 38% for those without car availability. Accepting that our sample is small and the question not directly comparable, the evidence suggests the currently unemployed are more dependent on bus than the population at large for access to jobs. The level of dependence is even higher amongst females, those with no car available, younger and the lower skilled. 34% of the sample said they always used bus for travel to work.
Table 1: Main mode used for journey to work, when in work, amongst current unemployed (%)
Bus Car6 Walk/ Cycle
Train/ Tram
Other
All 58 22 15 4 1
Gender Male 55 21 19 5 0
Female 65 24 8 2 1
Car Availability
No Car Available7 72 4 19 5 1
Car Available 23 70 5 3 0
Age 18-24 66 11 16 5 0
25-49 58 23 15 4 1
50+ 46 37 13 3 1
Occupation Professional8 31 42 15 11 0
Skilled9 52 27 15 4 2
Lower skilled 10 65 17 15 3 0
Qualifications NVQ 2 or higher 55 26 14 5 0
NVQ 1 or lower11 62 18 17 3 1
Duration of being
unemployed 6 months or less 53 26 15 5
Over 6 months 64 18 15 3 0
3 This sample included those w orking in London, w here buses are regulated and their use is higher than elsew here. It w as also based on figures from 2010.
4 Buses and Economic Grow th, http://www.greenerjourneys.com/2012/07/buses-economic-growth-making-the-link-new -report/ 5 National Travel Survey 2010, Department for Transport, http://www.dft.gov.uk/statistics/releases/national-travel-survey-2010. 6 Car users include car drivers, passengers and motorcyclists
7 No Car available respondents are those w ho ‘rarely’ or ‘never’ have access to a car/van/motorbike for their personal use.
8
Professional occupations include managers or senior official (e.g. office manager, company director, sales manager) and Professionals (e.g. doctor, engineer, teacher, law yer, social w orker), which correspond to the Standard Occupational Classification major groups 1 and 2.
9
Skilled occupations include Technical (e.g. nurse, police officer, journalist, sales representative), Administrative or secretarial (e.g. account clerk, legal secretary, receptionist, administration assistant), Skilled trade (e.g. farmer, bricklayer, plasterer, joiner, plumber). These correspond to Standard Occupational Classes 3-5
10
Low er skilled occupations include Personal service (e.g. dental nurse, cook, travel agent, beautician, hair dresser, caretaker, teaching assistant), Sales or customer service (e.g. sales assistant, cashier, market trader, call centre w orker), Process, p lant and machine operator (e.g. machinist, driver, laboratory tester) and Elementary occupation (e.g. cleaner, farm w orker, labourer, porter, w aiter, bar staff, postal worker). These correspond to Standard Occupational Classes 6-9
11
6
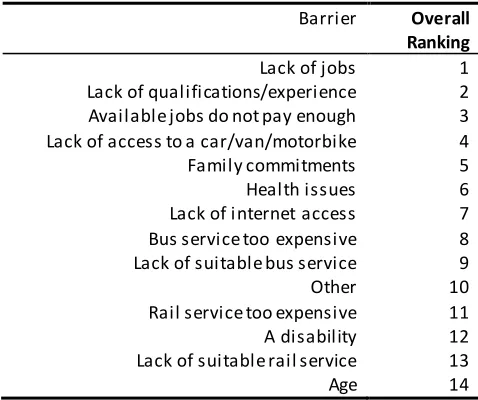
[image:7.596.66.305.146.346.2]We asked respondents about their perceived barriers to employment. The results should be treated with due caution as perceived/stated responses rather than actual, but are, we believe, plausible. Assembling the data in ranking form, the results are shown in Table 2. Table 2: Most important barriers to employment
Barrier Overall Ranking
Lack of jobs 1
Lack of qualifications/experience 2
Available jobs do not pay enough 3
Lack of access to a car/van/motorbike 4
Family commitments 5
Health issues 6
Lack of internet access 7
Bus service too expensive 8
Lack of suitable bus service 9
Other 10
Rail service too expensive 11
A disability 12
Lack of suitable rail service 13
Age 14
The three most important barriers are to do with the labour market itself and the
A
factors and personal issues such as family responsibilities and health. Accessibility to jobs comes across as a significant barrier outside the labour market itself. 10% of the
respondents give as their first or second most important barrier to employment either the lack of a suitable bus service for them or that bus fares are too expensive for them.
Our findings highlight particular issues for younger job searchers -23% of unemployed 18-24 year old respondents in this survey (compared to 16% of the other age groups combined) cite the lack of a suitable bus service as a key barrier to finding a job. An even higher proportion of this age group (25%) cited the cost of bus services as a barrier (compared to 18% of the other age groups).
When asked about bus service quality, just over half the respondents stated that the service was good enough for them while an eighth said they would never use bus anyway. Just over a third said that a better bus service would make it more likely they could find work.
Frequency, fares, speed and coverage of early morning/late evening were the stated
We asked those sampled about their nearest bus service. 71% lived within five minutes walk of a bus stop and an additional 23% within 10 minutes. In these urban areas,
7
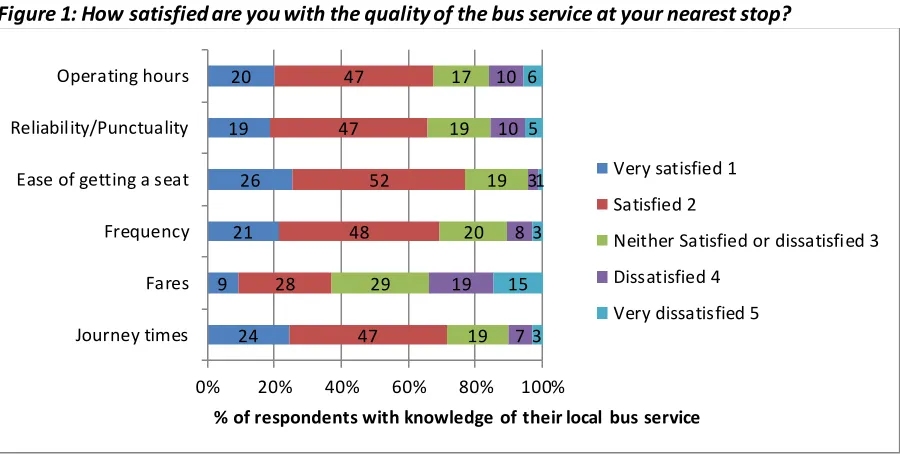
Figure 1: How satisfied are you with the quality of the bus service at your nearest stop?
Two thirds of the sample were very satisfied or satisfied with the various aspects of service quality, but only 37% were very satisfied or satisfied with the fares.
The condition of unemployment is often characterised by periods of unemployment
[image:8.596.65.472.474.569.2]punctuated by periods of employment. On average the res pondents had been unemployed for 6.8 months out of the previous 12 months. This is labelled unemployment intensity in Table 3.
Table 3: Unemployment Intensity by transport availability
All Car available
No car available * bus stop within five minutes walk
No car available * bus stop five minutes walk or more
Unemployment intensity (Months)12
6.80 5.90 7.03 7.34
N 912 237 486 189
In our modelling we found the determinants of unemployment intensity are gender, age, skills and qualifications. But in addition, access to a car significantly reduces unemployment intensity. For those without a car, proximity to a bus stop has a small but significant effect.
12
N
Higher_quals represents NVQ level 4 or above; Willingness to travel represents those who said they were willing to travel over 45 minutes (one way) to work; Search intensity represents those who had spent 11 hours or more looking for work in the last fortnight; Car available represents those who had car/va n always available for personal use.
24 9 21 26 19 20 47 28 48 52 47 47 19 29 20 19 19 17 7 19 8 3 10 10 3 15 3 1 5 6
0% 20% 40% 60% 80% 100%
Journey times Fares Frequency Ease of getting a seat Reliability/Punctuality Operating hours
% of respondents with knowledge of their local bus service
Very satisfied 1
Satisfied 2
Neither Satisfied or dissatisfied 3
Dissatisfied 4
8
The main conclusions from this strand of the work are:
People in urban areas who are unemployed and seeking work have very high levels of dependence on buses for accessing employment. This is particularly the case for females, those with no car available, younger people and lower skilled.
Lack of jobs and qualifications/experience emerge as the key barriers to employment with pay and access to a car/van/motorbike also in the top four barriers. The relative dependence of 18-24 year olds on bus service relative to other age groups was reflected in higher proportions indicating fares and journey times were barriers to employment.
57% of our respondents did not have a full car or motorcycle driving licence, 77% had no regular access to a car, van, or motorcycle. This rose to 87% for 18-24 year olds.
3.
Bus service and the vitality of town and city centres
In our previous work, we estimated that people using the bus to make shopping and entertainment trips had a gross spend of £27bn per annum of which around £22bn is in town and city centres. The work reported here builds on that by examining the pattern of visits and expenditures so as to help establish if there is a relationship between accessibility and expenditure.
The survey method was to use an online panel with 4000 respondents split between a random sample of 2000 to give a base national picture and a targeted top up sample of 2000 to achieve an overall split of 40% car users, 40% bus and 20% other. The entire sample was then reweighted to achieve a representative sample by age, gender and region. The sample is Britain wide (excluding London) but focussed on urban locations of > 20,000 population but including all locations in PTE areas. The results are therefore descriptive of urban Britain outside London.
Respondents were asked about their most recent shopping/entertainment trip, defined to exclude trips solely to the supermarket13 and to focus on trips to town/city centres14, retail parks and entertainment complexes. Broadly 70% of shopping trips were to town/city centres with 30% in out of town retail/entertainment parks of all forms. Mode used for the most recent shopping/entertainment trip as defined is shown in Figure 2.
13
These were excluded as we felt most of these trips would be to large out of town or local stores which are not the markets where town/city centres are competing.
14
9
Figure 2: Mode Share by Shopping Location (%)
Considering all location types together, car is the mode used for just over half the trips with bus at 22%, rail/tram at 7% and walk/cycle at 20%. For retail/entertainment parks, car dominates at 78% while for town and city centres, bus and car have roughly equal shares of the trips with walk/cycle also performing strongly, particularly no doubt for non-home based trips. The monthly trip frequencies by mode and location type are shown in the Task 5 full report. For those with no car available or limited car availability, bus accounts for over a third of all shopping trips as defined.
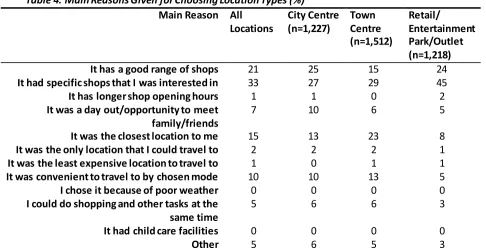
When asked why they had chosen that location for their most recent shopping trip, people responded as in Table 4.
Table 4: Main Reasons Given for Choosing Location Types (%) Main Reason All
Locations City Centre (n=1,227) Town Centre (n=1,512) Retail/ Entertainment Park/Outlet (n=1,218) It has a good range of shops 21 25 15 24
It had specific shops that I was interested in 33 27 29 45
It has longer shop opening hours 1 1 0 2
It was a day out/opportunity to meet family/friends
7 10 6 5
It was the closest location to me 15 13 23 8
It was the only location that I could travel to 2 2 2 1
It was the least expensive location to travel to 1 0 1 1
It was convenient to travel to by chosen mode 10 10 13 5
I chose it because of poor weather 0 0 0 0
I could do shopping and other tasks at the same time
5 6 6 3
It had child care facilities 0 0 0 0
Other 5 6 5 3
30 47 78 51 33 23 13 22 15 3 5 7 22 28 4 20
0% 20% 40% 60% 80% 100%
[image:10.596.47.533.494.745.2]10
The general pattern of responses is not too surprising but the importance of proximity and
I
locations is noteworthy.
The four top reasons for choosing to use bus as the access mode were: Cheaper/less expensive (23%)15
N
Easier/more convenient (17%) Avoids parking difficulties (14%)
[image:11.596.65.533.408.498.2]Turning to spending per trip, the distribution of spending is skewed since a small proportion of sample respondents report buying expensive items on their most recent shopping trip. As a result, the average (mean) expenditure16 was £56 while the median expenditure was about half of that. The expenditure by access mode and location type is shown in Table 5. Whilst bus passengers spend on average £6 less per visit than car travellers, we found that when we controlled for differences in personal characteristics and shopping purpose there was no significant difference in expenditure per trip by these two groups. Table 6 shows bus trips account for 29% of total expenditure on retail/entertainment as defined in city centres and 22% of expenditure in all location types17.
Table 5: Average Overall Expenditure by Access Mode and Location Type (£ per Trip) City Centre Town Centre Retail Park/Outlet All Locations N
Car £66 £48 £55 £55 1,533
Bus £54** £41 £55 £49* 1,624
Walk/Cycle £41** £29** £49 £36** 589
All Modes18 £56 £41 £55 £51 3,960
N 1,392 1,505 1,068 3,960
** i ndicates va lues which are s tatistically different from Car for that l ocation a t the 5% l evel of significance. *i ndicates values which are statistically di fferent from Ca r for that location at the 10% l evel of significance.
Table 6: Share of Total Expenditure by Access Mode and Location Type (%) City Centre Town Centre Retail Park/Outlet All Locations
Car 34 48 58 48
Bus 29 22 18 22
Other modes 36 29 23 30
All Modes19 100 100 100 100
15
For concessionary travellers, bus will be free.
16
Family groups and individuals aggregated
17
This assumes that the expenditure on the reported most recent trip is representative of the expenditure on all trips
18 Note that this includes rail which is not represented as a separate mode due to a small sample size of 194. 19
[image:11.596.66.461.548.625.2]11
Respondents using bus were asked what they would do if no bus service were available to their destination of choice. 45% responded that they would switch mode, 16% sa id they would not undertake the trip at all, and 24% would travel to a different location.
Overall, we conclude that even in the modern world of internet purchases and out of town shopping, town and city centres remain very important in the retail and entertainment
market
The bus service is an essential mode for facilitating access to these retail and entertainment based activities bus accounts for just over a fifth of such trips to town centres and the largest mode share, almost a third, of these trips to to city centres. Bus passengers account for 29% of expenditures in city centres.
4.
The role and value of buses outside towns and cities
Most of the emphasis of our work has been on the urban bus and this is justified by the market share, ridership and importance of urban services. In this section, attention is turned outside of the urban service market. It would be wrong to describe most services outside towns and cities as rural even if a high proportion of their mileage is green field. Their economic function is usually to connect for example the county town or the largest market town in the area with another smaller town, passing through villages or small towns on the way. A look at the bus network for any county in England would show a map of services of this kind, often running at 30 or 60 minute intervals, or perhaps two-hourly in more sparsely populated territory. Some of these services are commercial, or commercial Mon-Sat
daytime; some are partially or wholly tendered.
To undertake a comprehensive or representative sample survey of the use and social value of such services would be a major undertaking outside the scope of this work. We therefore chose to undertake a case study of two routes in Shropshire, one connecting Bridgnorth (pop 12,000) and Much Wenlock (pop 3,000) to the county town of Shrewsbury (pop
12
This strand of the study had two goals:
To investigate the pattern of usage of these routes and define their economic function more closely. For this purpose an on-bus survey was carried out. To investigate the value which the local population in the catchment area of the
services place on their existence and availability. This needed to include both users and non-users and therefore a household survey was undertaken.
Pattern of usage and economic function
Most bus routes serve a range of sub-markets distinguished by time of day, space and socio-economic role. In this study we were interested in some but not all of the sub-markets. Various groups of bus users were defined as out of scope for the survey people travelling within Shrewsbury, people travelling beyond Bridgnorth/Market Drayton and schoolchildren under age 16 (our passenger counts suggest this latter group is a significant market). So our survey is of a proportion of the market served by these buses, mainly people over 16 travelling between Shrewsbury and Much Wenlock, Bridgnorth and Market Drayton. 265 usable questionnaire returns were obtained, less than half the target of 600. Spending more survey days and/or adding services such as Shrewsbury to Oswestry or Newport were considered and rejected. As a consequence, the analysis is less rich than planned but is of interest nonetheless.
62% of our overall sample of bus users were undertaking Shopping/Leisure/Service activities. Over 50% of these were concessionary passengers, who reported similar levels of spend to non-concessionary passengers.
Around 40% of respondents were over 60 with a further 30% aged 16-19 30-40% were in full or part-time employment with a further 20% students Over 50% did not hold a driving licence and a similar proportion never had car
available for the trip they were making.
Over 40% used a concessionary pass of some kind, 20% used a single or return cash fare while the remainder used some form of saver ticket.
When asked to rate the bus service in terms of level of satisfaction, the Market Drayton route achieved satisfaction scores of 70% or better very satisfied or satisfied on all criteria but the Bridgnorth route dipped below this on value for money, punctuality and frequency. Respondents were asked about their tripmaking on the service in the last seven days. Obviously the trip frequency for some purposes such as journey to work and education is higher than for others. Allowing for this, for the sub-markets in scope, just over half of the person trips reported were journeys to work or education, 20% were shopping trips with the remainder a wide range of leisure and personal business purposes.
13
education trips and 20% of shopping trips. For travel to work and education, the other main
current training course/look for a new course. Our interpretation is that this cohort were quite constrained and would not find it easy to adjust. The shopping cohort showed more flexibility. Alternative shopping destinations by bus, transfers to other modes and not doing the planned activity were the main responses. Not going shopping is best interpreted as a short term response but could be indicative of a reduction in shopping trip frequency, which is a credible response to a large increase in the transactions cost of going shopping.
The concessionary market is clearly large and dependent on buses as highli ghted by their stated continued use of buses even if routes were cut. In turn the local economy is
dependent on this group concessionary passengers spend as much per head if not more than other passengers on non-work/education trips.
Option Value of Bus Services
Most goods and services can be considered to have reasonably close substitutes. If a particular brand of chocolate bars disappears from the market, chocoholics have a range of alternatives to which they can switch. Some goods however, do not have close substitutes; they have some form of local monopoly or market power, so that if they disappear, they are not readily or easily substitutable. Local bus service of the kind in this case study is
potentially an example. Car or cycle or lift giving or taxi/hire car might combine to help fill the gap but only imperfectly and at a cost. In this situation, the local people might have not only a value of using the bus, but also a value of the existence of a bus service over and above their use value. The most obvious reasons for this are that they place a value on the bus service:
A
make driving a risky proposition;
Their own possible future use of the service in certain contingencies such as age, ability to drive, children able in future to get into Shrewsbury independently; To make it easier for relatives or friends with no car available to visit; this may
include the time and cost of being a chauffeur;
From the altruistic motive of concern for the accessibility of neighbours and others,
14
urban areas the option value of one particular bus service on a multi-service corridor section might be relatively low on the assumption that other services are available.
The Department for Transport has decided that option values can be included in appraisals in principle and have issued guidance in WebTAG (TAG Unit A4.1, DfT 2014a). However there is limited evidence on the values to use, and this study is intended as a contribution to the evidence base. Relative to previous work on this topic, this is quite a large survey of 201 households, but the results are, as stated above, context specific.
The survey method was randomised household face to face interviewing. Routes were created for each interviewer within the catchment area of the bus services in the various settlements. A detailed description of the household sampling method and catchment area definition is provided in the Task 6 report.
The approach used is that of Stated Preference. Respondents are presented with a series of choices between five alternative levels of bus service including total loss of service,
reductions in service level, and replacement of scheduled service by demand responsive book ahead service. The payment mechanism was the Council Tax; respondents were invited to choose between different levels of bus service and higher or lower levels of Council Tax. It was stressed that respondents should assume the different Council Tax levels presented represented the extra they would actually have to pay including allowance for discounts and exemptions was considered but ruled out. To provide a comparison with the value of bus service and to provide a check on policy response bias, respondents were also presented with alternatives in which they lost the use of local library services instead of (or as well as) their local bus service. We would like to have included other services such as refuse collection frequency or local post office, but these were ruled out on various grounds. We were interested in finding out both the value of the individual components of the total economic value of bus service such as the use value, the option value and the altruis tic value described above. A feature of the results which is to be expected is that there will be a
- T
unwilling to buy the local bus service or local library service at any price offered to them in the experiment (the lowest price offered was £10 per year). These non-traders do not provide useful information for the model but they do represent a relevant component of the sample. We have adjusted the results by assuming that the value they place on local bus service and local library service is zero.
15
willingness to pay to retain the current bus service than non-users. Loss of local library service was also valued adversely and significantly so.
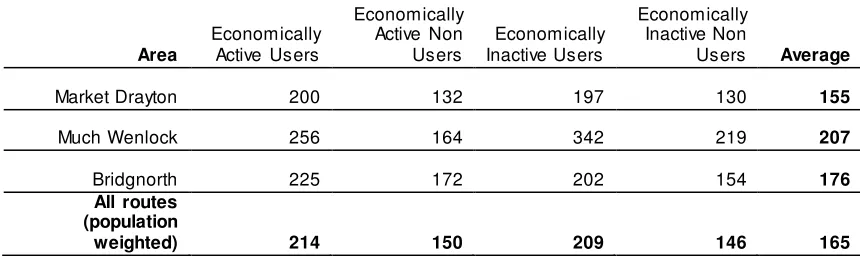
[image:16.596.70.500.187.315.2]The resulting total willingness to pay values are shown in Table 7.
Table 7: Willingness To Pay to maintain current bus service relative to no service (£ per year)
Area
Economically Active Users
Economically Active Non Users
Economically Inactive Users
Economically Inactive Non
Users Average
Market Drayton 200 132 197 130 155
Much Wenlock 256 164 342 219 207
Bridgnorth 225 172 202 154 176
All routes (population
weighted) 214 150 209 146 165
These values in Table 7 include use values and non-use values for the economically active and inactive. The results are broadly comparable in magnitude with previous studies and do confirm that, in the spatial and socio-economic context, residents are prepared to pay a significant insurance premium for the availability of a bus service and also for a library service. We found overall a WTP value of £165 per year, with an upper bound of £196 and a lower bound of £135. Library services were valued at £71 per household per annum.
The above results include both the value of the trips which household members make on the bus and the option and non-use value. From the point of view of appraisal guidance we are interested only in the additional value which is not captured in a cost-benefit analysis which has already considered user benefits and external impacts.
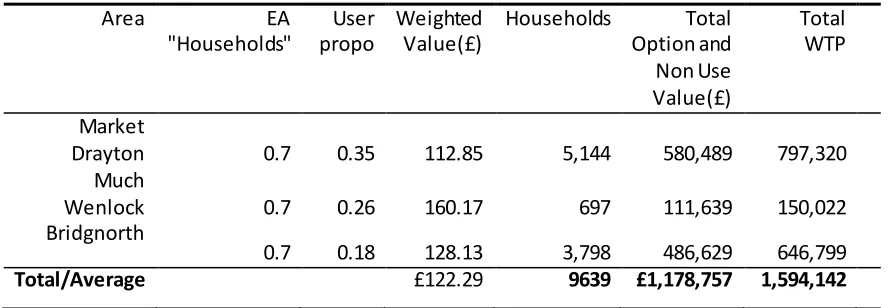
When weighted by population and the proportion of economically active households we derived an average household level option and non-use value of £122.29 per year as shown in Table 8. This might be compared with the cost of a car breakdown subscription, plumbing or central heating cover, or various internet and telephony packages.
Clearly there are issues concerning the representativeness of those sampled of the local population and the definition of the catchment areas to which the values apply. Taking quite a strict area definition, and multiplying the per household value by the number of
16
Table 8: Additional Economic Value of Local Bus Services
Area EA
"Households"
User propo
Weighted Value(£)
Households Total
Option and Non Use Value(£)
Total WTP
Market
Drayton 0.7 0.35 112.85 5,144 580,489 797,320
Much
Wenlock 0.7 0.26 160.17 697 111,639 150,022
Bridgnorth
0.7 0.18 128.13 3,798 486,629 646,799
Total/Average £122.29 9639 £1,178,757 1,594,142
As a sensitivity to this, we estimated the confidence intervals which the average values could fall between within a 95% degree of confidence. This gives us a lower bound to the aggregate option and non-use estimate in Table 8 of around £0.96M and an upper bound of £1.40M. These are the results for the catchment areas outside Shrewsbury itself and
exclude any value placed on the routes by those living within the town.
The evidence from the Shrewsbury case study highlights the importance of buses to the smaller local economy, serving functions not captured easily in current appraisal such as supporting access to education and particularly leisure and retail related activities. We found evidence supporting this in the numbers and types of passengers observed on buses and their reported activities. An additional role for buses is in providing insurance we found evidence that households place a significant value on the existence and availability of bus service even if they are not current users. The values which we found should be
17
5.
Bus projects and policies
the appraisal context
All public expenditure programmes need to be assessed in terms of value for money. The overarching guidance is provided in the Treasury Green Book, currently under revision. However, underneath that umbrella, different Departments have worked out their own
T D T guidance is
contained in WebTAG. Our main purpose is to see how some of our work could be applied, within the generic WebTAG guidance, to bus policy and project appraisal.
As a preamble, it is worth noting that whereas most public policy towards buses is quite capable of assessment through the WebTAG framework, some types of initiative are more akin to regeneration or skills development programmes than to transport. This might be the case for targeted initiatives aimed for example at helping to get NEETs20 into jobs or training. In our Task 1 Report, we therefore review briefly the appraisal guidance issued by, or on behalf of, departments such as BIS, DWP and CLG. This is interesting in the context of the City Deal where Local Enterprise Partnerships and Combined Authorities are encourag ed to think strategically across transport, land development, skills, flood protection etc to work out where the priorities lie for driving improved economic performance of the city region. A frequent starting point for other Departments is to try to measure the Gross Value Added associated with some policy initiative. For example, suppose a piece of urban regeneration is predicted to generate 100 new additional jobs at a wage of £20k per job year and with no offsetting or additional costs, then the GVA is £2million per year and it is worth spending up to this to create the jobs, duly allowing for risk, project life etc. This is a very simple example, and the manuals21 discuss issues such as deadweight; leakage; displacement; substitution; and multiplier effects. In the transport context where the channel is via improved
accessibility, the issues of displacement and substitution are particularly germane. Does improving accessibility improve the attractiveness of the city and lead to net additional jobs or do improvements redistribute existing jobs and output? Or is it a bit of both? These questions are relevant right across the policy spectrum.
M D T
reliability, safety and environment. The direct effects of better bus services will come about through changes in travel times, reliability, comfort or fares; these are the mechanisms by which improved accessibility is created. The appraisal treatment of such impacts is
documented in WebTAG and is applicable to bus scheme appraisal and bus policy analysis. It is the indirect and wider impacts on the economy of policy which stimulates changes in bus service quality which is of interest. Broadly speaking, the relevant guidance ca n be split into three:-
20
Not in Employment, Education or Tra ining
21
18
Option Values , WebTAG section A4.1 (DfT, 2014a): this covers guidance on the non-use benefits of transport services to which we have contributed some further evidence in the rural bus context in section 4 of this report
Regeneration Wider Impacts, WebTAG section A2.2 (DfT, 2014b). Whereas the wider impacts chapter of WebTAG relates conceptually to the aggregate impacts of
transport improvements, there are potentially also more spatially or socially specific impacts. Areas of multiple deprivation and pockets of structural unemployment may exist in economies which are generally prosperous. Policy to address specific area or social problems has both efficiency and distributive dimensions. In relation to these, WebTAG is largely descriptive; modelling these impacts and quantifying the benefits of improved bus services to/from these areas would be very demanding, and
therefore we have not tried to make progress on this aspect in this study.
Wider Impacts WebTAG section A2.1 (DfT, 2014c). Since this is the main focus of the next two sections, it is discussed more fully beginning with our general appreciation of the guidance and its applicability to bus policy and appraisal. Four sources of additional wider impact on economic efficiency are recognised in the guidance: agglomeration impacts, output changes in imperfectly competitive markets, labour supply impacts and moves to more productive jobs . We believe that bus service is an important support prop to the clustering of non-food retail and entertainment in town and city centres which is a form of agglomeration economy in which the benefit accrues partly to producers collectively and partly to consumers. However, converting this general statement into a testable empirical relationship would be very difficult. Labour supply impacts are potentially more tractable.
Labour supply wider impacts concern the added social value resulting from a reduction in transport costs or an improvement in accessibility attracting more people into work and raising aggregate output. The guidance of the DfT (2014c) suggests labour supply impacts should be relevant to most schemes. In the context of bus service improvements, there are reasonable arguments that the guidance should apply to both revenue and capital schemes and policies.
The labour market effects are valued not by the gross value added of the additional output but by the additional tax revenues generated by the change in labour supply. This is the so-called tax wedge which reflects the difference between the net wage on which the
19
Our aim in the next two sections is to see whether and how this logic can be applied in the context of bus policy. Broadly speaking there are two main challenges. The first, the subject of the next section, is to establish if there is any relationship between accessibility to jobs by bus and the level of employment. Then the second is to try to measure the effect of a policy change on bus accessibility and hence on employment and output and to establish the materiality of any result.
6.
The relationship between bus accessibility and employment
A key research gap identified in the first study for Greener Journeys was whether there is a systematic variation in the level of employment at local level with the quality of the bus network. There is a reasonable theoretical basis for supposing there might be people at, or close to, the margin of employment face various employment opportunities varying
according to their skills and other personal characteristics. An improvement in bus
accessibility will reduce the cost of entering employment by reducing the generalised cost of commuting, increasing the employment options available within an acceptable commute and raising the likelihood of finding work. The framework within which these labour supply impacts play out is as follows:
Reductions in generalised cost of travel increase the wage net of commuting costs available to a given individual
C decisions, the
extent of which is determined by the labour supply elasticity
Following dialogue with the DfT we have adopted the assumption that the demand for labour is elastic at the going gross wage. Clearly this is not the only possible assumption if the economy is entirely demand constrained, changes in accessibility might redistribute employment but not change its total.
We aim to test our theory empirically by modelling the sensitivity of employment to changes in bus accessibility (as measured by estimated door to door public transport journey times to large employment areas). This is a relatively tricky and unexplored area with difficult data requirements but unlike the work on bus accessibility and unemployment in section 2, it does make use of national spatial data sources. Only a non-technical
description of the work is given here. An important issue is that accessibility by bus and employment might be related in more than one way. The theory above suggests that better accessibility by bus should draw people into the labour market and increase employment. But also, high employment areas might be associated with lower levels of bus service because of high car availability. The methods have to be capable of distinguishing the
20
unfortunately fare data was not available at zonal level and we have worked on time only as our accessibility indicator.
We did not know ex-ante what if any approach was going to work so we used two separate approaches. The first was a pooled cross-section and time series (or Panel) model across 324 Local authority district zones and over four years (2008-2011). Employment at zonal level is regressed on DfT derived accessibility indicators for journey times to employment areas by public transport and car. Other variables used in the model included local area population, population density, education and training indices, gender and ethnic mix, public and elementary occupation mix. The Fixed Effects (FE) estimation approach used utilises the repeated observations over time to remove any (time invariant) impacts on the estimation of unobserved or missing variables. More detail on this approach is available in the full Task 3 report.
The second approach was to estimate a purely cross -sectional model utilising the 2011 UK Census data at the mid-level super output area (MSOA) giving 6786 observations on social and labour market measures for zones in England, again matched to bus accessibility data from the DfT. This data set permits us to investigate the relationship between spatial
differences in bus (and car) accessibility and differences in employment rates, controlling for localised factors such as population, car availability, qualifications, occupations etc. Here we estimated 2 sets of models firstly a model with different regional employment elasticities derived from an interaction term between car availability and bus travel time. A second set of cross sectional models were estimated separately for each of the 4 urban forms.
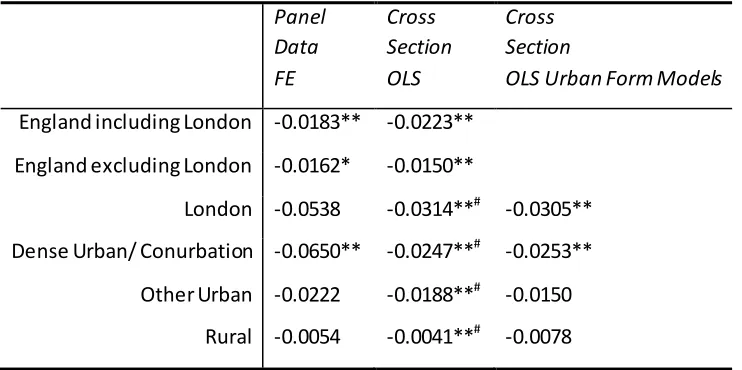
The high level conclusions from the work, reported fully in the Task 3 report are as follows. Across both datasets we found a statistically significant and negative relationship between public transport travel time and employment which varies in magnitude by urban type and level of car availability. In most cases the strength of the relationship (the elasticity of employment to bus journey time) is similar in the two approaches. The models are generally plausible in terms of signs and magnitudes for all coefficients. We take these characteristics as indicative of robustness in the results.
21
Table 9: Estimated Employment elasticities with respect to changes in bus travel times across the models
Panel Data FE
Cross Section OLS
Cross Section
OLS Urban Form Models
England including London -0.0183** -0.0223**
-0.0150** England excluding London -0.0162*
London -0.0538 -0.0314**# -0.0305**
Dense Urban/ Conurbation -0.0650** -0.0247**# -0.0253**
Other Urban -0.0222 -0.0188**# -0.0150
Rural -0.0054 -0.0041**# -0.0078
#
These values are derived from the coefficients on bus travel time and the interaction with levels of car availability so do not have separate significance levels.
**Indicates significance at the 5% level; *Indicates significance at the 10% level
Overall we draw comfort from the pattern of these results. If asked to choose, we would prefer the ordinary least squares results from the mid super output area cross-sectional model (col 2 of the table). These values are derived from robustly estimated coefficients and can be adapted based on different levels of car accessibility. They are extremely close to the OLS models estimated separately for each urban form in column 3. It was important to consider the issue of causality in our models do better bus services lead to higher
22
7.
Application to appraisal
In the previous section relationships were derived between bus accessibility and
employment. The purpose of this section is to illustrate how this evidence could be used in bus policy analysis or project appraisal within the WebTAG framework. It is important to note however that this process and the values used are not part of current WebTAG guidance. Of particular interest is whether the findings of the previous section make a material difference or whether they are too s mall to warrant consideration. Therefore the relative size of the direct transport benefits of a scheme or policy and the wider impact is relevant. A convenient test bed for examining this is the National Bus Model (NBM), and we are grateful to the DfT for making the model available for our work.
The NBM has been built to assist understanding of the effects of different policies on the bus market. Policy changes and exogenous demand changes are applied by the user for spatially defined markets such as PTEs, urban conurbations, small towns etc. Outputs can be obtained at aggregate national level or broken down by area type. The model is elasticity driven and allows demand to respond to fare level and structure, concessions, bus service provision, quality of service and road speeds. Importantly a congestion feedback between bus market share and road speeds is included in the model. This type of model is in principle suitable for assessing broad brush policies such as changes to the Bus Service Operators Grant (BSOG), or hypothetical broad changes in fare or service levels. Appraisal of individual schemes such as bus priorities would require a finer level of modelling both of demand and the local network and would need to be done with a bespoke local model.
We used two policy tests involving changes to BSOG which had previously been run using the NBM. The full results are reported in the Task 2 Report. Because the tests give rather similar results in terms of what we are interested in, we concentrate here on the impact of a 50% cut in BSOG.
The following first order effects as estimated from the NBM are reported in Table 10. These include economic efficiency benefits from travel time and consumer surplus changes for users (commuters, other and business), changes to indirect tax revenues and the monetised value of the impact of externalities such as congestion, accidents, air quality and
23
Table 10: NBM Outputs from 50% BSOG Cut (2014)
Analysis of Monetised Costs and Benefits
Total
Economic Efficiency: Consumer Users (Commuting)
-27,260,249
Economic Efficiency: Consumer Users (Other)
-140,661,447
Economic Efficiency: Business Users and Providers
-33,390,628
Wider Public Finances (Indirect Taxation Revenues)
-4,425,572
External Impacts 3,275,252
Present Value of Benefits (PVB) -202,462,645
Present Value of Costs (PVC) -111,151,854
Overall Impacts
Net Present Value (NPV) -91,310,791
The logic chain for calculation of the employment impacts following any policy intervention is as follows:
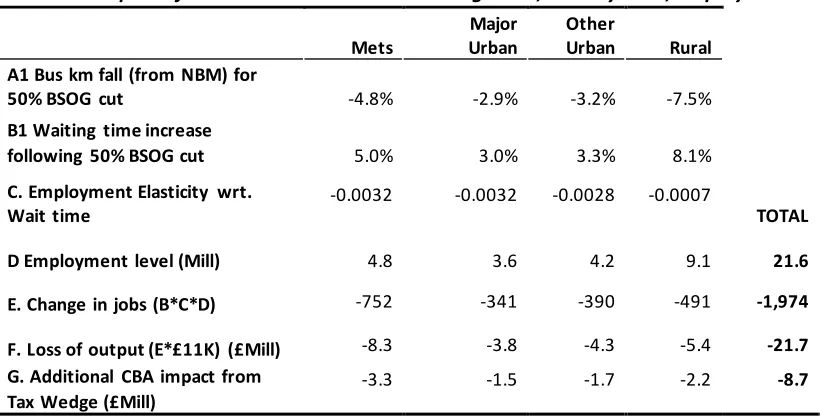
A given fiscal change such as a cut in BSOG has an impact on bus service levels and fares in some combination. It might be conjectured that the outcome might involve some combination of frequency reductions, increased walk times if the route network is thinned out, and fare increases where the market will stand them. In practice we represent the effect of the cut in our policy test entirely in terms of a change in frequency (Row A of Table 11).
A relationship between frequency and quality of service to the user since an x per cent frequency reduction makes the bus service that much less attracti ve. In practice the NBM represents this (Row B of Table 11) through an increase in waiting time and hence generalised cost22.
An impact of the policy on the direct transport benefits and costs, impacts on non-users through congestion, air quality and carbon emissions, on bus operators and on Government through second round effects on concessionary reimbursement and changes in road fuel duty (summarised in Table 10).
An impact via the elasticities estimated in the previous section (Table 9) on employment levels (Row C of Table 11)23.
An estimation of the change in employment (Row E of Table 11).
22
We apply a double weight to a minute of waiting time relative to in-vehicle time reflecting WebTAG advice.
23
24
[image:25.596.69.480.144.353.2]This is a long chain of logic and might be weak at any point. For example, operators might not respond as we have assumed, or local authority behaviour might also come into the picture. So the results are strictly illustrative, though we believe they are credible.
Table 11: Impact of 50% BSOG reduction on Waiting times, Journey Time, Employment and Output
Mets
Major Urban
Other
Urban Rural A1 Bus km fall (from NBM) for
50% BSOG cut -4.8% -2.9% -3.2% -7.5%
B1 Waiting time increase
following 50% BSOG cut 5.0% 3.0% 3.3% 8.1%
C. Employment Elasticity wrt. Wait time
-0.0032 -0.0032 -0.0028 -0.0007
TOTAL D Employment level (Mill) 4.8 3.6 4.2 9.1 21.6 E. Change in jobs (B*C*D) -752 -341 -390 -491 -1,974 F. Loss of output (E*£11K) (£Mill) -8.3 -3.8 -4.3 -5.4 -21.7 G. Additional CBA impact from
Tax Wedge (£Mill)
-3.3 -1.5 -1.7 -2.2 -8.7
The next steps are to convert the estimated change in employment into a change in output and then to calculate the tax wedge benefit as discussed in Section 5. There are two options: the first is to use standard values for GVA per job and then to apply the WebTAG guidance value of 40% for the tax wedge. An alternative would be to compute a more market specific GVA per job and tax wedge. This would probably yield a lower GVA per job but a higher tax wedge because a proportion of the change in employment would come out of (or go into) unemployment where the marginal tax rate is closer to 60-70%. We might conjecture that the combination of the lower GVA per job and the higher tax wedge might produce a similar result to the standard values approach. In our illustration, we have played it safe, using a GVA per job of £11k based on an employee working average hours on the minimum wage, and then applied the standard 40% tax wedge to this.
Row E shows a loss of 2000 jobs associated with a BSOG cut of 50% and Row F the corresponding loss in output. The BSOG cut is equivalent to an
cost base and thus to a 3 to 7.5% fall in bus kms depending on the area type. More
important than the absolute numbers is the relativity. The 50% cut in BSOG is predicted by the NBM to produce an annual reduction in net benefit of £91.3 million, as shown in Table 10. To this should be added the £ 8.7 million tax wedge effect shown in Row G, an additional 10% loss in economic welfare on top of the direct transport impact. The equivalent
25
In this section, we have illustrated how the relationship between bus accessibility and employment which was found in section 6 could be used in bus policy analysis. We take from previous work the case of a change in BSOG which was modelled to produce a
reduction in bus vehicle kms of 3 to 7.5% depending on the area type. We then estimate an employment effect of the reduction in service level which, when applied to a standard GVA per job and marginal tax wedge produces a material additional wider economy impact of 9-10% of the direct transport impact in Table 10.
8.
Summary and Conclusions
Modern transport policy analysis has ceased to be mainly about transport impacts and is focussed on the effects of provision and policy upon the operation of the economy and society. In the case of bus services these effects are myriad in nature. The same vehicle on the same day may be used for trips for commuting, education, shopping, recreation and leisure, personal business, visiting friends and relations, access to health care and other purposes. The bus facilitates a large number of economic and social linkages , only a few of which are investigated in this report. Starting from our 2012 report, we have drilled down further on the following roles the bus fulfils:
Enabling a well-functioning labour market Supporting strong town centres and
Fulfilling a social insurance role both for people who use the bus regularly and for those who do not.
Very difficult decisions are made at local and central level, and by operators, about what is commercially or socially worthwhile, and it is hoped that this report will provide context and background to help inform such decisions.
T A
market has both a time and a money cost. Our first workstream was on people currently out of the labour market but seeking to (re)-enter it. In our interview cohort of 912 jobseekers, we found the most important barrier to working was the state of the labour market and the
26
57% of our respondents did not have a full car or motorcycle driving licence, 77% had no regular access to a car, van, or motorcycle. This rose to 87% for 18-24 year olds.
58% reported that the mode they used for the journey to work when last working was bus. Those currently unemployed are more dependent on bus than the population at large for potential access to bus. This figure rose to 72% of those without car availability
Whilst over half our respondents were satisfied (or better) with their local bus services, fares and journey times emerged as the key dimensions where it was felt improvements could be made.
A crucial determinant of the attractiveness of town and city centres is their perc eived quality and range of shopping and leisure/entertainment services. We wanted to find out about the pattern of shopping trips in urban Britain outside London and undertook an internet survey of 4000 respondents who were asked about their most recent shopping trip defined to exclude trips solely to the supermarket and to focus on trips to town/city centres, retail parks and entertainment complexes. 70% of such trips were to town/city centres with 30% out of town. Key findings here were:
Top reasons for using bus were: parking difficulties.
Bus trips were the most frequent mode of access to the city centre market for retail/entertainment trips- 33% versus 30% car and 22% walk/cycle. Bus trips represented 23% of total retail/entertainment trips.
Bus users accounted for 29% of total retail/entertainment expenditure in city centres and 22% of expenditure in all location types.
The bus is thus a very important facilitator of the retail and entertainment sector of the economy and for the life of towns and cities in particular.
27
additional to their use value and may be compared with the value of, for example, a car
T D
Grossing up from the sample households to the catchment area population carefully and narrowly defined, we obtained an aggregate option and non-use value of the two routes of over £1 million. While we would counsel caution regarding sample representativeness in grossing up and regarding transferability to appropriate contexts only, we are in no doubt that the social insurance value of low frequency but regular bus services of this kind is appreciable.
Our final aim was to demonstrate how labour market effects could be applied in bus policy analysis or project appraisal. In doing so, our aim was to follow the spirit of the
D to bus policy analysis in a
simplified way. Our approach is thus not part of current WebTAG guidance. We undertook this work in two stages: first, to establish a relationship between bus accessibility and employment and then to apply the results to an illustrative policy change. We undertook a series of econometric tests in which we found significant relationships between bus accessibility and employment both on a cross-sectional model and a pooled cross
section/time series model. Our preferred headline result is that a 10% improvement in bus journey time for all bus commuters in England would be associated with an increa se in employment of a fifth of one per cent, equivalent to an increase of over 50,000 jobs. Then applying this relationship to a policy test in which changes to BSOG were tested, we found that, following the DfT guidance, including the economic benefit of getting more people into jobs increased the total benefit of the policy to society by around 9-10% on top of the direct transport benefits. We believe we have made some contributions both to the wider impacts and option values evidence base which the DfT might consider in its next review of WebTAG guidance.
9.
References
Department for Business Innovation and Skills (2009), RDA Evaluation : Practical Guidance on Implementing the Impact Evaluation Framework
Department for Transport (2014a), Transport Analysis Guidance Unit A4.1,
https://www.gov.uk/government/publications/webtag-tag-unit-a4-1-social-impact-appraisal
Department for Transport (2014b), Transport Analysis Guidance Unit A2.2, Regeneration Impacts, https://www.gov.uk/government/publications/webtag-tag-unit-a2-2-regeneration-impacts
Department for Transport (2014c), Transport Analysis Guidance Unit A2.1,
https://www.gov.uk/government/publications/webtag-tag-unit-a2-1-wider-impacts
Mackie, P., Laird, J. and Johnson D., (2012), Buses and Economic Growth Final Report, Greener Journeys,