1
Factors affecting growth disparity in spiny
lobster aquaculture: the effect of physiology,
behaviour and feeding
by
Audrey Daning Tuzan
Institute of Marine and Antarctic Science (IMAS)
Submitted in fulfilment of the requirements for the degree of Doctor of Philosophy February 2018
2
STATEMENTS AND DECLARATIONS
Declaration of Originality
This thesis contains no material which has been accepted for a degree or diploma by the University or any other institution, except by way of background information and duly acknowledged in the thesis, and to the best of my knowledge and belief no material previously published or written by another person except where due acknowledgement is made in the text of the thesis, nor does the thesis contain any material that infringes copyright.
Authority of Access
This thesis may be made available for loan and limited copying and communication in accordance with the Copyright Act 1968.
AUDREY DANING TUZAN
Institute for Marine and Antarctic Studies University of Tasmania
3
STATEMENTS OF CO-AUTHORSHIP
Chapter 2-5 of this thesis have been prepared as scientific manuscripts and will be submitted for review in the near future. In all cases, the experimental design, data analysis and interpretation, and manuscript preparation were the primary responsibility of the candidate. Nevertheless, these studies were carried out in the collaboration with supervisors and co-authors. The contributions of co-authors are outlined below:
• Audrey Daning Tuzan, IMAS, University of Tasmania = Candidate
• Quinn P. Fitzgibbon, IMAS, University of Tasmania = Author 1
• Chris G. Carter, IMAS, University of Tasmania = Author 2
• Stephen, C. Battaglene, IMAS, University of Tasmania = Author 3
• Rafael I. Leon, IMAS, University of Tasmania = Author 4
Table of contribution per Chapter
Chapter Experimental
concept and
design
Data analyses Interpretation Main text writing Editorial editing
2 Candidate
Author 1, 2 & 3
Candidate Candidate
Author 1, 2 & 3
Candidate Candidate
Author 1, 2 & 3
3 Candidate
Author 1, 2 & 3
Candidate Author 4
Candidate Author 1, 2 & 3
Candidate Candidate
Author 1, 2 & 3
4 Candidate
Author 1, 2 & 3
Candidate Candidate
Author 1, 2 & 3
Candidate Candidate
Author 1, 2 & 3
5 Candidate
Author 1, 2 & 3
Candidate Candidate
Author 1, 2 & 3
Candidate Candidate
4 We the undersigned agree with the above stated proportion of work undertaken for each of the above chapters contributing to this thesis, which will be submitted as peer-reviewed manuscripts:
Signed:
Audrey Daning Tuzan PhD Candidate
Institute for Marine and Antarctic Studies, University of Tasmania
Signed:
Dr. Quinn P. Fitzgibbon Primary Supervisor
Institute for Marine and Antarctic Studies-Fisheries and Aquaculture Centre, University of Tasmania
Signed:
Professor Caleb Gardner Acting Head
5
ACKNOWLEDGEMENTS
First and foremost, I would like to express my sincere gratitude to my supervisors Dr Quinn P. Fitzgibbon, Professor Chris Carter, and Associate Professor Stephen Battaglene for giving me the opportunity to be able to work on this project and for all the patience, endless and invaluable support they gave me through all the stages of my candidature. Special thanks to Quinn for supporting my learning in all possible ways, for always encouraging, and motivating me when I was lost and in misery. Without his continuous support, I would never have been able to complete this journey.
I gratefully acknowledge the scholarship provided by the Minister of Higher Education Malaysia (SLAI) and Universiti Malaysia Sabah and, Institute for Marine and Antarctic Studies top-up scholarship. Many thanks also go to the ARC Research Hub for Commercial Development of Rock Lobster Culture Systems for providing the research funding and giving me the excellent opportunity to be able to work on this project.
I would like to especially thank Dr. Bryan Choa for continually helping me with technical assistance, and supporting, encouraging and providing me with his thoughts. Special thanks to Associate Professor Gregory Smith, Rhea Carr-Davies, Gail Eagle and Lynette Baily for their administration assistance and support and, to the rest of the aquaculture team for their continuous valuable support in the hatchery and laboratory. I also thank Drs Jeff Ross, Bridget Green, and Philip Crosbie for their support as a Graduate Research Officer during my candidature.
I especially thank Rafael Leon for his valuable assistance regarding statistics. Many thanks to Malinda, Daniella, Cesar, Waldo, Kate, Barrett, Raihan, Mohammad Khadojouei, Samantha, Patricia, Darynn and Renzo for their helpful support, assistance and friendship. To Riana, Audrey Hezyer and Alynn, thank you very much for always be there, being part of my life here in Tassie and for your valuable comments for improving my writing. To Prof. Rossita Shapawi, Dr. Faihanna Ching Fui Fui, Tony Soh, Jeanette and Zizi I appreciate your endless support, encouragements and prayers throughout this journey. To Paolo, thank you for supporting the finale of this journey, for cheering me up and keeping me sane especially during my weak moment.
6
GENERAL ABSTRACT
Spiny lobsters are known as a valuable commercial species with limited availability, which makes them a promising candidate for aquaculture. However, to date, the production of spiny lobsters in captivity has been characterised by considerable variation in individual lobster growth rates leading to growth disparity and impacting on biomass production. One explanation for the growth disparity in spiny lobsters is the agonistic behaviour of dominant individuals, whereby they control and consume a disproportionate share of food resources, benefiting their own growth performance. However, the mechanisms of how behavioural and feeding traits of individual lobsters influence growth disparity in culture are poorly understood. Furthermore, research of a range of marine organisms has shown that variability in individual metabolic physiology (metabolic phenotype) can be an important factor influencing behaviour and growth. However, the relationship between metabolic phenotype and individual growth performance has not been previously investigated in any spiny lobster species. Understanding the influence of intraspecific diversity in physiological traits on growth performance of individuals is an important consideration for the development of optimal rearing conditions and management strategies for spiny lobsters aquaculture. This is the first study to focus on the influence of individual variations in physiology, behaviour and feeding on the growth performance of two commercial temperate spiny lobsters species, Sagmariasus verreauxi and
Jasus edwardsii juveniles in captivity.
7 lobsters. Low metabolic rate lobsters also displayed greater ability to win over high metabolic rate lobsters which may explain why growth was not positively linked with metabolic phenotype in communal culture, as demonstrated in Chapter 2. Female lobsters were more dominant than male lobsters irrespective of size and metabolic phenotype status. These findings showed that the dominance behaviour of S. verreauxi is complex and that a range of factors including body size, metabolic status and sex can influence dominance status and potentially growth of individual lobsters in captivity.
Chapter 4 examined the influence of emergent juvenile intraspecific size variation and metabolic phenotype on growth performance of J. edwardsii post-pueruli in individual or communal rearing. Similar to findings with S.verreauxi, communally reared J. edwardsii
displayed a greater carapace length increment and a shorter intermoult period indicating that social interaction promotes lobster growth performance. Emergent juvenile body size did not influence lobster growth performance. Also similar to findings with S. verreauxi, metabolic phenotype showed a positive correlation with growth in individually reared lobsters, however, the communally reared lobsters displayed no such relationship suggesting that metabolic phenotype is also an important factor for J. edwardsii growth in the absence of social interaction. However, the underlying mechanism contributing to the relationship between metabolic phenotype and growth of spiny lobsters were not well understood. Chapter 5 examined the effect of metabolic phenotype on individual variation in feed intake and food preference between current best diets of the emergent juveniles J. edwardsii and linked with individual growth performance. Metabolic phenotype was not related to individual lobster feed intake. Moreover, lobster growth performance was also not linked with their feed intake. Mussel, notably mussel gonad, was the most preferred food for J. edwardsii emergent juveniles. Lobster food preference showed no correlation with the individual growth performance. These findings indicated that lobster feed intake and preference are not fundamental factors linking metabolic phenotype and growth.
9
TABLE OF CONTENTS
LIST OF FIGURES ………..……….…..….………….12
LIST OF TABLES …...15
Chapter 1 General Introduction …………...……….……….17
1.1 Overview ……….………...……18
1.2 Biological characteristic ………....…...……....…19
1.2.1 Systematics and taxonomy………....……19
1.2.2 Lifecycle ……….….…....……20
a. Eastern rock lobster, Sagmariasus verreauxi ………...……20
b. Southern rock lobster, Jasus edwardsii………...……...…21
1.3 Spiny lobsters aquaculture ………..…….……….21
1.3.1 Growth of spiny lobsters ………..22
1.4 Energy metabolism ………..……….………23
1.4.1 Measurement of metabolic rates.………….………..26
1.5 Social behaviour ……….………..…………27
1.5.1 Dominance and hierarchy ………28
1.6 Feeding ………..……….………...…...30
1.6.1 Feeding preference ………...30
1.6.2 Feed intake ………...30
1.7 Thesis aim and structure ……….…………..………….31
Chapter 2 Is individual variation in metabolic rate related to growth of spiny lobster in culture and what is the influence of social interaction? …..………….. 33
2.1Abstract ………..34
2.2Introduction ………...35
2.3Materials and methods ………...37
2.3.1 Experimental animals ………..37
2.3.2 Individual and communal rearing experiment ……….37
2.3.3 Oxygen consumption rate (Ṁo2) ………..38
2.3.4 Apparent feed intake ………..………..40
2.3.5 Calculations and terminology ………..40
2.3.6 Data analysis ………41
2.4Results ………... 43
2.4.1 Effects of individual and communal rearing treatment on growth, moulting and apparent feed intake ……….43
2.4.2 Metabolic rate ………..43
2.5Discussion ………..56
2.5.1 Effects of individual and communal rearing on growth, moulting and feeding activity ………..56
2.5.2 Metabolic rate, growth and feed intake ………57
10
Chapter 3 The influence of size, sex, metabolic phenotype, experience and rearing
history on social dominance status of spiny lobster in culture …………..60
3.1Abstract ………..61
3.2Introduction ………...62
3.3Materials and Methods ………..64
3.3.1 Experimental animals ………..64
3.3.2 Paired feeding behavioural experimental design ……….64
3.3.3 Paired contest protocol ……….64
3.3.4 Oxygen consumption rate (Ṁo2) ………..70
3.3.5 Data analysis ………71
3.4Results ………...73
3.4.1 Feeding contest behaviour ………...73
3.4.2 Effect of size, metabolic rate, sex, feeding contest experience and rearing condition on lobsters’ dominance status ………..75
3.5Discussion ………..83
3.5.1 Feeding contest behaviour ………...83
3.5.2 Effect of, size, metabolic rate, sex, contest experience and rearing condition on dominance status ………..84
3.5.3 Conclusion ………...87
Chapter 4 Growth variation in southern rock lobster, Jasus edwardsii: the influence of emergent juvenile body size, metabolic phenotype and social behaviour……….88
4.1Abstract ………..89
4.2Introduction ………...………....90
4.3Materials and Methods ………..92
4.3.1 Experimental animals ………..92
4.3.2 Individual and communal rearing experiment ……….93
4.3.3 Oxygen consumption rate (Ṁo2) ……….97
4.3.4 Data analysis ………99
4.4Results ……….100
4.4.1 Size distribution of the emergent juvenile ………..……100
4.4.2 Effect of emergent juveniles’ body size on growth ……….……103
4.4.3 Effect of social interaction on growth and survival ………103
4.4.4 Effect of metabolic phenotype on growth ………..111
4.5Discussion ………118
4.5.1 Size distribution of the emergent juvenile and effect of growth...…………..119
4.5.2 Effect of social interaction on growth, moult and feeding activity….………120
4.5.3 Effect of metabolic phenotype on growth ……….……….122
11
Chapter 5 Food preferences and feed intake of the emergent juvenile southern rock lobster¸ Jasus edwardsii on fresh mussels and commercial diet: the influence of metabolic phenotype on individual variation in feeding
intake………..125
5.1Abstract ………126
5.2Introduction ……….127
5.3Materials and methods ……….129
5.3.1 Experimental animals ………129
5.3.2 Feeding experiment ………129
5.3.3 Oxygen consumption rate (Ṁo2) ………...131
5.3.4 Data analysis ………..132
5.4Results ……….133
5.4.1 Apparent feed intake ………..133
a. Apparent feed intake by juvenile stage ………....133
b. Apparent feed intake by metabolic phenotype and growth ………..133
5.4.2 Food preference by type of feed and experimental period ………..…...133
5.4.3 Effect of food preference on growth ………..134
5.5Discussion ………144
5.5.1 Apparent feed intake ………..144
5.5.2 Food preference ……….145
5.5.3 Conclusion Chapter 6 General discussion ……….……..147
6.1 Findings of the present study ……….……..148
6.2 Limitations of the research ………..150
6.3 Recommendation for future research ………...151
6.4 Conclusion ………...154
12
LIST OF FIGURES
Figure 2.1 Relationship between observed weight gain (∆W, g)andinitial body weight (WI, g)
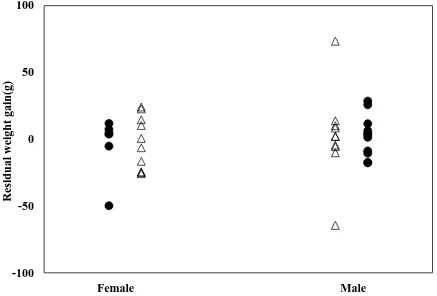
of communal (∆) and individual (●) reared Sagmariasus verreauxi juveniles. Residual (body-mass-corrected) weight gain was calculated by subtracting the expected ∆Wwith observed ∆W. Each data point represent an individual lobster. Details on correlations are given in Table 2.2. ………46 Figure 2.2 Residual weight gain (r∆W, g) of female and male Sagmariasus verreauxi juveniles reared communally (∆) and individually (●). One-way ANOVA F=0.584, P=0.457 (individual), F=0.173, P=0.683 (communal). Each data point represent an individual lobster. ………48 Figure 2.3 Relationship between observed oxygen consumption (Ṁo2, mg O2 h-1) and body
weight (g) of Sagmariasus verreauxi lobstersreared (●) individually or (∆) communally. A; standard metabolic rate (SMR), B; routine metabolic rate (RMR), C; active metabolic rate (AMR), D; aerobic scope (AS). Each data point represent an individual lobster. Details of regression lines are presented in Table 2.4...……….. 50 Figure 2. 4 Relationship between residual mass gain (∆W, g) with residual standard metabolic rate (rSMR), residual routine metabolic rate (rRMR), residual active metabolic rate (rAMR) and residual aerobic scope (rAS) (mg O2 h-1) of Sagmariasus verreauxi lobsters
reared individually (A-D) or communal culture (E-H). Details on regression lines (dotted lines) are given in Table 2.5. ………...……52 Figure 2.5 Relationship between apparent feed intake (AFI) and residual metabolic rate; (A) residual standard metabolic rate (rSMR); (B) residual routine metabolic rate (rRMR); (C) residual active metabolic rate (rAMR) and; residual aerobic scope (rAS) (mg O2 h-1) of
Sagmariasus verreauxi lobsters reared individually over seven days feeding experiment. Each data point represent an individual lobster. Details of linear regression are presented in Table 2.6. ………54 Figure 3.1 The experimental unit used for the feeding behaviour experiment. 1, Experimental
tank; 2, in-flow tube; 3, fluorescent globe; 4, shelter; 5, camera; 6, feeding tray; 7, out-flow tube; 8, globe holder; 9, camera stand. ………66 Figure 3.2 A diagram showing the feeding experimental procedure. ………..67 Figure 3.3 Occurrence of feeding behaviour shown by 50 paired lobsters on each of the 3-days pairing contests. NR: no response; O: orientation; C1: secondary consumer; FL: fight and lost; S: share; FW: fight and win; C2: primary consumer. ……….74 Figure 3.4 Ordinal regression mixed model (ORMM) showing the effect of absolute carapace, carapace length difference and residual standard metabolic rate (SMR) on the probability of Sagmariasus verreauxi juvenile lobsters’ dominance status. Probability of individual
lobsters’ dominance status from fitted values Model 2 (C-D) and Model 6 (A-B).………….………..78 Figure 3.5 Figure 3.5 Ordinal regression mixed model (ORMM) showing the effect of absolute
carapace length, carapace length difference, and residual routine metabolic rate (RMR) on the probability of Sagmariasus verreauxi juvenile lobsters’ dominance status. Probability of individual lobsters’ dominance status from fitted values Model 1 (C-D) and Model 5 (A-B)...………..……….……….79 Figure 3.6 Ordinal regression mixed model (ORMM) showing the effect of absolute carapace
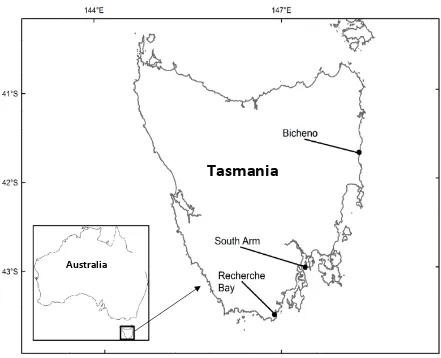
13 Figure 3.7 Ordinal regression mixed model (ORMM) showing the effect of carapace length difference and sex on the probability of Sagmariasus verreauxi juvenile lobsters’ dominance status. Probability of individual lobsters’ dominance status from fitted values Model 4. ……….81 Figure 3.8 Ordinal regression mixed model (ORMM) showing the effect of carapace length difference and sex on the probability of Sagmariasus verreauxi juvenile lobsters’ dominance status. Probability of individual lobsters’ dominance status from fitted values Model 7 (A) and Model 8 (B)...………..82 Figure 4.1 Map of Tasmania, Australia, showing the locations for the collection of pueruli used in the study. ………94 Figure 4.2 Carapace length and size distribution of the emergent juvenile Jasus edwardsii at first instar juvenile (J1) stage (n=60) ………101 Figure 4.3 Relationship between Jasus edwardsii emergent juvenile carapace length (initial CL) and A) final carapace length (Final CL), B) dry body weight (DBW), C) residual carapace length increment (r∆CL), D) moulting duration reared individually (●) and communally (∆). Each data point represent an individual lobster. Details of regression are presented in Table 4.3. ………..104 Figure 4.4 Results of the effect of Jasus edwardsii emergent juvenile rearing treatment experiment. (A) carapace length, (B) moulting increment, (C) intermoult duration. Data are means and error bars represent standard error. Significant differences between means within the same stage of the two rearing treatments are marked by different letters (Student’s t-test, P < 0.05)……… ………...106 Figure 4.5 Relationship between moulting duration (days) and residual carapace length increment (mm) of Jasus edwardsii emergent juvenile reared (●) individually or (∆) communally. Each data point represent an individual lobster. Details of regression lines are presented in Table 4.5. ………109 Figure 4.6 Relationship between mass-specific metabolic rate (Ṁo2, mg O2 h-1) and dry body
weight (g) of Jasus edwardsii emergent juvenile reared (●) individually or (∆) communally. A; standard metabolic rate (SMR), B; routine metabolic rate (RMR), C; active metabolic rate and D; aerobic scope. Each data point represent an individual lobster. Details of regression lines (dotted lines) are presented in Table 4.7. ………...113 Figure 4.7 Relationship between observed metabolic rate (Ṁo2, mg O2 h-1) and dry body weight
(g) of Jasus edwardsii emergent juvenile reared (●) individually or (∆) communally. A; standard metabolic rate (SMR), B; routine metabolic rate (RMR), C; active metabolic rate (AMR), D; aerobic scope (AS). Each data point represent an individual lobster. Details of regression lines are presented in Table 4.8. ………115 Figure 4.8 Relationship between residual carapace length increment (r∆CL, mm) with residual
standard metabolic rate (rSMR), residual routine metabolic rate (rRMR), residual active metabolic rate (rAMR) and residual aerobic scope (rAS) (mg O2 h-1) of Jasus edwardsii
emergent juvenile reared individually (A-D) or communally (E-H). Details of regression lines (dotted lines) are presented in Table 4.10. ……….……….…….118 Figure 5.1 Relationship between apparent feed intake (AFI) and residual metabolic rate; (A) residual standard metabolic rate (rSMR); (B) residual routine metabolic rate (rRMR); (C) residual active metabolic rate (rAMR) and; residual aerobic scope (rAS) of Jasus edwardsii first instar juveniles (J1). Each data point represent an individual lobster. Details of linear regression are presented in Table 5.1. ………..………….135 Figure 5.2 Relationship between apparent feed intake (AFI) and residual metabolic rate; (A)
14
edwardsii third instar juveniles (J3). Each data point represent an individual lobster. Details of linear regression are presented in Table 5.1. ..………..136 Figure 5.3 Relationship between apparent feed intake (AFI) and residual carapace length increment (r∆CL) of Jasus edwardsii (A) first (J1) and (B) third (J3) instar juveniles. Each data point represent an individual lobster. ………..138 Figure 5.4 Total feed intake of Jasus edwardsii juveniles at (A) first instar juvenile (J1) and;
(B) third instar juvenile (J3) fed with three types of diet; moist formulate diet (MFD), fresh blue mussels (Mytilus galloprovincialis) gonad (MG) and mantle (MM) for the period of 21 days (3 weeks). Bar bearing superscripts are significantly different between types of diet at the week indicated. Values are mean (± S.E.). ………….……….140 Figure 5.5 Total feed intake of Jasus edwardsii juveniles at first instar juvenile (J1) and third instar juvenile (J3) for the period of 21 days (3 weeks). Bar bearing superscripts are significantly different between types of diet at the week indicated. Values are mean (± S.E.). ………141 Figure 5.6 Relationship between apparent feed intake (AFI) of three types of diet; mussel gonad
15
LIST OF TABLES
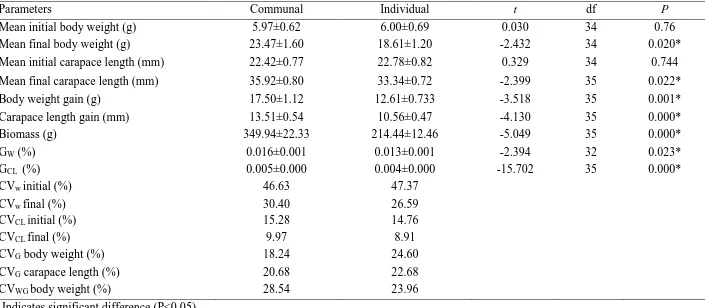
Table 2.1 Comparison of the growth performance of juvenile lobster Sagmariasus verreauxi
when reared either individually (n=17) or communally (n=20) over 90 days. …….… 45 Table 2.2 Details of linear (y= a+bx) regression describing the relationship between observed weight gain (g)and initial body weight (g) of Sagmariasus verreauxi reared communally (n=20) or individually (n=17) over 90 days experiment presented in Figure 2.1 ……..47 Table 2.3 Comparison of the juvenile lobster Sagmariasus verreauxi intermoult period (day) when reared either individually (n=17) or communally (n=20) over 90 days. …………49 Table 2.4 Details of linear (y= a+bx) regression describing the relationship between observed standard metabolic rate (SMR), routine metabolic rate (RMR), active metabolic rate (AMR) and aerobic scope (AS) (mg O2 h-1 g-1) and body weight (g) of Sagmariasus
verreauxi lobsters presented in Figure 2.3 (ANOVA, P <0.05). ……...……….51 Table 2.5 Details of linear (y= a+bx) regression describing the relationship between residual weight gain (r∆W, g) and residual standard metabolic rate (rSMR), residual routine metabolic rate (rRMR), residual active metabolic rate (rAMR) and residual aerobic scope (rAS) (mg O2 h-1) of Sagmariasus verreauxi reared communally or individually over 90
days experiment presented in Figure 2.4...………..…53 Table 2.6 Details of linear regression (y=a+bx) describing the relationship between individual
lobsters residual standard metabolic rate (rSMR), residual routine metabolic rate (rRMR), residual active metabolic rate (rAMR) and residual aerobic scope (rAS) (mg O2
h-1) and apparent feed intake (AFI) of Sagmariasus verreauxi reared individually (n=17) over seven days feeding experiment presented in Figure 2.5. …..….……….55 Table 3.1 The protocol used to score the feeding behaviour and success of the lobster in each pair (modified from (McCarthy, 2001 ; Carter et al., 2014 ; Briones-Fourzán et al., 2014)). ………68 Table 3.2 Summary of feeding contest experience and number of lobsters were reused in all experiments (n=50). ………69 Table 3.3 Models developed to test the effects of size, metabolic rate, sex, contest experience and rearing condition on dominance status of Sagmariasus verreauxi using ordinal regression mixed model (ORMM). ……….76 Table 3.4. Parameter estimates from the ordinal regression mixed model (ORMM) of the effects of lobsters size, metabolic rate, sex, contest experience and rearing condition on the probability of Sagmariasus verreauxi dominance status. …….………..……..77 Table 4.1 Number of Jasus edwardsii pueruli collected monthly from four different collection periods. ………...…95 Table 4.2 Comparison of the growth performance of Jasus edwardsii emergent juvenile
16 Table 4.5 Details of linear regression (y=a+bx) describing the relationship between moulting duration (D) with residual carapace length increment (∆CL) of Jasus edwardsii emergent juvenile presented in Figure. 4.5 (ANOVA, P < 0.05). ……….108 Table 4.6 Coefficient variation of intermoult periods, moult increments and carapace length of
Jasus edwardsii emergent juvenile reared individually and communally. ………110 Table 4.7 Details of linear regression (y=a+bx) describing the relationship between standard metabolic rate (SMR), routine metabolic rate (RMR), active metabolic rate (AMR) and aerobic scope (AS) (mg O2 h-1 g-1) and dry body weight (g) of Jasus edwardsii emergent
juvenile presented in Figure 4.6 (ANOVA, P <0.05).………..112 Table 4.8 Details of linear regression (y=a+bx) describing the relationship between observed standard metabolic rate (SMR), routine metabolic rate (RMR), active metabolic rate (AMR) and aerobic scope (AS) (mg O2 h-1) and dry body weight (g) of Jasus edwardsii
emergent juvenile presented in Figure 4.7 (ANOVA, P <0.05). ….………..114 Table 4.9 Distribution of residual standard metabolic rate (rSMR), residual routine metabolic rate (rRMR), residual active metabolic rate (rAMR) and residual aerobic scope (rAS) (mg O2 h-1) of Jasus edwardsii emergent juvenile reared either communally or
individually. ………...………..116 Table 4.10 Details of linear regression (y=a+bx) describing the between residual carapace length increment (r∆CL, mm) with residual standard metabolic rate (rSMR), residual routine metabolic rate (rRMR), residual active metabolic rate (rAMR) and residual aerobic scope (rAS) (mg O2 h-1) of Jasus edwardsii emergent juvenile reared individually
or communally presented in Figure 4.8 (ANOVA, P <0.05). ………..117 Table 5.1 Details of linear regression (y=a+bx) describing the relationship between apparent feed intake (AFI) and residual standard metabolic rate (rSMR), residual routine metabolic rate (rRMR), residual active metabolic rate (rAMR) and residual aerobic scope (rAS) (mg O2 h-1) of Jasus edwardsii first instar juveniles (J1) third (J3) instar juveniles
17
CHAPTER 1
18
1.1 Overview
Spiny lobsters are valuable and in high demand in international and local seafood markets (Skirtun et al., 2013 ; Francis et al., 2014) but with limited availability due to full exploitation of wild stock (Jones & Shanks, 2008 ; Kenway et al., 2009 ; Linnane et al., 2010 ; Ehrhardt & Fitchett, 2010 ; Phillips & Matsuda, 2011). Present commercial lobster aquaculture, mainly in Vietnam, depends on the capture of wild juvenile seed stock for on-growing to market size (Hung & Tuan, 2008). However, recent developments in spiny lobster hatchery technologies, particularly in Australia (Fitzgibbon & Battaglene, 2012a; Fitzgibbon & Battaglene, 2012b; Jensen et al., 2013a, Jensen et al., 2013b; Fitzgibbon et al., 2017), suggests that closed cycle aquaculture may soon be a reality. To meet both the global demand and to reduce the fishing pressure on wild stocks, the development of spiny lobster aquaculture requires advances in juvenile lobster processes to improve commercial and production efficiencies (Kittaka et al., 1997 ; Williams, 2009 ; Jones, 2010 ; Phillips & Matsuda, 2011).
19 This thesis provides the fundamental knowledge in understanding the influence of intraspecific diversity in physiological traits, behaviour and feeding on growth performance of two commercial temperate spiny lobsters species, Sagmariasus verreauxi and Jasus edwardsii
juveniles in captivity (Crear et al., 2000 ; Jeffs, 2010 ; Kittaka et al., 1997 ; Booth, 2006) . Recent success in the development of spiny lobster propagation technologies at the Institute for Marine and Antarctic Studies (IMAS), University of Tasmania provided the unique opportunity to examine the phenotypic traits of hatchery reared S. verreauxi early juveniles from known genetic pools. Although it is possible to produce hatchery reared J. edwardsii (Tong et al., 1997 ; Tong et al., 2000 ; Jeffs, 2010), wild emergent juveniles were examined in preference because the long planktonic larval phase which lasts up to two years makes
J.edwardsii more difficult to culture and less available (Phillips & Sastry, 1980 ; Booth & Phillips, 1994). Investigating both hatchery-produced and wild stock juveniles provides an opportunity to examine how the relationship between physiology, behaviour and feeding traits of individual lobsters and growth may differ between species and environments
The aim of the current chapter is to provide background information on: 1) spiny lobsters, aquaculture practice and issues in their production, 2) the limited available information on abiotic and biotic factors affecting the growth of spiny lobsters, 3) information pertaining to energy metabolism, social behaviour and feeding for fish and crustaceans and 4) the thesis aims and structure.
1.2 Biological characteristics 1.2.1 Systematics and taxonomy
Spiny lobsters, also known as rock lobsters, constitute the family Palinuridae which is in the phylum Arthropoda, class Malacostraca and order Decapoda. Palinuridae is divided into two main evolutionary lineages; Stridentes and Silentes, based on the presence or absence of the stridulating organ which is located at the base of the antennae (Bouwma & Herrnkind, 2009; Staaterman et al., 2010). Stridentes consist of the genera Panulirus, Justitia, Palinurus, Palinustus, Linuparus, Puerulus and Palibythus, while Silentes consist of the genera Jasus, Sagmariasus, Projasus and Palinurellus (George, 2006).
Jasus (Parker, 1883) is the most diverse genus of the Palinuridae in the Southern Hemisphere, encompassing five species; Jasus edwardsii (Hutton, 1875), Jasus lalandii (H. Milne Edwards, 1837), Jasus paulensis (Heller, 1862), Jasus tristani (Holthuis, 1963) and
20 were insufficient differences to differentiate between the species (Groeneveld et al., 2012). All five species were reported to be biologically and morphologically very similar with relatively little genetic divergence among species (Ovenden, et al., 1997).
The genus Sagmariasus is represented by a single species, Sagmariasus verreauxi (H. Milne Edwards, 1851). Earlier, this species was placed in the genus Jasus, but in 2002 was separated to the subgenus Sagmariasus because of differences in morphological and behavioural characteristics (Booth et al., 2002; Booth, 2006). This decision has subsequently been validated by molecular genetic data (Palero et al., 2009; Tsang et al., 2009).
1.2.2 Life cycle
The life cycle of Jasus and Sagmariasus species appears to be relatively long. The eggs hatch as the short-lived (hours) and small (1-2 mm long) naupliosoma stage before moulting into the thin, leaf-like phyllosoma larvae (MacDiarmid, 1985). The phyllosoma develops through 11 distinct morphological stages and 17 moults taking from 8 to 24 months to complete (Booth, 1994). During this phase phyllosoma mainly feed on zooplankton (Phleger et al., 2001). With a limited swimming ability, the planktonic phyllosoma are dispersed long distances offshore before metamorphosing into a completely transparent non-feeding nektonic pueruli which travels from beyond the continental shelf to the coast and settles in shallow water (Booth, 1986; Jeff et al., 2001a). The puerulus resembles the adult form with associated pigmentation occurs 2-4 weeks after metamorphosis and moults into the first instar juvenile with pale colouration that changes to the distinctive colour of the adult after several moults (Edmund, 1995). The first instar juvenile stage mainly feed on molluscs, crustaceans, polychaetes, echinoderms and some algae (MacDiarmid & Booth, 2003; Redd et al., 2008). Juvenile and adult stages live in shallow water, mainly inhabiting rocky reef, sand or mud substrates at a depth of a few metres to about 200 meters (Holthuis, 2002).
a. Eastern rock lobster, Sagmariasus verreauxi
21 at an average of 167 mm carapace length (CL), and can carry up to 1.9 million eggs for several months during the breeding season which only occurs once a year (Kensler, 1967 ; Booth & Phillips, 1994). In winter or early spring, the adults will move inshore to moult, mate and extrude eggs (Booth, 1997).
b. Southern rock lobster, Jasus edwardsii
Jasus edwardsii is commonly known as the red rock lobster or southern rock lobster and widely distributed throughout coastal waters of New Zealand (Booth, 2000) and southern Australia (Phillips et al., 2000). This species is an even more important commercially exploited species in Australia and New Zealand (Jeffs et al., 2013). The species can grow up to 235 mm CL for male and 180 CL for female (Holthuis, 1991). Male J. edwardsii become sexually mature between 55 and 85 mm CL whereas for females it is between 60 and 120 mm CL (MacDiarmid, 1989; Turner et al., 2002; Annala et al., 1980). Breeding of J. edwardsii occurs in winter shortly after the female moults. Spawning of female occurs once a year, in autumn (April to May), and the eggs hatch in spring to summer (September to January) (Booth, 2006).
1.3Spiny lobsters aquaculture
22 the larval culture of these spiny lobsters are required before successful commercial-scale production.
The sustainable development of spiny lobster aquaculture sector worldwide depends on having a reliable supply of seed. Currently, the entire global lobster aquaculture practice of spiny lobsters is based on the on-growing of wild-caught stock (pueruli and early juveniles) from fisheries which are now either at their maximum sustainable yield or overexploited and in decline (Phillips, 2000 ; Phillips, 2005 ; Jeffs et al., 2013 ; Francis et al., 2014). In countries such as Vietnam and Indonesia, juvenile spiny lobsters are collected from the wild and stocked into floating sea cages then fed with trash fish for several months until they reach marketable size (Hung & Tuan, 2008 ; Priyambodo, 2008 ; Long & Hoc, 2009 ; Ngoc et al., 2009). Sea cage production is the preferred method of culture, especially in South East Asian countries, due to its low capital cost and its effectiveness as a juvenile lobster grow-out system. In Australia, this system is not as practical due to a limitation in infrastructure and other factors such as biological (predators), physical (tidal, cyclones), geographical, cultural and environmental impact (Kenway et al., 2009). Hence, intensive land-based culture is a more preferred method in developed countries such as Australia, as this allows better control of culture parameters and environmental impact. However, further research is required to improve growth and production efficiencies to make it economically feasible.
1.3.1 Growth of spiny lobsters
In arthropods, growth is defined as the accumulation of new tissue which involves a continuous process that only becomes apparent when the animal moults by shedding its old rigid exoskeleton and expand its size during the process called ecdysis. The growth rate of an individual lobster is the outcome of two factors; (1) the time from one ecdysis to the other or known as the intermoult period, and the size increase at ecdysis or described as moult increment. Moult increment is usually measured as carapace length or as body weight. Moult frequency decreased as the individual lobster age increases (Phillips & Sastry., 1980). According to Travis (1954), smaller lobsters are reported have greater percentage of growth by weight. However, as the lobster moult, larger lobsters gain more actual weight in comparison to smaller lobsters.
23 (Aiken & Waddy, 1988). Waddy et al. (1995) suggested that small differences in initial size at hatch may be an important factor in determining individual growth trajectories when lobsters are reared communally. Other factors that have been reported to play a role in individual lobster growth include temperature, light and photoperiod, nutrition and food availability, stocking density, space and shelter, and behavioural and social conditions (Tong et al., 2000 ; Thomas et al., 2000 ; Crear et al., 2000 ; Thomas et al., 2003 ; Bryars & Geddes, 2005 ; Simon & James, 2007 ; Perera et al., 2007 ; Fitzgibbon & Battaglene, 2012b ; Carter et al., 2014 ; Fitzgibbon et al., 2017). Prolonged inter-moult duration, reduced growth increment, and even shrinkage can result from stressful environmental conditions (Cockcroft & Goosen, 1995 ; Irvin & Williams, 2008), which may have important implications for population dynamics and management.
The most common practice in most spiny lobster culture is to hold and rear the lobsters communally. Previous research on P. ornatus has demonstrated that lobsters in communal culture grow significantly faster than those reared individually, however, the survival rate of individually cultured lobsters was higher, probably due in part to the lack of cannibalism (Irvin & Williams, 2008 ; Ratunil Jr, 2017). One of the major issues in the juvenile lobster grow-out system is the increase in variation of a population size distribution with time due to individual differences in growth rates leading to growth disparity and growth depensation and, impacting on biomass production and uniformity of production in aquaculture (Irvin & Williams, 2008 ; Vijayakumaran et al., 2010 ; Carter et al., 2014 ; Ratunil Jr, 2017). According to Thomas et al. (2003), growth disparity in spiny lobsters is linked to the agonistic behaviour of dominant individuals, whereby they control and consume a disproportionate share of food resources, benefiting their growth performance. Further research is required to understand the basis for individual differences in behavioural traits and how it can influence growth disparity and depensation to improve lobster welfare and increase the profit of production.
1.4 Energy metabolism
24 The SMR is an estimation of a minimum metabolic rate where the individual animal is in a post-absorptive and inactive state (Chabot et al., 2016). It is the most useful measurement in intra and inter-specific comparisons because it allows a standard reference of an unstressed animal for species comparisons (Radull et al., 2002). The SMR can be measured when an animal is inactive without metabolic costs associated with digestion, stress and previous anaerobic activity (McNab, 1988 ; Hulbert & Else, 2000 ; Frappell & Butler, 2004). During measurement of SMR, the energy used is for processes such as the maintenance of the mitochondrial H+ gradient, protein turnover, repair or turnover of cellular structures, active transport of solutes, blood circulation and ventilation (Rolfe & Brown, 1997 ; Hulbert & Else, 2000).
Routine metabolic rates (RMR) includes by definition costs for spontaneous activities. The RMR is measured when the animal is still inactive but not necessarily at the lowest rate (Biro & Stamps, 2010). Active metabolic rate (AMR) is the maximum rate of aerobic metabolism and is a measure of the maximal level of oxygen consumption (Bennett, 1978). The most accurate method to measure AMR in crustacean is using chase protocols where the animal is exercised to near exhaustion (Booth & McMahon, 1992 ; Jimenez et al., 2008 ; Fitzgibbon et al., 2014b). Animals (including lobsters) typically display an increase in metabolic rate which is referred as excess post-exercise oxygen consumption (EPOC) which is above SMR after the chase exercise (Lee et al., 2003 ; Fitzgibbon et al., 2014b). The maximum metabolic rate under this condition is equivalent to the aerobic capacity (Steffensen, 2002 ; Fitzgibbon et al., 2014b). Aerobic scope (AS) is the capacity to perform oxygen-consuming processes above the minimum metabolic requirements and the ability to compensate for physiological challenges (Djawdan et al., 1997; Bochdansky et al., 2005; Killen et al., 2007). Metabolic rates (MR) of individuals are not constant and there are many factors that have been shown to affect MR of aquatic animals including temperature, body size, life history, lifestyle (benthic vs pelagic) and food availability (Jobling, 1981; Thomas, et al., 2000; Dowd et al., 2006; Ohlberger et al., 2007; Perera et al., 2007; Seppänen, et a., 2010, Killen et al.,
2010; Vijayan et al., 2010; Auer et al., 2016). In spiny lobsters, various factors have also been
studied and confirmed to affect lobster MR including temperature, animal size, feeding activity, stocking density and moulting cycle (Buesa, 1979 ; Crear & Forteath, 2000 ; Fitzgibbon & Battaglene, 2012b ; Jensen et al., 2013a ; Jensen et al., 2013b ; Fitzgibbon et al., 2017). In J. edwardsii, SMR typically increases exponentially with temperature where the oxygen consumption increases approximately five times from 0.01 mg O2/g/h at 5oC to 0.05 mg O2
25 by an allometric relationship (Schmidt-Nielsen, 1972). According to Rosenfeld et al. (2015), the mass-specific metabolic rate declines through ontogeny as mass approaches adult size. In juvenile S. verreauxi, the SMR and AMR are reported to be strongly related to body mass with an allometric scaling exponent of 0.91 and 0.81, respectively (Jensen et al., 2013a).
Metabolic phenotypes are reported to be a key physiological trait which can determine the performance of an organism (Metcalfe et al., 1995; Brown et al., 2003 ; Biro & Stamps, 2010 ; Killen et al., 2014; Killen et al., 2016b; Metcalfe et al., 2016a; Killen et al., 2017). Individuals within a species can also differ widely in their rate of energy metabolism (Burton et al., 2011 ; Auer et al., 2015a ; Metcalfe et al., 2016a). For example, research by Burton et al. (2011) and Metcalfe et al. (2016a) reported that metabolic phenotypes of fish could vary up to threefold among individuals within the same cohort even after correcting for the effect of size, age and sex. Metabolic phenotypes have also been linked with mechanisms that can influence the fitness of an organism such as growth, reproduction, survival, dominance and lifespan (Metcalfe et al., 1995 ; McCarthy, 2000 ; Perera et al., 2007 ; Moltschaniwskyj & Carter, 2010 ; Burton et al., 2011 ; Metcalfe et al., 2016). Individual metabolic rate may also influence locomotor ability (Reidy et al., 2000), dominance and aggression (Brown et al., 2003 ; Biro & Stamps, 2010) which may then affect individual food consumption and growth (Millidine et al., 2009 ; Auer et al., 2015a ; Auer et al., 2015c). However, the relationship between metabolic phenotypes and fitness can differ depending on environmental conditions (McKechnie, 2008). An environment with an abundance of food, such as in captivity can be a benefit for individuals with a high SMR (McCarthy et al., 1994 ; Millidine et al., 2009). Conversely, a low SMR can be beneficial under unfavourable conditions, i.e. food scarcity, (Álvarez & Nicieza, 2005).
26 performances (behaviour, growth and feeding) there was to my knowledge no information available on how spiny lobsters metabolic phenotypes may influence individual lobster performances. Further research was needed to understand the basis for individual variation in spiny lobsters metabolic phenotypes and how it could possibly influence individual growth performance and growth disparity when reared in captivity.
1.4.1 Measurement of metabolic rates
In crustaceans, static (closed) respirometer systems have been used to measure respiration rates, where the oxygen level is measured only at the start and end of an experiment (Steffensen, 1989 ; Anger, 1996 ; Bermudes & Ritar, 2008 ; Fitzgibbon & Battaglene, 2012b). Static respirometry provides an average measurement of MR over long periods by comparing the initial oxygen concentration of the water with the final oxygen concentration. Thus, by using this method, it is impossible to segregate periods of rest from periods of high activity. Therefore, measurements made in static respirometer systems are at an intermediate routine metabolic rate (RMR) (Schmidt-Nielsen, 1997). Static respirometry may be appropriate to use to estimate SMR for inactive marine species under conditions of zero swimming activity (when activity levels are monitored) (Killen et al., 2007).
However with lobsters, there may be substantial variation in RMR due to changes in behaviour between inactive to short periods of activity (Perera et al., 2005). The RMR can differ depending on an animal's state of activity, and this can lead to considerable experimental error (Anger, 1996).
27
rubellus (Kemp et al., 2009). An automated intermittent flow-through respirometry system described in the study of S. verreauxi pueruli was effective in making accurate repeat measurements of respiration over extended periods facilitating an advanced examination of pueruli metabolism (Fitzgibbon, 2010 ; Fitzgibbon & Battaglene, 2012a ; Fitzgibbon et al., 2014a ; Fitzgibbon et al., 2017).
1.5 Social behaviour
Social interaction plays a significant role in the life history of lobsters as it is important for the survivorship, growth, reproduction, movement during different season and life history stages (Atema & Cobb, 1980 ; Herrnkind, 1980 ; Lawton & Lavalli, 1995). Social behaviour refers to any form of behaviour that involves interaction and communication between two or more individuals of the same species (Atema & Cobb, 1980).
Agonistic behaviour is a part of social behaviour which involves fighting between two or more individuals. Animals often show agonistic behaviour when there are limited resources such as food, shelter and mates (Atema & Cobb, 1980 ; Davis & Olla, 1987 ; Ryer & Olla, 1996). Some animals show agonistic behaviour as a test of strength or threat display to make them look large, physically fit and dominant. Agonistic behaviours vary among species and consist of three types of behaviours; threat, aggression and submission. Agonistic interaction can range from a fight to the death depending on the availability and importance of a resource (Cobb & Phillips, 1980). Aggression refers to offensive behaviour whereas aggressiveness, and aggressive motivation are similar terms used to explain the state of the animal and the probability of it winning an agonistic encounter (Cushing & Reese, 1998). Dominance is the status of an animal describing the likelihood of it succeeding in encounters with conspecifics, and can be characterized by the behavioural differences between individuals. Reproductive cycle and community structures are two essential parts of social behaviour (Cobb & Phillips, 1980).
28
J. lalandii, P. cygnus, P. guttatus, P. longipes and P.argus (Fielder, 1965a; Fielder, 1965b; Berrill, 1976; Cobb, 1981; Thomas et al., 2003; Segura-García et al., 2004; Moyle et al., 2009; Carter et al., 2014; Briones-Fourzán et al., 2014; Lipcius & Herrnkind, 1982).
In spiny lobsters, an aggressive encounter is initiated by the approach of one animal toward another (Cobb & Phillips, 1980 ; Butler et al., 1997 ; Barshaw et al., 2003). The aggressive state can be observed from the postures of the two animals including the position of the abdomen, pereiopods, urupods and pleopods. Lobsters typically display dominance by standing high on their legs with the abdomen and uropods extended, the telson and uropods held in the horizontal plane, and pleopods extended downwards. Defeated lobsters often show a submissive posture by standing low on their legs, with the tail tucked tightly under the body and uropods and pleopods folded. A dominant spiny lobster will stand high on its legs with abdomen, pleopods, and uropods extended and the tail fan held slightly below the horizontal plane when it is approaching a conspecific. The lobster being approached may either show a similar posture or will avoid the approaching animal by walking away low on its legs with tailed curled. During the approach, one or both lobsters may use the antennae or antennules to contact the other lobster. During an aggressive approach, the most common postures are chase, clasp and flee. Termination of an encounter is marked when one of the lobsters retreats by walking away forward or backward, or tail flips in retreat (Atema & Cobb, 1980; Cobb, 1981; Segura-García et al., 2004; Carter et al., 2014).
1.5.1 Dominance and hierarchy
An outcome of encounters between animals is influenced by many factors such as size, sex, moult stage, recent agonistic experience and energy metabolism (Karavanich & Atema, 1998). According to Fielder (1965b), larger males of J. lalandii are able to dominate and retain shelter over smaller lobsters. In H. americanus and J. edwardsii, individual size was found to be the primary factor influencing the aggressive rank with males conferring an advantage (Roth, 1972 ; Cobb et al., 1982 ; Thomas et al., 2003). Larger individuals are often found to become more dominant and aggressive, able to consume more food and grow faster than the smaller (subordinate) individuals (Thomas et al., 2003). In J. edwardsii, the larger individuals are regularly able to maintain their dominant status when feeding opportunities are restricted. However, as feed availability increased, fewer of the initially largest size-ranked lobsters maintained their status (Thomas et al., 2003).
29 stable dominance relationship. The results suggest that H. americanus are capable of individual recognition where subordinates will immediately back away from familiar dominants and avoid the second fight when the lobsters are paired (dominant and subordinates). In contrast, studies with crayfish, Procambarus clarkii shows that the formation of linear dominance hierarchies does not involve learned individual recognition (Copp, 1986).
Moulting status has also been found to be one of the factors influencing the aggressive rank with moulting activity typically suppressing aggressiveness of dominant individuals. The aggressive rank of P. cygnus individuals that have just moulted, or are about to moult, was found to markedly drop and remain at the lowest rank for 2 or 3 days after moulting until the exoskeleton hardened (Cobb & Phillips, 1980). Juveniles of M. rosenbergii lost more fights before the moult, however, were able to retain rank after moulting (Bovbjerg, 1953 ; Brown et al., 2003).
Dominant and subordinate animals have different behaviours. Studies on a group of P. cygnus showed that the lowest ranked individual displayed submissive behaviour by not making any attempts to enter the shelter and avoiding all other approaching animals. Meanwhile, the dominant lobsters had access to all shelters and moved around the entire aquarium (Cobb & Phillips, 1980). The higher ranked spiny lobsters also have the advantage in gaining food by preventing the subordinate’s food intake by behaviourally inhibiting the subordinate’s feeding behaviour (Koebele, 1985).
In fish and crustaceans such as Atlantic salmon Salmo salar, brown trout Salmo trutta
30
1.6 Feeding
1.6.1 Feeding preference
Feeding plays an important role in determining the success of spiny lobster culture. Knowing the food preference of spiny lobsters in the wild is useful information when providing the best diet and developing an artificial feed, and to improve their feeding performance such as feeding intake and feeding capacity which indirectly may improve their growth performance. In the wild, the natural diet of spiny lobsters predominantly consists of molluscs, crustaceans, polychaetes, echinoderms and some algae (Edmunds, 1995; Saunders et al., 2012; Jeff et al., 2013). In most spiny lobster culture practice particularly in South East Asia, fresh fish by-catch has been used as the main natural food source (Williams, 2009). However, previous studies have demonstrated that mussels are an excellent natural food source for spiny lobster (James & Tong, 1997; Williams et al., 2005 ; Simon & James, 2007 ; Williams, 2009 ; Francis et al., 2014 ; Perera et al., 2005 ; Perera & Simon, 2015). In the wild the natural diet of spiny lobsters consists of wide variety of food types, and earlier research has shown that spiny lobsters are “picky eaters” being selective towards their preferred food (Eurich et al., 2014 ; Williams, 2009 ; Williams et al., 2005). Previous studies have also proven that spiny lobsters were more attracted to fresh mussels over artificial diets (Crear et al., 2000 ; Tolomei et al., 2003 ; Dubber et al., 2004 ; Williams et al., 2005 ; Simon & James, 2007), and improved their food consumption and growth performance when fed on mussels compared to formulated feeds (Tsvetnenko et al., 1999 ; Williams et al., 2005 ; Dubber et al., 2004 ; Simon & James, 2007). Fresh mussels provide better performance due to their nutritional composition as well as other factors such as digestibility and nutrient assimilation (Williams, 2009).
1.6.2 Feed intake
31 be able to consume more food per day (Auer et al., 2015a ; Auer et al., 2015b ; Auer et al., 2015c; Killen et al., 2016a). Earlier studies demonstrated that fish with higher metabolic rate tend to grow faster in high food environments (Rosenfeld et al., 2015 ; Metcalfe et al., 2016a) because of their high cost of maintenance and higher assimilation efficiency (converting ingested food to energy for growth and reproduction) requiring greater amounts of food consumption to uphold their large “metabolic machinery” (Van Dijk et al., 2002 ; Hou et al., 2008 ; Millidine et al., 2009 ; Biro & Stamps, 2010 ; Auer et al., 2015b ; McKenzie et al., 2015 ; Allen et al., 2016 ; Killen et al., 2016a).
1.7 Thesis aim and structure
The successful production of spiny lobsters in captivity has been hampered by the large inter-individual variation in growth rate leading to growth disparity and ultimately reduced lobster biomass. One explanation for the growth disparity in spiny lobsters is the agonistic behaviour of dominant individuals, whereby they control and consume a disproportionate share of food resources, benefiting their own growth performance. Nevertheless, the mechanisms of how behavioural and feeding traits of individual lobsters can affect growth disparity in culture are poorly understood. Previous research of a range of marine organisms has hypothesised that behaviour and growth can be influenced by the variability in individual metabolic physiology. However, the correlation between metabolic physiology and individual growth performance has not been previously investigated in any spiny lobster species. Thus, the ultimate aim of this thesis is to understand the influence of intraspecific diversity in physiological traits, behaviour and feeding on growth performance of individual spiny lobsters in captivity. These are important considerations for the development of optimal rearing conditions and management strategies for spiny lobsters aquaculture. This is the first study to focus on the influence of individual variation in physiology, behaviour and feeding on the growth performance of two commercial temperate spiny lobsters species, Sagmariasus verreauxi and Jasus edwardsii
32
Chapter 2 to investigate the influence of metabolic phenotype and social behaviour on growth performance of early juvenile S. verreauxi that were reared either individually or communally.
Chapter 3 toexamine the effect of individual variation of metabolic phenotype, body size, sex, feeding contest experience and rearing history on social status of early juvenile S. verreauxi
using a pair-feeding contest behavioural studies.
Chapter 4 to examine the influence of intraspecific body size variation, metabolic phenotype and social behaviour on growth performance of emergent juvenile J. edwardsii that were reared either individually or communally.
Chapter 5 to investigate the relationships of metabolic phenotype on individual feed intake and growth performance of the emergent juvenile of J. edwardsii, and identify the food preference amongst current best diets of the emergent juveniles using a multiple-choice feeding experiment and linked with individual growth performance.
33
CHAPTER 2
IS INDIVIDUAL VARIATION IN METABOLIC RATE
RELATED TO GROWTH OF SPINY LOBSTER IN CULTURE
AND WHAT IS THE INFLUENCE OF SOCIAL
34
2.1 ABSTRACT
Slow growth, growth disparity and growth depensation have been reported as major drawbacks to the successful production of spiny lobsters in captivity. This is thought to be associated with agonistic behaviour of dominant individuals controlling a disproportional share of food resources compared to the subordinates. Previous research with variety of aquatic ectotherms suggest that variation in individual metabolic rate (i.e., metabolic phenotype) can be a factor that determines the behaviour and growth of individuals, however, the relationship has not been previously examined in any spiny lobster species. This study examined the relationship between individual variation of metabolic phenotypes (standard, routine and active metabolic rates and aerobic scope), and growth performance of juvenile spiny lobster, Sagmariasus verreauxi (5.99±0.46g) that were reared either individually (n=17) or as a group of 20 communally for 90 days. Growth performance, survival and feed intake were significantly higher in communal rearing demonstrating that social interaction is important for promoting growth of lobsters. There was a positive relationship between standard metabolic rate, routine metabolic rate and growth in individually reared lobsters indicating a direct link between metabolic phenotype and growth of lobsters in the absence of social interaction. The effect of social interaction in communal rearing outweighed the direct link between metabolic rate and lobster growth. The results demonstrate that growth performance of spiny lobsters is linked with individual variation in metabolic status with social behaviour playing an important role in determining the growth of individuals.
35
2.2 INTRODUCTION
Metabolic rate (MR) is considered the aerobic energetic cost of living which is required for an organism to perform, process and function in order to support life (Hulbert & Else, 2000). At the very minimum, an individual must expend energy to sustain life and maintenance of tissue (Secor, 2009). This baseline energy expenditure is known as standard metabolic rate (SMR) in aquatic ectotherms (Auer et al., 2015a). The average rate of metabolism when the animal is undergoing minimum motor activity is known as routine metabolic rate (RMR) (Metcalfe, 2015) whereas the upper boundary for aerobic energy metabolism is known as active metabolic rate (AMR) (Burton et al., 2011 ; Auer et al., 2015a). By subtracting the minimal from the maximal MR, the total amount of aerobic energy available to the animal can be measured. This measurement is known as aerobic scope (AS) (Auer et al., 2015a ; Metcalfe et al., 2016a ; Killen et al., 2007 ; Norin & Malte, 2011 ; Clark et al., 2013).
Metabolic rate is a key physiological trait which can determine the performance of an organism (Carter & Brafield, 1991 ; Brown et al., 2003 ; Biro & Stamps, 2010). Most active organisms such as pelagic fish tend to have a higher MR compared to inactive species. (White & Seymour, 2004). For some fish and crustaceans, MR can be heritable (Briffa et al., 2008 ; Nilsson et al., 2009 ; Wone et al., 2009) and repeatable throughout time (McCarthy, 2000 ; Labocha et al., 2004 ; Nespolo & Franco, 2007 ; Maciak & Konarzewski, 2010 ; Norin & Malte, 2011). Individuals within a species can also differ widely in their rate of energy metabolism, known as metabolic phenotype (Burton et al., 2011 ; Auer et al., 2015a ; Metcalfe, 2015). Burton et al. (2011) and Metcalfe (2016a) reported that metabolic phenotype of can be vary up to threefold among individuals within the same cohort even after correcting for the effect of size, age and sex.
36 Previous studies of teleosts in captivity have shown that individuals with higher metabolic rate can be more dominant, aggressive and grow faster resulting in a size advantage that ensures a higher rank in a social hierarchy (McCarthy, 1994 ; Metcalfe et al., 1995 ; Yamamoto et al., 1998 ; Millidine et al., 2009). Similarly, studies on crustaceans such as giant freshwater prawn, Macrobrachium rosenbergii, have also shown that rates of both aerobic and anaerobic metabolism can be important in social interactions, such as fighting, which may affect their growth and survival in rearing (Smith & Taylor, 1993 ; Thorpe et al., 1995 ; Taylor et al., 2002 ; Brown et al., 2003).
Spiny lobsters are known to be aggressive and highly gregarious animals with complex social behaviours which they use for the development of social hierarchies (Shabani et al., 2009), shelter selection (Segura-García et al., 2004; Briones-Fourzán et al., 2008), predator avoidance (Briones-Fourzán et al., 2014) and even behavioural immunity (Anderson and Behringer, 2013; Butler et al., 2015; Candia-Zulbarán et al., 2015) in the wild. In the rearing of spiny lobsters, slow growth and great growth disparity and depensation have been reported as the major drawbacks to the successful production in captivity (Irvin & Williams, 2008 ; Carter et al., 2014). Thomas et al. (2003) reported that the growth depensation in spiny lobster rearing is often associated with hierarchical social structure and agonistic behaviour where the dominant individuals control a disproportionate share of food resources compared to the subordinates. Due to differences in food intake, individuals grow at different rates which can cause an increase in variance of a size distribution with time. The relationship between metabolic phenotype, dominance behaviour and growth of spiny lobsters in rearing has not been previously examined. The present study aimed to examine the influence of metabolic phenotype and growth performance of juvenile eastern rock lobster, Sagmariasus verreauxi in captivity.
37 Furthermore, information on individual performance in rearing may allow improved selection of broodstock in a selective breeding program to optimize growth and uniformity of production.
2.3 MATERIALS AND METHODS 2.3.1 Experimental animals
Early stage juvenile S. verreauxi were reared from eggs at the Institute for Marine and Antarctic Studies, Hobart, Australia. Larvae were hatched on the 11th of January 2013 from captive wild -caught females and hatchery reared to the final instar phyllosoma as described by Fitzgibbon and Battaglene (2012b). After metamorphosis, pueruli were communally reared in a 100-l cylindrical vessel which received flow-through filtered sea water at three exchanges per hour and maintained at 21oC with a light regime of 16 h light and 8 h dark. No feed was provided to the lecithotrophic puerulus stage. First instar juveniles were then transferred into a 100-l rectangular rearing vessel which received flow-through filtered seawater at three exchanges and fed once per day with split fresh blue mussels (Mytilus galloprovincialis) to excess. All uneaten feed was removed from the rearing system before subsequent feeding and tanks were cleaned weekly.
Before commencement of the experiment, sixty juvenile lobsters (300 days post hatching) were randomly removed from mass rearing and placed into two 32-l cylinder tanks (n=30 in each tank) receiving filtered flow through seawater at a temperature of 21±1oC and
light regime of 12 h light and 12 h dark for 42 days. During this period, individual oxygen consumption rate (Ṁo2) was measured (refers to the Ṁo2 method below). During holding,
38
2.3.2 Individual and communal rearing experiment
The experiment was conducted under two rearing conditions; individual rearing and communal rearing. Both rearing conditions received the same seawater supply at a flow rate of three water exchanges h-1. For individual rearing, 20 lobsters were initially stocked into 20 black cylindrical vessels (13 cm diameter and 12 cm height) with water volume of 1.6 l and floor surface of 132 cm2, with a single cylindrical shelter made from 3 mm x 3 mm high-density polyethylene oyster mesh (12 cm length x 5 cm diameter) in order to minimise stress. Communal rearing involved 20 lobsters stocked into a single vessel (58 cm diameter and 12 cm height) of similar colour and shape. Stocking density for both treatments were 0.37 lobster m-2. Due to the limited number of experimental animals, the communal rearing could not be replicated. The water volume and surface area was proportionally the same but 20 times greater than that for individual rearing (32 l and 2642 cm2), with 20 cylindrical shelters provided. The initial coefficient of variation for body weight (CVw) and carapace length (CVCL) in communal
rearing was 46.63% and 15.28%, respectively, whereas in individual rearing it was 44.72% and 13.72%, respectively. All lobsters in both rearing conditions were fed to excess once per day with split fresh blue mussels. In individual rearing, one split mussel per day was fed to each lobster whereas the communal rearing vessel received 20 split mussels per day (i.e. one mussel per lobster per day). One split mussel per individual was established to be excess of satiation for the lobsters examined.
The water quality parameters (pH, dissolved oxygen and temperature) were measured daily and maintained at temperature 20-22oC, salinity 33-35, pH 8.1 and 80-100% oxygen saturation. Light was provided from fluorescent tubes with a 12:12 photoperiod. Between 08:00 and 09:00 am vessels were checked for moulting or mortality, all moulting and mortality were recorded and removed. Moulted lobsters were identified by identifying juveniles without tag. The new exoskeletons of the moulted lobsters were allowed to harden before weighing BW, measuring CL and re-tagging with numbered polymer tag. All uneaten feed and moults were collected immediately before feeding and faeces were siphoned. The experiment was terminated after 90 days.
2.3.3 Oxygen consumption rate (Ṁo2)
Before commencement of the rearing experiment the oxygen consumption rate (Ṁo2)