Deliverable Factsheet
Date: 30/9/2014
Deliverable No. D6.7
Work Package WP6
Partner responsible (Lead beneficiary) P3 (ORC)
Other partners participating P1, P2, P4, P5, P6, P7, P8, P14, P15
Nature R=Report
Dissemination level PU=Public
Delivery date according to DoW 31.08.2014 (Month 32)
Actual delivery date 30.09.2014 (Month 32)
Finalization date 30.09.2014 (Month 32)
Relevant Task(s):
Report on the case studies which resulted in (improved) market reports in UK, France, Germany, Italy, Czech Republic and Mediterranean
Brief description of the Deliverable
Report on the experience of carrying out the case studies Target audience(s)
Organic market data collectors (within the project and out-with the project) Publishable Summary
The case studies in the Organic Data Network Project had two main aims:
To facilitate the exchange of experience, knowledge and methods of organic market data collection, firstly between the organisations publishing the reports, and secondly between these organisations and researchers of the OrganicDataNetwork.
To publish improved (Germany, France, Italy, Czech Republic and UK) or new (MOAN - Mediterranean Organic Agriculture Network, which includes several EU candidate and potential candidate countries) market reports (see Deliverable 6.1 to 6.6 of this project).
This report summarises the experience in relation to lessons learned from the case studies; which are relevant to other stakeholders involved with, or planning to set up, data collection of organic market data. The report covers categories such as primary production (e.g. crop areas, livestock numbers, yields and production values and volumes), domestic trade/retail (including combining different data sources for the various sales channels), farm level and retail prices and international trade data and presents some conclusions across the different data categories. The common case study protocol included a status quo analysis of data collection in 2011/12 (summarised in Appendix B) which led to country-specific work programmes for improving data quality through comprehensive data checking, and limited new data collection (within the available budget; see Appendix C for details ).
Data category Chapter UK DE FR CZ IT MOAN
Production data 4
Domestic trade/retail 5
Farm-level and retail prices 6 & 7
International trade 8
The experience showed that collaboration among researchers and national bodies who publish market data has resulted in the implementation of additional or improved data collection methods and quality checks. The following main lessons were learned:
Production data
Private bodies may develop their own data categories; dialogue is often required to achieve harmonisation with Eurostat categories.
FADN data can provide additional information about production (e.g. yield, farm-level prices), especially if sample sizes are sufficiently large to give good coverage of organic farms.
Producer surveys can also supplement production data, targeting specific data gaps and providing more up-to-date insights; but survey fatigue of organic farmers is a potential issue. Estimating yields to calculate volume and value of production should make use of a combination
Domestic retail sales data
No data source covers all market channels through which organic products are regularly sold. A combination of different sources and approaches is necessary to develop an estimate of the value of the total organic market.
Sales through multiple retailers are collected through panel data (household or retail); users of such data should be aware of the likely coverage and advantages and limitations of the methods used.
Product classification systems are not harmonised (market research companies use their own in-house systems) which hampers cross checking and comparisons between different sources, over time and between countries.
Different approaches exist for estimating sales through specialist organic and artisan shops (e.g. butchers and bakers), direct sales and catering; for example through surveys among members of umbrella organisations (e.g. of farmers’ markets and farm shops), collaboration with trade/sector bodies or specialist panels for organic shops.
Farm level and retail price data
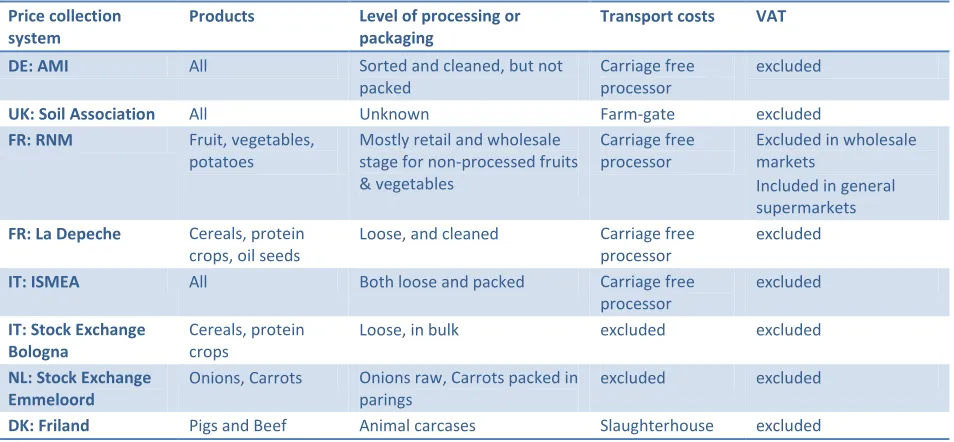
When comparing different methods for farm-level price data collection, it is necessary to consider where in the supply chain the data are collected (e.g. farm-gate, including or not transport/delivery costs etc.), differences in publication dates and frequencies, differences in product categorisation, and VAT inclusion (and rate) or exclusion.
If retail price data are collected by market research companies, access to non-up-to-date data may be possible at lower costs or free of charge. These data can be very useful in providing information on price trends and market development.
When comparing retail price data (e.g. organic with conventional), it is necessary to compare products of similar quality and packaging.
International trade data (import/export)
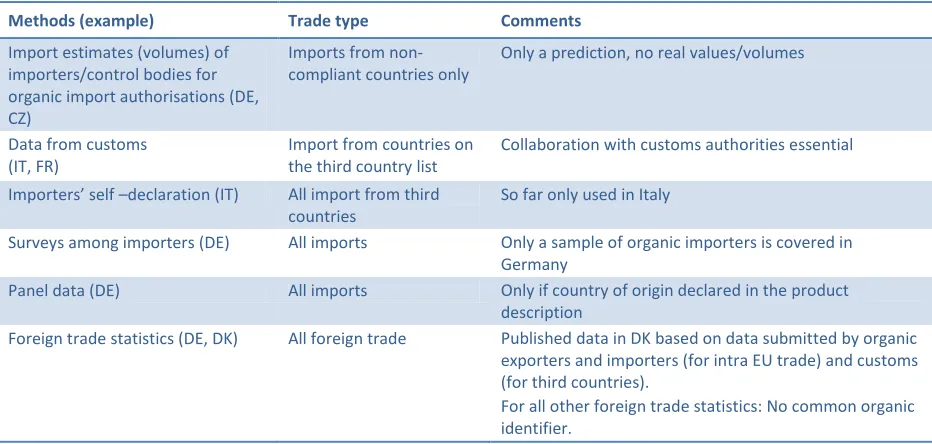
This category covers both imports from within EU and from non-EU countries, which represents an important part of domestically consumed organic products in most Member States.
Special customs provisions are made for import of organic products from outside the EU as part of the organic import regime. This could result in some data becoming available if either a common code would be used in the Single Administrative Document (SAD) (e.g. national code or the C644 code (Certificate of organic inspection)); Box 44 is already used for this purpose in some countries.
Other collection methods to gather export and intra EU trade data include dedicated surveys of exporters and other operators.
The full picture of all import/export into one country can only be obtained if all three types of trade (with countries on the compliance list, with countries that are not on the compliance list and intra EU trade) are considered. Some work carried out as part of the case studies suggests that the best and easiest way to collect organic international trade data would be differentiating between organic and conventional products in national trade statistics as is done in Denmark. General conclusions across all data categories
Data are often collected by many different organisations, including commercial bodies, governments and researchers, but organic data collection is not necessarily an explicit task for all of them.
Close collaboration with specific government departments that are not directly involved with organic farming (e.g. customs authorities, national statistics authorities) has improved the availability of data in several cases. Taking part in the case studies has also raised awareness of the need to identify and address problems and the need to increase efforts in organic market data collection.
Sharing of the organic data between organisations can prevent over-sampling of organic producers and operators, but
o there is a tension between market transparency and the need to protect commercially sensitive data;
o sharing data only works if common classification systems are used.
Potential Stakeholder impact(s)
Identifying data collection approaches which may be helpful for improving organic market data and national market reports; and forming an international network of data collectors as a platform for knowledge and experience exchange.
Interactions with other WPs Deliverables / joint outputs
WP no. Relevant tasks Partner(s) involved Context of interaction WP3 and
WP2
Survey and analysis of survey data
P3 (ORC) and P4 (University of Kassel)
Building on the information obtained from the survey and its analysis.
WP4 Collection of data from case study countries
P2 (FiBL) Building on the data collection.
WP5 Models for
consistency checks and methods of data improvement
P4 (University of Kassel) Testing of methods for quality checks and data improvement.
WP6 Publication of improved market reports
P1 (UPM), P2 (FIBL), P3 (ORC),P4 (UKS) ,P5 (CUKS), P6 (IAMB), P7 (ABIO), P8 (AMI), P14 (IMO TR) ,P15 (SA)
This report collates the experiences of those producing the reports which form deliverables 6.1-6.6 of the project.
WP7 Code of practice and Manual
Data network for better European organic market information
Collaborative Project
Collaborative Project targeted to a special group (such as SMEs)
SEVENTH FRAMEWORK PROGRAMME FP7-KBBE.2011.1.4-05
Data network for better European organic market information
D6.7 Report on the experience of conducting the case studies
Gerrard, C.L., Vieweger, A., Alisir, L., Bteich, M.-R., Cottingham, M., Feldman, C., Flechet, D., Husak, J., Losták, M., Moreau, C., Pugliese, P.,Rison, N., Schaack, D., Solfanelli, F., Willer, H., Padel, S.
Due date of delivery: 31.08.2014 (Month 32) Actual submission date: 30.09.2014
Start date of project: 1st January 2012 Duration: 36 months Work package: 6
Work package Leader: Susanne Padel Version: Final
Contents
Contents ... vii
Tables and Figures ...ix
Content of Appendices (see separate document) ...ix
Table of Acronyms ... x
1 Introduction ... 1
2 Case study approach ... 3
3 Experiences with initiating data collection in countries where none existed previously ... 5
4 Production data ... 7
4.1 Harmonising data with Eurostat classifications ... 7
4.2 Using FADN data as a cross-check for production data ... 8
4.3 Using producer surveys ... 9
4.4 Improving estimates of production volumes and values ... 11
4.5 Lessons learned ... 12
5 Domestic trade/retail data... 13
5.1 Using EPOS data and household panel data ... 13
5.2 Using surveys to collect retail data ... 15
5.3 Collecting data on independent retailers, farm shops, farmers’ markets, and direct sales ... 16
5.4 Improving the annual total retail market estimate ... 17
5.4.1 Annual market estimate in the UK ... 18
5.4.2 Annual market estimate in Germany ... 18
5.4.3 Annual market estimate in Italy ... 19
5.4.4 Annual market estimate in France ... 20
5.4.5 Annual market estimate in the Czech Republic ... 21
5.5 Lessons learned ... 21
6 Farm-level prices ... 23
6.1 Data collection approach ... 23
6.2 Lessons learned ... 24
7 Retail prices ... 25
7.1 Data collection approaches... 25
7.2 Lessons learned ... 26
8 Import/export data ... 27
8.1 Using import authorisations and customs data for trade outside the EU ... 28
Tables and Figures
Table 1 - Problems with organic market data ... 1
Table 2 - Overview of the topics covered in each case study ... 4
Table 3 - Advantages and disadvantages of using FADN to provide (additional) production data ... 9
Table 4 – Advantages and disadvantages of a dedicated producer survey ... 10
Table 5 - Overview of producer price data collections ... 24
Table 6 - Import data collection methods... 28
Figure 1 - Illustration of the data collection concept for imports from outside the EU in the Italian case study ... 29
Content of Appendices (see separate document)
Appendix A: Background data collection methods ... 1Appendix B: Current status of data collection as at 2012/2013 ... 6
Appendix C: Experience of carrying out the case study ... 79
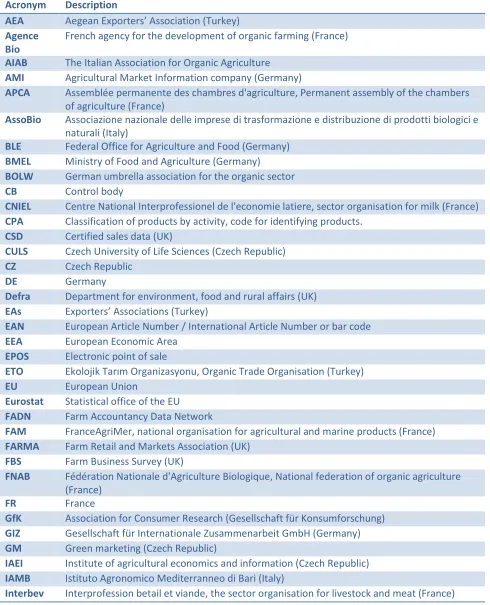
Table of Acronyms
Acronym Description
AEA Aegean Exporters’ Association (Turkey)
Agence Bio
French agency for the development of organic farming (France)
AIAB The Italian Association for Organic Agriculture
AMI Agricultural Market Information company (Germany)
APCA Assemblée permanente des chambres d'agriculture, Permanent assembly of the chambers
of agriculture (France)
AssoBio Associazione nazionale delle imprese di trasformazione e distribuzione di prodotti biologici e naturali (Italy)
BLE Federal Office for Agriculture and Food (Germany)
BMEL Ministry of Food and Agriculture (Germany)
BOLW German umbrella association for the organic sector
CB Control body
CNIEL Centre National Interprofessionel de l'economie latiere, sector organisation for milk (France)
CPA Classification of products by activity, code for identifying products.
CSD Certified sales data (UK)
CULS Czech University of Life Sciences (Czech Republic)
CZ Czech Republic
DE Germany
Defra Department for environment, food and rural affairs (UK)
EAs Exporters’ Associations (Turkey)
EAN European Article Number / International Article Number or bar code
EEA European Economic Area
EPOS Electronic point of sale
ETO Ekolojik Tarım Organizasyonu, Organic Trade Organisation (Turkey)
EU European Union
Eurostat Statistical office of the EU
FADN Farm Accountancy Data Network
FAM FranceAgriMer, national organisation for agricultural and marine products (France)
FARMA Farm Retail and Markets Association (UK)
FBS Farm Business Survey (UK)
FNAB Fédération Nationale d'Agriculture Biologique, National federation of organic agriculture (France)
FR France
GfK Association for Consumer Research (Gesellschaft für Konsumforschung)
GIZ Gesellschaft für Internationale Zusammenarbeit GmbH (Germany)
GM Green marketing (Czech Republic)
IAEI Institute of agricultural economics and information (Czech Republic)
IAMB Istituto Agronomico Mediterranneo di Bari (Italy)
Interfel Interprofession des fruits et légumes frais, Sector association for the fresh fruit and vegetable industry (France)
ISMEA Istituto di servizi per il mercato agricolo alimentare, the institute for study, research and information on agricultural and agri-food market (Italy)
ISTAT The Italian National Institute of Statistics (Italy)
IT Italy
MA Ministry of Agriculture (Czech Republic)
MAEP Ministry of Agriculture and Environmental Protection (Serbia)
ME Maximum entropy
Med Mediterranean
MEG Market information for Eggs and Poultry (Germany)
MFAL Ministry of Food, Agriculture and Livestock (Turkey)
MIPAAF Ministero per le Politiche Agricole, Alimentari e Forestali, Ministry of Agriculture, Food and Forestry (Italy)
MOA Ministry of Agriculture
MOAN Mediterranean Organic Agriculture Network
N/A Not applicable
NACE Is the “statistical classification of economic activities in the European Community” which imposes the use of the classification uniformly within all the Member States.
NUTS Nomenclature of territorial units for statistics
OF&G Organic Farmers and Growers (UK)
OFIS Organic Farming Information System (Turkey)
OMSCo The Organic Milk Suppliers Co-operative (UK)
ORC The Organic Research Centre Elm Farm(UK)
ORSA Organic crop statistics Sampling survey (Italy)
PRODCOM PRODuction COMmunautaire. Prodcom uses the product codes specified on the Prodcom List, which contains about 3900 different types of manufactured products.
RICA Farm Accountancy Data Network (Italy)
RNM Réseau des nouvelles des marchés, Network market news (France)
RPA Rural Payments Agency (UK)
SACL Soil Association Certification Ltd (UK)
SAD Single administrative document
SINAB Sistema d'informazione Nazionale sull'Agricoltura Biologica, national information system on organic farming (Italy)
SPS Supply balance sheets
SRUC Scotland's Rural College (UK), previously known as SAC
Synabio Le syndicat national des enterprises bio, the national organisation for organic businesses
Synalaf Syndicat national des labels avicoles de France, the national organisation for aviculture (France)
TARIC Customs data classification system
1
Introduction
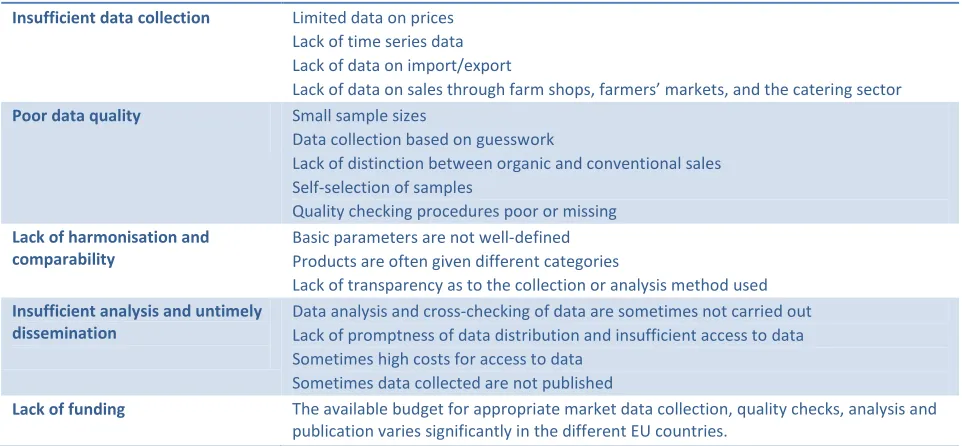
[image:12.612.66.547.305.528.2]Procedures and methods for the collection and publication of organic market data across Europe vary widely as previous studies have found (Hamm and Gronefeld, 2004; Rippin et al., 2006), and the earlier stages of the OrganicDataNetwork project have confirmed (Gerrard et al., 2012; Feldmann and Hamm, 2013). A number of countries publish national market estimates or reports, but the coverage in terms of what data are collected and/or published differs from country to country. In general, available data regarding the organic market are not nearly as detailed and reliable as conventional (non-organic) agricultural and food industry statistics, hence leading to a lack of transparency in the organic market. A number of specific problems with organic market data have been reported for a variety of countries through stakeholder consultation (via online surveys and in a workshop) and other tasks within the project (Home et al., 2013a; Home et al., 2013b; Willer and Schaack, 2013; Gerrard et al., 2012). These are summarised in Table 1.
Table 1 - Problems with organic market data
Insufficient data collection Limited data on prices Lack of time series data Lack of data on import/export
Lack of data on sales through farm shops, farmers’ markets, and the catering sector Poor data quality Small sample sizes
Data collection based on guesswork
Lack of distinction between organic and conventional sales Self-selection of samples
Quality checking procedures poor or missing Lack of harmonisation and
comparability
Basic parameters are not well-defined Products are often given different categories
Lack of transparency as to the collection or analysis method used Insufficient analysis and untimely
dissemination
Data analysis and cross-checking of data are sometimes not carried out Lack of promptness of data distribution and insufficient access to data Sometimes high costs for access to data
Sometimes data collected are not published
Lack of funding The available budget for appropriate market data collection, quality checks, analysis and publication varies significantly in the different EU countries.
Source: Home et al., (2013a, b, c); Willer and Schaack (2013); Gerrard et al., (2012)
The specific aims and work plan for the improvement of organic data collection in each case study were based on an analysis of existing data collection in 2011/12 (see Appendix B).
The case studies included:
production data (all data related to agricultural production, e.g. crop areas, livestock numbers, yields and production values and volumes),
domestic trade/retail data,
price data (farm level and retails), and
international trade data (see also Table 2-1 below).
Data collected in the individual case studies are published in a first market report (MOAN) or improved market report (in the other five cases) (Organic Data Network Deliverable 6.1 to 6.6) and in some cases also in additional national publications. Further, the teams were asked to report on the experience gained in carrying out the additionally identified tasks for the case study. This report collates and compares the experiences from all countries in terms of what improvements in organic data collection were attempted and achieved, how data has been collected and at what costs.
Chapter 2 of the main report introduces the case study approach and the work plan for each case. The following Chapters (3 to 9) describe the experiences in carrying out case studies: a) regarding initiating data collection where none existed before, b) in relation to different data categories, c) regarding the use of data consistency checking, and d) where possible, estimating the costs incurred for additional data collection (time and direct costs). Each chapter concludes with a short summary of lessons learned; the general conclusions are presented in Chapter 10.
2
Case study approach
The procedures for organic market data collection vary widely across Europe, depending on size of the market, types of organisations involved and available funds for data collection, collation and publication. They are more advanced in countries with well-developed organic markets, where national market estimates or reports are regularly published, and less organised in countries with smaller domestic organic markets, frequently without any published reports on market development.
In order to improve the availability and quality of published market reports, case studies have been shown to be a useful approach in various previous research projects which have examined organic market data. Specifically, the EISfOM project conducted pilot studies in eight European countries (Austria, Switzerland, Germany, Denmark, Italy, Netherlands, Poland and UK) and at the international level (Eurostat). In that project, pilot studies were used for testing new and/or improved data collection and processing systems (DCPS) for organic markets on various levels as reported by Gleirscher et al. (2005). Generally, conducting case studies is a well-established method for carrying out this type of research with comparison across countries or regions adding an extra level of insight but also complexity (Midmore et al. 2004; Gleirscher 2005; Michelsen et al. 2001; Midmore et al. 2006). Yin (1994) suggests that, although case studies do not attempt statistical generalisation, the resulting analytic generalisation can illustrate, represent, or generalise a theory. Stake (1995) describes the generalisability of case studies as ‘naturalistic’, resonating with the experience of actors themselves. Case study findings can thus place stakeholders at the centre of developing action-oriented insights for analysis and use.
In this project, the six case studies aimed at improving market data collection and reporting. First, a common case study protocol was developed to facilitate the exchange across the countries and the current status quo of data collection in each country/region was established (see Appendix B). In a second step, a country-specific work programme for improving data quality through comprehensive data checking and limited new data collection (within the available budget) was developed (see Appendix C).
The studies took place in the UK, Germany, Italy, France, Czech Republic and in member countries of MOAN (here reported for Turkey, Lebanon and Serbia, Albania and Tunisia1). The chosen countries cover a range of different stages of organic market development, allowing a comparison of different stages of data collection, problems and needs in the various stages. The work within the case study teams involved close collaboration between researchers and public and private organisations involved in publishing the market reports (see Table 2 below). Discussion between all the teams at project meetings allowed for sharing of experiences across countries.
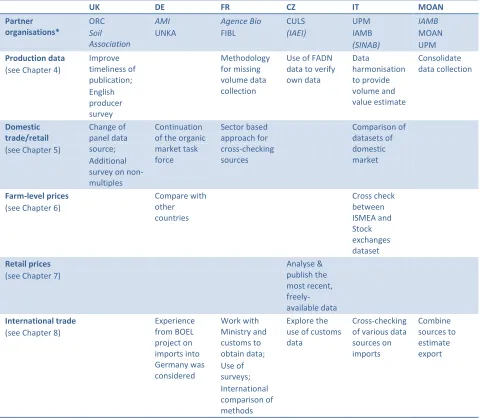
The case study work programmes had the aim of improving specific areas (but not necessarily all areas identified as gaps) for each country. Table 2below summarises the main topics covered by each of the case studies. It should be noted that the table only lists the areas where improvements were planned as part of the case studies. Additional data collection does take place and is published in these countries (see Appendix B and Table B 1) in almost all of the categories. More details of each case study can be found in Appendix C. The following chapters describe the experiences and lessons learned in carrying out the case studies. They are broken down by the different data categories.
Table 2 - Overview of the topics covered in each case study
UK DE FR CZ IT MOAN
Partner organisations* ORC Soil Association AMI UNKA Agence Bio FIBL CULS (IAEI) UPM IAMB (SINAB) IAMB MOAN UPM Production data
(see Chapter 4)
Improve timeliness of publication; English producer survey Methodology for missing volume data collection
Use of FADN data to verify own data Data harmonisation to provide volume and value estimate Consolidate data collection Domestic trade/retail (see Chapter 5)
Change of panel data source; Additional survey on non-multiples
Continuation of the organic market task force Sector based approach for cross-checking sources Comparison of datasets of domestic market Farm-level prices (see Chapter 6)
Compare with other countries Cross check between ISMEA and Stock exchanges dataset Retail prices
(see Chapter 7)
Analyse & publish the most recent, freely-available data International trade
(see Chapter 8)
Experience from BOEL project on imports into Germany was considered Work with Ministry and customs to obtain data; Use of surveys; International comparison of methods Explore the use of customs data
Cross-checking of various data sources on imports Combine sources to estimate export
*Organisations in italic were responsible for the publication of the market report; Organisations in brackets were not full members of the Organic Data Network Project.
3
Experiences with initiating data collection in countries where none
existed previously
Initiating data collection where none existed previously is the important first step in establishing an organic market data reporting system. In the MOAN case study, some work was carried out in countries where a specific type of data collection (for example retail or international trade) was not currently carried out, but where members of MOAN identified a need for such data. In the UK, new data collection was attempted for some non-multiple retail sales outlets.
The experience from these case studies suggests that the first steps towards data collection and possible issues when starting the process are:
1. Identify the key organisations involved in that sector of the organic market that may hold data. 2. Start and maintain a dialogue between the key data holders, data collectors and other
stakeholders who would want to use the data.
3. The collaboration with a trusted third party who will collect and collate data may help in reassuring potential data providers that their data will be kept confidential and will only be used in an amalgamated format.
4. Continued dialogue and discussion should help to grow response rates and to encourage others to participate.
5. Where data are provided:
a. Have a clear and detailed description of the data collection methods and analysis at the source and be clear about the subsequent collection and analysis for publication.
b. Assess coverage and representativeness of the sample obtained. c. Carry out cross-checks.
6. Continue dialogue at national and international level.
4
Production data
Data on organic production are more commonly collected than data on retail, prices or international trade. Organic land areas and livestock numbers for EU countries are available from Eurostat. However, data on organic production volume (i.e. yields) and value (i.e. farm-level prices) and other aspects going beyond what is currently reported by Eurostat are much less likely to be collected (Gerrard et al., 2012). Improvements to production data were foreseen in five case studies.
In the UK, greater harmonisation of control body (CB) data categories with Eurostat classifications was attempted. In addition, a producer survey was carried out in England, similar to existing surveys in Scotland and Wales, which provided additional data on organic production and producers’ future intentions.
In the MOAN case study, harmonisation of CB data with Eurostat classifications was carried out. In the Czech Republic, the possibility of using FADN data to obtain additional information on
production was investigated.
In France and Italy, methods for estimating yields and so production volume were investigated. The Italian case study also investigated methods of estimating crop production value.
4.1
Harmonising data with Eurostat classifications
Plums at the National Fruit Tree variety collection at Brogdale, UK and organic cattle visited in Estonia during the 5th project meeting in Tallinn, May 2014.
4.2
Using FADN data as a cross-check for production data
All EU member states collect farm income data as part of the FADN (Farm Accountancy Data Network). FADN surveys are carried out annually, on a sample of farms (European Commission, 2014), collecting information on:
Physical and structural data, such as location, crop areas, livestock numbers, labour force, etc. Economic and financial data, such as the value of production of the different crops, stocks, sales
and purchases, production costs, assets, liabilities, production quotas and subsidies, including those connected with the application of CAP measures.
The survey does not cover all the agricultural holdings in the Union, but only a sample of those which, due to their size, could be considered commercial (European Commission, 2014).
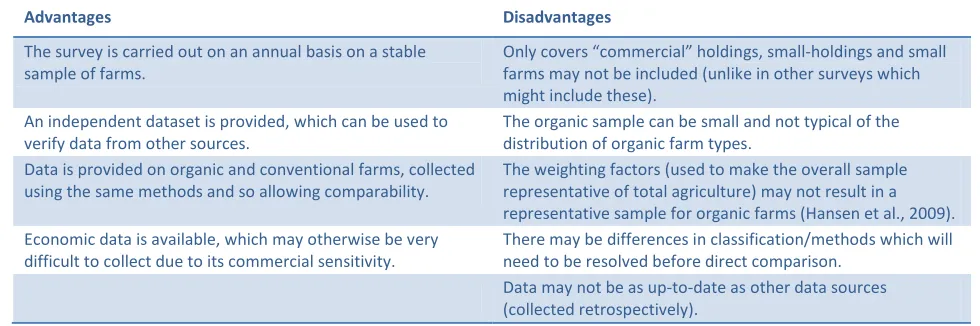
Table 3 - Advantages and disadvantages of using FADN to provide (additional) production data
Advantages Disadvantages
The survey is carried out on an annual basis on a stable sample of farms.
Only covers “commercial” holdings, small-holdings and small farms may not be included (unlike in other surveys which might include these).
An independent dataset is provided, which can be used to verify data from other sources.
The organic sample can be small and not typical of the distribution of organic farm types.
Data is provided on organic and conventional farms, collected using the same methods and so allowing comparability.
The weighting factors (used to make the overall sample representative of total agriculture) may not result in a representative sample for organic farms (Hansen et al., 2009). Economic data is available, which may otherwise be very
difficult to collect due to its commercial sensitivity.
There may be differences in classification/methods which will need to be resolved before direct comparison.
Data may not be as up-to-date as other data sources (collected retrospectively).
Source: Own data based on the Czech Republic case study
In the Czech Republic, the data are originally collected through the general FADN survey. Therefore, it is difficult to separate the costs of the FADN organic sector survey from the whole FADN survey. The total cost of FADN in the Czech Republic in 2012 was 17 368 314 CZK2, or about 630 000 EUR. The cost per farm differs, based on its size and type of farm (production). On average, the cost per farm (conventional or organic) is about 8 000 CZK (EUR 290). For the 258 organic farms the average cost is higher (due to differences in farm size, structure and ownership) at about 460 EUR. In addition to these direct costs for data collection on organic farms, extra time was needed to process and analyse the data.
4.3
Using producer surveys
One way of filling some of the gaps in production data is to carry out an additional, direct survey of organic producers. This was investigated in the UK case study. Carrying out such a survey allows the questions to be tailored to the data gaps of a particular country, e.g. the producers can be asked about their sales volumes and values (and the proportion sold as organic or conventional), their plans for the future, yields generated, or other information which is of use to stakeholders and not collected by other methods.
One major challenge of this approach is to persuade organic producers to take part in a survey. The UK experience suggests that it is necessary to balance a desire to obtain as much data as possible, with an understanding of the needs of the producer; and to moderate the amount of information requested, so that the survey does not take up too much valuable time (Mohamed Shahin, 2013). It may also be necessary to consider the potential sensitivity of the data requested. For example, producers may not wish to give information about the prices they receive in case it affects their relationship with their customers or provides their competitors with a commercial advantage.
2
The exact method of data collection requires further consideration. Surveys can be carried out online, by telephone, by e-mail, by post or even face-to-face. In most countries, face-to-face surveys are likely to be too time-consuming and expensive. The choice between online, e-mail, postal and telephone surveys may depend on whether the majority of farmers in the country have access to/use the internet. Organisations in the UK have found that a mixture of postal questionnaires, followed up by telephone surveys works well. The postal questionnaire is less resource intensive, but the telephone follow-up increases the response rate (in the survey carried out in Scotland, the postal response rate was nearly 50% and the final response rate after the telephone survey was just over 80%) (Mohamed Shahin, 2013). The advantages and disadvantages of producer surveys, based on the UK experience, are summarised in Table 4.
Table 4 - Advantages and disadvantages of a dedicated producer survey
Advantages Disadvantages
Data collection can be tailored to stakeholder needs and changed/adapted easily.
It is time-consuming and costly to carry out such surveys, especially on an annual basis.
Qualitative data on producer perceptions can be collected. This type of data is not so likely to be picked up by other methods.
Organic producers may feel over surveyed
While producers may find it difficult to participate, they may also feel that their opinions and data are valued and feel more engaged in the organic market.
Potentially low response rates mean that the data may not be statistically reliable
Source: Own data based on the UK case study
4.4
Improving estimates of production volumes and values
Crop production volumes can be estimated by taking production areas (which are recorded for Eurostat) and multiplying them by standard yields. This approach was investigated in detail in France and Italy.
Also national yield estimates were estimated in some of the MOAN countries and multiplied by crop areas. The results were then compared with production volumes reported by CBs as a cross-check of those data.
Some crop yield data can be collected by carrying out annual surveys. However, to carry out yearly surveys for all products would be costly and time consuming, so that expert estimates may be required. Also carrying out a literature review to identify appropriate recent scientific publications and studies (where available) can be used to supplement surveys. The French and Italian case study teams both used a combination of these approaches, including the use of expert panels.
Estimating yields on a national basis can be very difficult, as yields can vary considerably depending on variety, farm, region, weather conditions, and disease prevalence so a regional approach is often required.
There are also specific products for which estimating production volumes is particularly difficult. The French case study highlighted the difficulties in estimating production volumes for vegetables and fruits. In the Eurostat return on production areas, many types of vegetables (and similarly for fruits and berries) may be classified together as “field-scale vegetables”, “greenhouse vegetables” or “other vegetables”. This means that it is not straightforward even to obtain the production area. For fruit, the tree density and characterisation of the orchards are not always recorded. Also orchard yields can vary depending on the management of the orchards (which can be very extensive or very intensive), the varieties of the fruit and from year to year (depending on weather conditions, pests and diseases) and the segment of the market intended to supply (fresh fruit, juice etc.).
To verify organic yield estimates, they can be compared with conventional yields, as it is unlikely that the organic yield will exceed this number. In the French and Italian case studies it was verified that none of the organic crop yields exceeded the mean conventional crop yield.
Production values can be estimated by multiplying the production volume (possibly estimated as discussed above) by the relative producer price of the crop or product. It may be possible to obtain data on prices from agricultural stock exchanges, as was investigated in the Italian case study. Otherwise some price data may be collected by producer surveys (as in the UK case study where milk and egg prices were collected) or using expert panels (see Chapter 6).
In Italy, approximately 40 person-days (about 20 per team) were required to set up the data collection and analysis methodology. Since this was the first attempt to carry out volume and value estimates for Italian organic crop production, a lot of time was spent collecting information regarding crop yield estimates from experts. A statistical analysis was carried out to check for potential inconsistencies and to control the coverage of the survey. In France, 10 person-days (2 per product) were needed to set up the methodology, identify the potential sources of data, collect, analyse, and validate these additional data.
4.5
Lessons learned
Some private bodies (such as organic control bodies) may have developed their own data categories adapted for their specific needs and may have low awareness of Eurostat categories; dialogue might be required to achieve harmonisation with Eurostat categories.
FADN data can be used to give information about production (e.g. yield, farm-level prices), especially if sample sizes are sufficiently large to give good coverage of organic farms.
Producer surveys can be useful to supplement production data, targeting specific data gaps and providing more up-to-date insights, but survey fatigue of organic producers may occur. Telephoning producers may help to increase response rates for emailed or posted surveys. Estimating yields should make use of a combination of different approaches, such as results
from scientific studies and previous projects, (regional) experts, expert panels as well as specific studies/surveys which can give detailed data but are time consuming and costly.
The following sector specific observations were recorded:
o Grain traders can be important data providers for arable crop production volumes.
o Slaughterhouses may be able to provide data on production volumes for livestock, but conversion from carcase weight to weight of meat for market might be required. Also, in countries where a large proportion of organically produced livestock is slaughtered as conventional (e.g. Czech Republic, UK for some products) a data gap may occur due to the animals that have left the organic chain.
o Milk volumes are often collected by authorities directly from the dairies – and if not, can be collected there by any data collector.
5
Domestic trade/retail data
At present, there is no harmonized collection system for organic retail sales data, and only very few countries publish official statistics. Most countries use a mixture of different sources to estimate the total value of the domestic market, including household panels, retail panels, specific surveys and expert estimates (see Appendix B and Gerrard et al., 2012). Difficulty exists in covering the less traditional sales channels that are important for organic food, such as specialist and artisan shops (e.g. butchers and bakers), market stalls and various forms of direct sales. In some countries (e.g. Germany and France which both have well-developed organic markets) additional panels exist that specialise in organic sales channels (see Biovista panel below).
Improvements to estimating domestic retail sales through different sales channels were foreseen in four of the six case studies.
In the UK, a change from using household panel data to using retail panel data based on EPOS (electronic point of sale) was aimed at improving accuracy and disaggregation by product groups. Furthermore, the coverage of non-multiple outlets was improved through the use of additional surveys.
In the Italian case study, a comparison between the two main datasets (household panel data and EPOS data) on domestic market data was performed.
In France, the total estimate of the market value used a sector based approach, relying on various surveys and data provided by sector bodies (e.g. for milk, meat etc.).
In Germany, the main aim in relation to this data category was to explore the continuation of using the organic market task force (Arbeitskreis Biomarkt), consisting of several different market data collectors, to arrive at a shared estimate of the total market value.
All other countries were also asked to comment on their experience of estimating the total national market value combining the different retails sales outlets (see Section 5.4).
5.1
Using EPOS data and household panel data
The Italian and UK case studies investigated two different approaches to retail sales data collection: electronic point of sale data compared with household panel data.
Source: Nielsen Household Panel Scanner
Italy, retail sales data for multiples are either estimated by ISMEA using GFK-Eurisko household panel data or by AssoBio, based on supermarket scanner data (EPOS). Due to a substantial difference between the two data collectors describing the same sales channel for domestic organic sales for 2012, the Italian case study cross-checked the different sources of organic retail data at supermarket level to identify potential sources of the inconsistency.
With the use of EPOS data in place of household panel data in the UK, it is hoped that accuracy will be improved, as there will no longer be a reliance on panel members remembering to scan all purchases when they get home. This should ensure a more accurate picture where purchases of goods such as snacks and lunches are concerned. There is, however, a risk that if a product is not correctly recorded as organic by the retailer, this could lead to some errors and missed, or wrongly labelled sales. The disadvantage of trade panel data such as EPOS is that they do not track individual households thus allowing for consumer analysis. Household panel institutions regularly collect data from their panel members on e.g. educational level, household size or their opinion on organic food. EPOS data also do not differentiate between household purchases and large-scale consumers such as takeaways and restaurants.
In the UK, the Nielsen data for 2012 was cross-checked with Soil Association and OMSCo (the Organic Milk Suppliers Co-operative) data before moving to the new data source. The Nielsen EPOS estimate of £1.1bn for sales value through multiples and tracked outlets was in good agreement with the Soil Association’s own estimate of £1.161bn, published in the previous years’ report. Similarly for organic milk, OMSCo estimated annual milk sales to be £150m, Kantar (household panel) data gave an estimate of £113m and Nielsen a calculation of £140m. This suggests that the Nielsen data are improving the accuracy of the estimate. In addition, the Soil Association carries out its own additional surveys and will continue to do so in the future and the retail sale estimate in the annual market report is usually based on data from 5 different sources (see Section 5.4.1 and UK Case study in Appendix B) which are cross-checked against each other. Survey findings and purchased market data are used for sense checking against each other.
Box 1: The German Biovista panel for specialist organic shops
BioVista was founded in 2003 as a retail panel specialising in organic shops. The aim was to offer a scanner-data based panel for the natural food sector in Germany as this sales channel was not covered by other retail panels such as Nielsen scan track. The approach used is similar to that used by other retail panels, except that organic outlets are targeted. BioVista obtains its data from about 400 organic shops using check-out scanners out of a total of approximately 2 500 organic shops in Germany. Shops taking part in the panel are not paid, but receive a monthly report on their sales by product and a comparison with other shops. Because of the requirement for scanner check-outs the sample represents the better developed, modern, and engaged shops. Like for other panels, processors can purchase the data and use the panel results for comparing their products with those of competitors, including reports on product ranking, product range, sales management, single items or other specific topics. BioVista is a commercial organisation but at the same time provides a degree of market transparency (at least to those who can afford to purchase the reports). BioVista is part of the “Arbeitskreis Bio-Markt” task force and together with Klaus Braun delivers data on sales through natural food stores and thus helps to estimate the value of the natural food market in Germany (see Section 5.4.1).
In terms of costs, the Soil Association in the UK has set up an annual contract with Nielsen in order to receive a monthly data check on the value of the organic market and its categories, comparing the 52 week, 12 week and the 4 week position to the previous year. In preparation for the 2014 report, the data had to be sense-checked, cross-checked and combined with the separate information coming from the independent sector of the market, in order to get overall market totals. This amounted to approximately 3 days’ work. In Italy, no direct costs were involved. About 15 person-days were required to set up the data collection and analysis methodology.
5.2
Using surveys to collect retail data
In the absence of the specific identification of organic sales in the official consumption data in France, since 2005 a national survey of the organic market has been carried out annually by Agence Bio and the expert consulting company ‘AND International’. As part of the case study, the 2013 survey was reviewed with the aim of obtaining more detailed data in as many fields as possible.
Agence Bio has conducted sample surveys and produced five questionnaires:
1. One directed at farmers, aimed at obtaining data on direct sales (7 539 farmers with a valid mail address out of 9 342 farmers notified for more than 2 years - to exclude the conversion period – practicing direct sales and excluding wine which is covered by a specific survey);
2. One dealing with retail sales by the 10 specialised organic store chains; 3. One sent to the 10 main supermarket chains;
4. One directed to the main processing operators (1 500 out of 9 350 notified processors) and separated by product categories;
General response rates varied from 13% (direct sales), 28% (processors), to 90% (supermarket chains). It is very difficult to obtain information from operators in small or competitive sectors as they are reluctant to give them. Volume data remains much more difficult to obtain than value data.
The main data checks included comparison with prior year data, investigation of unusual year-on-year movements, and comparison with the overall food retail market movements within the country.
Regarding costs for the French case study, three person days were needed to compare the classifications, to find a more compatible reference system, and add more detail to the questionnaires when possible/relevant. No other costs resulted from this special study, and the rest was part of Agence Bio’s usual annual survey budget (about 100 days in total).
5.3
Collecting data on independent retailers, farm shops, farmers’ markets,
and direct sales
One part of the UK case study investigated getting better data on sales through non multiple sales channels. The Soil Association carries out a survey of independent retailers in which it asks whether they make sales through farmers’ markets, box schemes, farm shops, high street shops and catering. The coverage of box scheme sales and high-street shops has been consistently good in the past. For farmers’ markets, farm shops and catering, however, responses have been few and collected data have been quite minimal. It was therefore decided that:
1. Two other main surveys would be distributed at an earlier date, and those targeted were more vigorously pursued for timely completion.
2. More detail would be requested in the top 100 survey (top 100 licensees by turnover) to help identify which respondents were supplying the catering sector.
3. FARMA (Farm Retail and Markets Association), the representative umbrella body for farmers’ markets and farm shops, would be approached to work with the Soil Association on a joint survey targeting FARMA members, in order to secure much more data related to these outlets. 4. An additional survey of independent retailers would be carried out in partnership with Natural
and Organic Products magazine.
market traders. Lloyds Europa estimates that there are 750 farmers’ markets in the UK, and 200 of these are FARMA members. The estimate for numbers of farm shops is 4 000, around 400 of which are FARMA members. Unfortunately it was not possible to develop the survey in time to use its results in the Organic Market Report 2014. It is now aimed for completion later in the year and an additional publication will result from it. When distributed, the survey will provide useful insights into a range of areas in addition to the organic turnover of farmers’ markets and farm shops:
Regional distribution
Market stalls and shops per individual business enterprise
Turnover split between product categories – fruit and vegetables, dairy, meat, non-food etc. Percentage of turnover from organic products
Sales performance 2013 – rate of growth or decline
Some insight into the impact of the horsemeat controversy in the UK4 on sales
Relative importance of various product differentiators to farm shop and farmers’ market customers: fresh, locally sourced, free range, organic, Fair-trade.
An additional survey was carried out by the main UK organic magazine, Natural & Organic Products and sent directly to a selection of 3 000 of its readers. The objective of this survey was to supplement the information which the Soil Association gathered in its own independent retailer survey and to capture data from businesses whose focus was ‘health foods’ alongside organic foods.
The experience shows that all four new elements of the approach detailed above offered the opportunity to improve the accuracy of market valuation through a richer set of data. This has been delivered most meaningfully and usefully in the case of catering sales, with the expectation that the most useful data of all for improving the accuracy of market data will emerge from the surveys of farmers’ markets and farm shops when these are completed.
In terms of costs, the two surveys aimed at improving data on farm shops and farmers’ markets have used 20 person hours so far. Including telemarketing, data collation, data analysis and publication online, the total estimated cost is 150 person hours. The primary author of the Organic Market Report (an external consultant) spent 15 hours collating and analysing the data from the survey of independent retailers to identify overall figures and trends.
5.4
Improving the annual total retail market estimate
As organic products are sold through different outlets, there is no one source estimating the whole national organic market value. This was the focus of the German case study, but all countries were asked to contribute their experience. Each country approaches coming to an
4
overall estimate of the retail market value differently, depending on the data that are available and affordable. All the approaches have in common that they combine a number of data sources in a piecemeal or “jigsaw puzzle” approach to provide the best estimate of the overall market (e.g. combining data on sales through multiples with data on sales through independents).
Where more than one possible source of data is available, cross checking is often used to improve data accuracy.
5.4.1 Annual market estimate in the UK
The Soil Association uses its own surveys to calculate market figures alongside the data that it purchases from market research companies. The market report 2014 is based on five main data sources:
1. In-house surveys by the Soil Association of a. All licensed independents (32 responses)
b. Their top 100 licensees by turnover (30% response rate)
2. Survey of 3 000 independent retailers carried out by Natural & Organic Products magazine in conjunction with the Soil Association, with a response of 40 retailers
3. Survey of the multiples by an independent consultant (good participation, only one major multiple failed to submit a response in 2014)
4. Data from Nielsen (previously from Kantar)
5. CSD (certified sales data) returns from SA certification (e.g. used to get numbers for the health and beauty and textiles data categories and for cross-checking).
Survey findings and purchased market data are used for sense checking against each other to ensure that the impact of limitations in any single source of data is minimised, and that market trends are appraised in a balanced way.
5.4.2 Annual market estimate in Germany
2. Communication between the involved organisations, who are also competitors, was not always easy.It was decided at the start of the collaboration to keep results confidential until they were published at the annual BioFach. However, in 2011 and in 2013 major data leaked out too early. 3. Different panels have different coverage rates, and except for trade panel data such as Nielsen scan track, Klaus Braun or BioVista data, they do not cover 100% of the respective organic market segment. Additionally, household panel data does not show catering and restaurant sales. For butchers, bakeries, farmer´s markets, farm shops and box schemes the data from the GfK household panel show too much variation and it is not clear how much of the market is covered.
As part of on-going contract and collaboration, AMI regularly buys and analyses GfK household panel data for fresh products through the year and cross-checks with other sources according to promotions in the multiple chains and also with the development on the product markets. Monthly GfK raw data are bought for the following organic and conventional products: meat, meat products, poultry, eggs, cheese, fruit, vegetables, potatoes, bread, vegetable oils, milk and dairy products.
5.4.3 Annual market estimate in Italy
At present in Italy there is no market data source that reflects the whole organic market. The value of the large retail market for organic products (supermarkets, hypermarkets, drugstores) is estimated by ISMEA, using ISMEA/GFK-Eurisko panel data. These data are not published in the form of absolute values, but only as trends compared with previous years. AssoBio also provides an estimate of the large retail market, based on supermarket scanner data. There are very limited data on the specialised organic market: some information is available from AssoBio, which provides estimates based on both expert opinion and data from a number of the largest distribution companies in Italy. Bio Bank also provides data on the number of outlets involved in direct sales, public canteens and restaurants, but does not provide information on retail volumes and values. The estimate of the total organic retail market in Italy is therefore very difficult at present.
During the Italian case study, some issues were identified that should be taken into account when planning to estimate the total organic retail market in Italy.
The two estimates of the large retail market value for organic products (ISMEA and AssoBio data) give substantially different results. In the next few years, the institution involved in collecting and publishing organic retail data in Italy should start a consistency check of the GfK household panel data, at least for some products.
ISMEA and AssoBio monitor data on domestic consumption only in the non-specialised market. There are no official statistics available on sales through the specialised channels: AssoBio
numbers of outlets. An annual survey of both specialised shops and other sales channels (farmers’ markets, catering/restaurants, etc.) should be developed to estimate the size of the market and to cross check with the data from AssoBio. It appears necessary to finance the estimate of the value of organic retail sales through specialised outlets and sales channels by public institutions in order to arrive at a reliable estimate of the total value of organic sales in Italy.
5.4.4 Annual market estimate in France
With the help of a consulting firm (AND international), Agence Bio carries out an annual estimate of the total market value at the retail level around May of the following year. Internet and/or postal and/or telephone surveys carried out by Agence Bio and AND are combined with other sources, e.g. Symphony IRI panel data for general supermarket retail.
For the general supermarkets, the IRI panel data represents roughly 70% of the total sales of the sector. Products with variable weights are not included. Wines are also not included in the IRI data, but data are acquired separately. Sales values in the discount sector are estimated by AND international, based on interviews and price/reference censuses in shops. The specialized network retailers’ detailed sales are estimated based on a survey carried out by Agence Bio and AND.
Direct sales and artisans sales (e.g. butchers and bakers) are also estimated using data collected within a survey. Because they concern many different small entities, extrapolation rules can be hard to define, some sectors being over represented because of their willingness to answer the survey (wine sector for example). Where necessary, calibrating surveys focusing on a certain population are carried out to improve the accuracy of the estimates.
Estimates for sales in specific sectors provided by sector organisations are used for overall estimates. The CNIEL (Centre National Interprofessionnel de l'Economie Laitière) works on volumes and values for milk and dairy products based on the IRI Symphony data. The products monitored monthly are: liquid milk, butter, yogurts, fresh dairy, fresh cheese, cheese, and milky desserts. The data collected concerns only general supermarket (multiple) retail, but in France, many other sales routes exist for dairy products. Agence Bio estimates that the data on dairy products (excluding liquid milk) represent roughly 60% of the retail sales in France.
5.4.5 Annual market estimate in the Czech Republic
So far, no comprehensive statistical survey of the organic market covering producers, processors, the retail sector and households has been carried out in the Czech Republic. Therefore, as part of the case study, the Institute of Agricultural Economics and Information (IAEI) sent a survey to all producers and distributors from the register of the actors in the organic sector in order to identify the volume of the organic food they offer.
The following two crosschecks were carried out:
1) IAEI has sent out questionnaires to 320 actors, from which about 50 organisations (usually small) did not respond. The questionnaire consisted of very few questions, on total turnover of organic products, breakdown by type of organic products (36 subcategories), percentage of direct imports and distribution channels. The size of the organic retail market was defined as the sum of turnovers of registered processors and distributors for the sale of organic products to final consumers in retail shops or through direct marketing. To estimate the retail sales value from this, the sum of turnovers is increased by 30% to represent the retail mark-up. A further increase is made to account for the sale in the international retail chains (13 major retail chains) of organic food imported into the Czech Republic from abroad (see below).
2) 13 major international retail chains (these are Ahold, Billa, Coop, dm drogerie, Globus, Kaufland, Makro, Marks and Spencer, Penny Market, Rossman, SPAR, Tesco and Lidl) were also surveyed about total turnover of organic products, breakdown according to the type of organic products (only 8 subcategories) and percentage of direct imports. The results were mainly used for cross checking with the above survey because of concerns about data accuracy. The main problems identified were that these retail chains usually do not monitor organic products separately from conventional ones, and different classifications system for particular types of organic products compared with international and Czech standards are used.
The common problem of both approaches of estimating of total organic retail market is that the questionnaires (both) are voluntary and not compulsory (they were distributed by IAEI not by Czech Statistical Office or Ministry of Agriculture) and response rates can be low.
5.5
Lessons learned
Product classification systems vary considerably between different data providers, with market research companies and retailers using their own in-house systems adapted to their needs. This makes data cross checking and comparisons between different data sources over time and between countries difficult. There is a need to use one classification system for retail data against which private systems can be mapped.
Users of panel data (household or retail) should be aware of the methods and approaches used in the data collection and potential limitations of the data (see Box 2 household panel below). Special surveys targeting organic operators or alternative sales channels are needed to collect
Partnership with producer organisations, such as France’s interprofessions, is worthwhile and joint surveys often allow better coverage and information, and should improve response rates\.
Box 2: Relevant issues to consider to reduce the risk of errors when using household panel
data:
- What data collection method was used? (Electronic diaries and scanners, interviews, surveys etc.). The interpretation has to be carried out specifically according to the method of collection. - How are the data transferred to the organisation conducting the analysis? Do the data need to be
entered by hand at any stage; and if so, are they then checked by at least one other person? - Are the data checked for plausibility (for example comparing with regularly updated minimum price
ranges to avoid wrong classification of conventional products as organic)?
- In which retail channels was the data collected? The interpretation and data checks have to be done specifically according to the channels included in the study/collection.
- Is the data interpretation taking into account that often many sales channels are not included (e.g. take-away, restaurants, school canteens, coffee shops etc.)? Does it also take into account that sales in farm shops, farmers’ markets etc. are likely to be under-estimated.
- Is the data interpretation taking into account that many “on the way purchases” such as snacks are not reported and thus a coverage gap arises?
Box 3: Collecting data on sales through independents, farm shops, and farmers’ markets
through additional surveys
- Producer surveys can include questions on direct sales – sales routes, volumes, values, produce sold. - Additional surveys may be possible, perhaps jointly with umbrella organisations for independents
retailers or for farmers’ markets.
- CBs may be able to contact independent retailers registered with them and ask them to fill in questionnaires.
6
Farm-level prices
Organic farm level prices are important for farmer decision-making, but only very few countries regularly publish such data and gaps in availability remain. Farm-level price data were considered mainly in the German case study. For the first time, the well-established approach of AMI for farm-level price data collection was compared with price data collection approaches in other countries. This comparison should be very useful for the stakeholders involved.
6.1
Data collection approach
In Germany, producer prices have been collected since the 1990s, on a weekly or monthly basis, depending on the product. Data collection approaches are more developed than in many other countries. AMI collects farm level price data using a number of approaches: standard Excel questionnaires sent by data providers to AMI, price lists provided by traders and telephone interviews. The prices are all collected in a database and weighted with the size of the enterprise (either by area or by sales volume, or for livestock slaughtered by the number of sold animals). AMI also make use of producer price panels, which provide varying coverage of the market. For example, the surveyed potato packers and producers cover 80% of the market and the milk panel 90% of the market. However, the egg panel does not include the two largest companies that mainly deliver to discounters, and so covers only 10% of the market and suggests higher prices than the two larger companies would pay. This highlights the importance of stakeholder involvement: the producer price data will only show a good level of accuracy if the majority of producers and traders are willing/able to take part.
Other methods to collect farm level price data include producer surveys which can be used to collect data on prices for some key agricultural products at farm-level. However, some farmers may not want to reveal the information if they feel that their customer is giving them a particularly good price and, in some cases, may be contractually bound not to reveal such information (see Section 4.3 for UK experience in carrying out a producer survey). Potentially, FADN data could also be used to obtain some farm-level price data (see Section 4.2 for the experience of using FADN data in the Czech Republic). In the Italian case study, in the context of estimating production volumes and values, data on producer prices collected by ISMEA were cross checked with data coming from agricultural stock exchanges that report organic data separately. However, in the current year only production volumes (rather than values) will be published (see Section 4.4 for further detail).