Multi-channel EEG recordings
during a sustained-attention
driving task
Zehong Cao
1, Chun-Hsiang Chuang
2, Jung-Kai King
3& Chin-teng Lin
4We describe driver behaviour and brain dynamics acquired from a 90-minute sustained-attention task in an immersive driving simulator. The data included 62 sessions of 32-channel electroencephalography (EEG) data for 27 subjects driving on a four-lane highway who were instructed to keep the car cruising in the centre of the lane. Lane-departure events were randomly induced to cause the car to drift from the original cruising lane towards the left or right lane. A complete trial included events with deviation onset, response onset, and response offset. The next trial, in which the subject was instructed to drive back to the original cruising lane, began 5–10 seconds after finishing the previous trial. We believe that this dataset will lead to the development of novel neural processing methodology that can be used to index brain cortical dynamics and detect driving fatigue and drowsiness. This publicly available dataset will be beneficial to the neuroscience and brain-computer interface communities.
Background & Summary
Driving safety has attracted public attention due to the increasing number of road traffic accidents. Risky driving states, such as fatigue and drowsiness, increase drivers’ risk of crashing, as fatigue suppresses driver performance, including awareness, recognition and directional control of the car1. In particular, high levels of fatigue and
drowsiness diminish driver arousal and information processing abilities in unusual and emergency situations2.
During a sustained-attention driving task, fatigue and drowsiness are reflected in driver behaviours and brain dynamics3. Furthermore, electroencephalography (EEG) is the preferred method for human brain
electrophysi-ological monitoring while performing tasks involving natural movements in a real-world environment4. In 2003,
we began conducting laboratory-based experiments collecting EEG data to investigate brain function associ-ated with sustained attention during a safe driving task5,6. Our experiments have two distinct goals: (1)
evaluat-ing neurocognitive performance, i.e., determinevaluat-ing key signatures of how the neurocognitive state of the driver (e.g., physical and physiological) varies when faced with the sensory, perceptual and cognitive demands of a sustained-attention situation7–10; and (2) developing advanced computational approaches, i.e., investigating novel
computational, statistical modelling and data visualisation techniques to extract signatures of neurocognitive per-formance, including novel analytic and algorithmic approaches for individually assessing drivers’ neurocognitive state and performance11–13.
To acquire the experimental dataset, we adopted an event-related lane-departure paradigm in a virtual-reality (VR) dynamic driving simulator to quantitatively measure brain EEG dynamics along with fluctuations in behav-ioural performance. All of the participants were required to have a driver’s licence, and none of them had a history of psychological disorders. The 32-channel EEG signals and vehicle position were recorded simultaneously, and all of the participants were instructed to sustain their attention in this driving experiment.
Several research studies on driving performance, including kinaesthetic effects, mind-wandering trends and the development of drowsiness prediction systems, have been conducted by our team using this EEG dataset. Specifically, to study EEG dynamics in response to kinaesthetic stimuli during driving, we used a VR-based driving simulator with a motion platform to produce a somatic sensation similar to real-world situations14. For
1Discipline of ict, School of technology, environments and Design, college of Sciences and engineering, University of tasmania, Hobart, tAS, Australia. 2Department of computer Science and engineering, national taiwan Ocean University, Keelung, taiwan. 3Brain Research center, national chiao tung University, Hsinchu, taiwan. 4centre for Artificial Intelligence, Faculty of Engineering and IT, University of Technology Sydney, Sydney, NSW, Australia. correspondence and requests for materials should be addressed to Z.c. (email: [email protected]) or C.-T.L. (email: [email protected])
Received: 11 June 2018 Accepted: 26 February 2019 Published: xx xx xxxx
Data DESCriptor
mind-wandering trends, we investigated brain dynamics and behavioural changes in individuals experiencing low perceptual demands during a sustained-attention task15. In terms of the drowsiness prediction system, we
proposed a brain-computer interface-based approach using spectral dynamics to classify driver alertness and predict response times16–20. We determined the amount of cognitive state information that can be extracted from
noninvasively recorded EEG data and the feasibility of online assessment and rectification of brain networks exhibiting characteristic dynamic patterns in response to cognitive challenges.
These data descriptors describe a large EEG dataset in a sustained-attention driving task. We aim to help researchers reuse this dataset to further study the behavioural decision making of drivers under stress and cognitive fatigue in complex operational environments, such as car driving with kinaesthetic stimuli, which requires directly studying the interactions among the brain, behaviour, the sensory system and performance dynamics based on simultaneous measurements and joint analysis. We expect that this dataset could be used to explore principles and methods for the design of individualised real-time neuroergonomic systems to enhance the situational awareness and decision making of drivers under several forms of stress and cognitive fatigue, thereby improving total human-system performance. We believe this research will benefit the neuroscience and brain-computer interface communities.
Methods
Participants.
Twenty-seven voluntary participants (age: 22–28 years) who were students or staff of the National Chiao Tung University were recruited to participate in a 90-minute sustained-attention driving task at multiple times on the same or different days. In total, 62 EEG data sets were collected from these participants. The participants had normal or corrected-to-normal vision. In addition, none of the participants reported sleep dep-rivation in the preceding weeks, and none had a history of drug abuse according to the self-report. Every partici-pant was required to have a normal work and rest cycle, get enough sleep (approximately 8 h of sleep each night) and not stay up late (no later than 11:00 PM) for a week before the experiment. Additionally, the participants did not imbibe alcohol or caffeinated drinks or participate in strenuous exercise a day before the experiments. At the beginning of the experiment, a pre-test session was conducted to ensure the participants understood the instructions and to confirm that none were affected by simulator-induced nausea. This study was performed in strict accordance with the recommendations in the Guide for the Committee of Laboratory Care and Use of the National Chiao Tung University, Taiwan. The Institutional Review Board of the Veterans General Hospital, Taipei, Taiwan, approved the study. All of the participants were asked to read and sign an informed consent form before participating in the EEG experiments. The monetary compensation for one experimental session was approxi-mately USD $20.Virtual-reality driving environment.
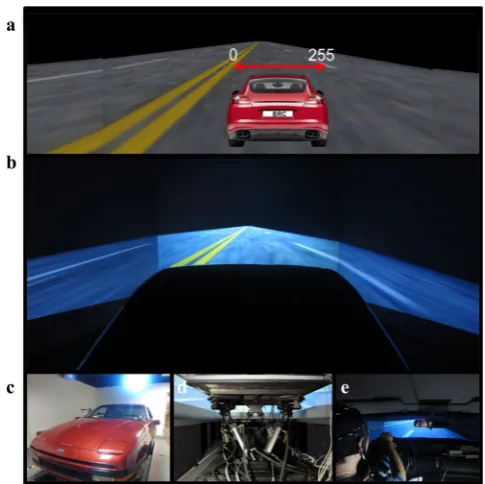
A VR driving environment with a dynamic driving simulator mounted on a six-degree-of-freedom Stewart motion platform was built to mirror reality behind the wheel. Six interactive highway driving scenes synchronised over local area networks were projected onto the screens at viewing angles of 0°, 42°, 84°, 180°, 276° and 318° to provide a nearly complete 360° visual field. The dimensions of the six directional scenes were 300 × 225 (width × height) cm, 290 × 225 cm, 260 × 195 cm, 520 × 195 cm, 260 × 195 cm, and 290 × 225 cm, respectively.As shown in Fig. 1a,b, the experimental scenario involved a visually monotonous and unexciting night-time drive on a straight four-lane divided highway without other traffic. The distance from the left side to the right side
[image:2.595.153.396.44.286.2]of the road and the vehicle trajectory were quantised into values from 0–255, and the width of each lane was 60 units. The refresh rate of the scenario frame was set to emulate cruising at a speed of 100 km/hr. A real vehicle frame (Make: Ford; Model: Probe) (Fig. 1c) that included no unnecessary weight (such as an engine, wheels, and other components) was mounted on a six-degree-of-freedom Stewart motion platform (Fig. 1d). In addition, the driver’s view of the VR driving environment was recorded and is shown in Fig. 1e.
Experimental paradigm.
An event-related lane-departure paradigm3 was implemented in the VR-baseddriving simulator using WorldToolKit (WTK) R9 Direct and Visual C++. The paradigm was designed to quanti-tatively measure the subject’s reaction time to perturbations during a continuous driving task. The experimental paradigm simulated night-time driving on a four-lane highway, and the subject was asked to keep the car cruising in the centre of the lane. The simulation was designed to mimic non-ideal road surface that caused the car to drift with equal probability to the right or left of the third lane. The driving task continued for 90 minutes without breaks. Drivers’ activities were monitored from the scene control room via a surveillance video camera mounted on the dashboard. Lane-departure trials were obtained from experimental data collected from 2005 to 2012 at National Chiao Tung University, Taiwan.
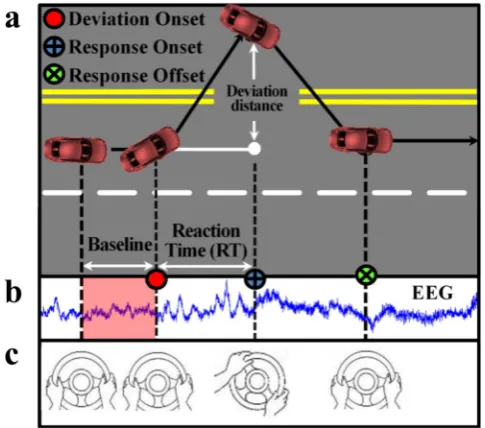
As shown in Fig. 2a, lane-departure events were randomly induced to make the car drift from the original cruising lane towards the left or right sides (deviation onset). Each participant was instructed to quickly com-pensate for this perturbation by steering the wheel (response onset) to cause the car move back to the original cruising lane (response offset). To avoid the impacts of other factors during the task, participants only reacted to the lane-perturbation event by turning the steering wheel and did not have to control the accelerator or brake pedals in this experiment. Each lane-departure event was defined as a “trial,” including a baseline period, devia-tion onset, response onset and response offset. EEG signals were recorded simultaneously (Fig. 2b). Additionally, the corresponding directions of turning the steering wheel are shown in Fig. 2c. Of note, the next trial occurred within a 5–10 second interval after finishing the current trial, during which the subject had to maneuverer the car back to the centre line of the third car lane. If the participant fell asleep during the experiment, no feedback was provided to alert him/her.
Data records
Data recording and storage.
During the experiment, the stimulus computer that generated the VR scene recoded the trajectories of the car and the events with time points in a “log” file. The stimulus computer also sent synchronised triggers (also recorded in the “log” file) to the Neuroscan EEG acquisition system. Concurrently, the Neuroscan system recoded EEG data with the time stamps of triggers in an “ev2” file. Because the number of time points in both recorded files was different, the first step was to integrate the two files into a new file with aligned event timing and behavioural data. The new event file was then imported by EEGLAB in MATLAB.EEG signals were obtained using the Scan SynAmps2 Express system (Compumedics Ltd., VIC, Australia). Recorded EEG signals were collected using a wired EEG cap with 32 Ag/AgCl electrodes, including 30 EEG electrodes and 2 reference electrodes (opposite lateral mastoids). The EEG electrodes were placed according to a modified international 10–20 system. The contact impedance between all electrodes and the skin was kept under 5 kΩ. The EEG recordings were amplified by the Scan SynAmps2 Express system (Compumedics Ltd., VIC, Australia) and digitised at 500 Hz (resolution: 16 bits). Neuroscan’s Scan 4.5 is the ultimate tool for data acquisi-tion. The acquired raw data were saved as .cnt files on the PC and server.
[image:3.595.154.397.46.260.2]EEG signals.
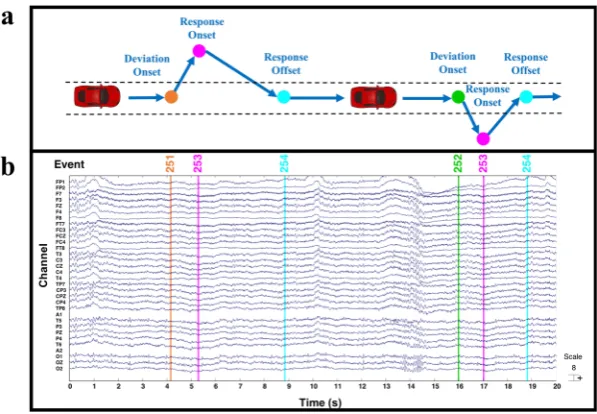
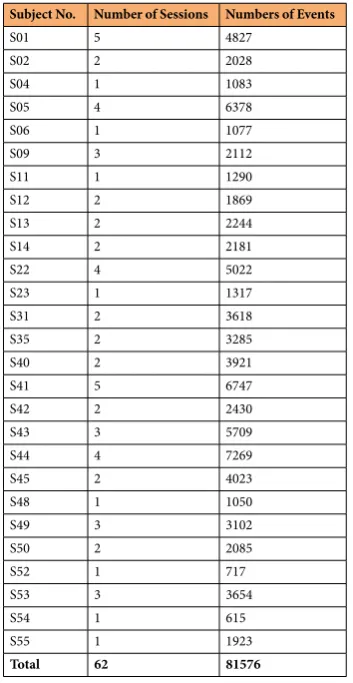
The raw files were read using the EEGLAB toolbox in MATLAB. The uploaded files named with set suffixes contain all of the signals. After loading the files, the “EEG.data” variable included 32 EEG signals and one signal for vehicle position. The first 32 signals were from the Fp1, Fp2, F7, F3, Fz, F4, F8, FT7, FC3, FCZ, FC4, FT8, T3, C3, Cz, C4, T4, TP7, CP3, CPz, CP4, TP8, A1, T5, P3, PZ, P4, T6, A2, O1, Oz and O2 electrodes. Two electrodes (A1 and A2) were references placed on the mastoid bones. The 33rd signal was used to describe the position of the simulated vehicle. Additionally, as shown in Table 1, the types of events (see “EEG.event.type”) in the dataset were classified as deviation onset (mark: 251 or 252), response onset (mark 253) or response offset (mark 254). Of note, the time period between deviation onset and response onset was defined as reaction time (RT). Figure 3 shows an example of behavioural performance (Fig. 3a) and EEG signals (Fig. 3b) with associated events. Additionally, as shown in Table 2, we report the number of sessions per subject and include summary statistics on the number of events (including deviation onset, response onset, and response offset) per subject.Of note, we have uploaded the raw experimental dataset21 [file name: Multi-channel EEG recordings during
a sustained-attention driving task (raw dataset)], and the pre-processed dataset22 [file name: Multi-channel EEG
recordings during a sustained-attention driving task (pre-processed dataset)) to the publicly accessible repository of figshare.
technical Validation
Behavioural validation.
The EEG dataset was collected from 27 subjects with normal or corrected-to-nor-mal vision. No subjects reported a history of psychiatric disorders, neurological disease or drug use disorders. All of the subjects were recruited university students and staff at the National Chiao Tung University, Taiwan. At the beginning of the experiment, each subject wore a suitable cap for recording the electrophysiological data and was given 5 to 10 minutes to read the experimental instructions and complete the participant information sheet (questionnaire).The subjects’ facial videos and responses to the lane departure events were closely monitored. The experiment-ers visually observed the subjects’ facial features, such as eye movements (blink rate, blink duration, long closure rate, etc.), head pose and gaze direction via the surveillance video to determine whether the subject took his/her eyes off the road. Most importantly, the behavioural data (vehicle trajectory) objectively confirmed the estimated RTs during the experiment.
The RTs reflecting the participant’s promptness to respond to regular traffic events are considered an instantaneous measure of the level of fatigue and drowsiness. The RT to each lane-departure event (i.e., the time between the onset of the deviation and the onset of the response) was used as an objective behavioural measurement to characterise all EEG epochs. Three groups of epochs were defined: optimal-performance, suboptimal-performance, and poor-performance groups. Optimal-, suboptimal-, and poor-performance states might indicate that the participant performed the task with a low, intermediate, and high level of fatigue and
EEG.event.type 251 252 253 254
[image:4.595.156.460.47.80.2]Definition Deviation onset (left) Deviation onset (right) Response onset Response offset
Table 1. Types of events in dataset.
[image:4.595.156.455.127.334.2]drowsiness, respectively. For each subject, the RTs collected from the first 10 minutes of the experiment were used to construct a null distribution of optimal RTs.
EEG signals were recorded using Ag/AgCl electrodes attached to a 32-channel Quik-Cap (Compumedical NeuroScan). Thirty electrodes were arranged according to a modified international 10–20 system, and two refer-ence electrodes were placed on both mastoid bones, as shown in Fig. 4a. The skin under the reference electrodes was abraded using Nuprep (Weaver and Co., USA) and disinfected with a 70% isopropyl alcohol swab before calibration. Notably, as shown in Fig. 4b, the impedance of the electrodes was calibrated to be under 5 kΩ using NaCl-based conductive gel (Quik-Gel, Neuromedical Supplies
®
). EEG signals from the electro-cap were ampli-fied using the Scan NuAmps Express system (Compumedics Ltd., VIC, Australia) and recorded at a sampling rate of 500 Hz with 16-bit quantisation.Subject No. Number of Sessions Numbers of Events
S01 5 4827
S02 2 2028
S04 1 1083
S05 4 6378
S06 1 1077
S09 3 2112
S11 1 1290
S12 2 1869
S13 2 2244
S14 2 2181
S22 4 5022
S23 1 1317
S31 2 3618
S35 2 3285
S40 2 3921
S41 5 6747
S42 2 2430
S43 3 5709
S44 4 7269
S45 2 4023
S48 1 1050
S49 3 3102
S50 2 2085
S52 1 717
S53 3 3654
S54 1 615
S55 1 1923
[image:5.595.154.331.45.387.2]Total 62 81576
Table 2. The numbers of sessions and events per subject.
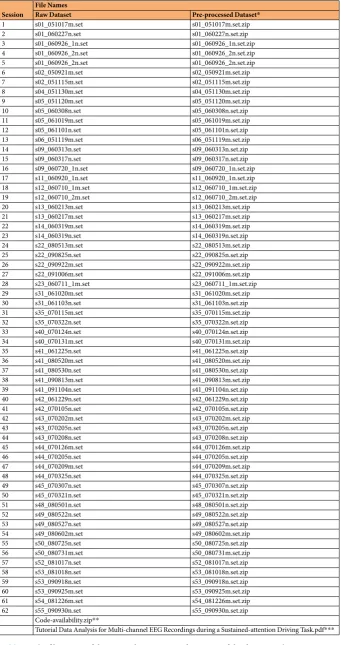
[image:5.595.155.553.434.567.2]Session File NamesRaw Dataset Pre-processed Dataset* 1 s01_051017m.set s01_051017m.set.zip 2 s01_060227n.set s01_060227n.set.zip 3 s01_060926_1n.set s01_060926_1n.set.zip 4 s01_060926_2n.set s01_060926_2n.set.zip 5 s01_060926_2n.set s01_060926_2n.set.zip 6 s02_050921m.set s02_050921m.set.zip 7 s02_051115m.set s02_051115m.set.zip 8 s04_051130m.set s04_051130m.set.zip 9 s05_051120m.set s05_051120m.set.zip 10 s05_060308n.set s05_060308n.set.zip 11 s05_061019m.set s05_061019m.set.zip 12 s05_061101n.set s05_061101n.set.zip 13 s06_051119m.set s06_051119m.set.zip 14 s09_060313n.set s09_060313n.set.zip 15 s09_060317n.set s09_060317n.set.zip 16 s09_060720_1n.set s09_060720_1n.set.zip 17 s11_060920_1n.set s11_060920_1n.set.zip 18 s12_060710_1m.set s12_060710_1m.set.zip 19 s12_060710_2m.set s12_060710_2m.set.zip 20 s13_060213m.set s13_060213m.set.zip 21 s13_060217m.set s13_060217m.set.zip 22 s14_060319m.set s14_060319m.set.zip 23 s14_060319n.set s14_060319n.set.zip 24 s22_080513m.set s22_080513m.set.zip 25 s22_090825n.set s22_090825n.set.zip 26 s22_090922m.set s22_090922m.set.zip 27 s22_091006m.set s22_091006m.set.zip 28 s23_060711_1m.set s23_060711_1m.set.zip 29 s31_061020m.set s31_061020m.set.zip 30 s31_061103n.set s31_061103n.set.zip 31 s35_070115m.set s35_070115m.set.zip 32 s35_070322n.set s35_070322n.set.zip 33 s40_070124n.set s40_070124n.set.zip 34 s40_070131m.set s40_070131m.set.zip 35 s41_061225n.set s41_061225n.set.zip 36 s41_080520m.set s41_080520m.set.zip 37 s41_080530n.set s41_080530n.set.zip 38 s41_090813m.set s41_090813m.set.zip 39 s41_091104n.set s41_091104n.set.zip 40 s42_061229n.set s42_061229n.set.zip 41 s42_070105n.set s42_070105n.set.zip 42 s43_070202m.set s43_070202m.set.zip 43 s43_070205n.set s43_070205n.set.zip 44 s43_070208n.set s43_070208n.set.zip 45 s44_070126m.set s44_070126m.set.zip 46 s44_070205n.set s44_070205n.set.zip 47 s44_070209m.set s44_070209m.set.zip 48 s44_070325n.set s44_070325n.set.zip 49 s45_070307n.set s45_070307n.set.zip 50 s45_070321n.set s45_070321n.set.zip 51 s48_080501n.set s48_080501n.set.zip 52 s49_080522n.set s49_080522n.set.zip 53 s49_080527n.set s49_080527n.set.zip 54 s49_080602m.set s49_080602m.set.zip 55 s50_080725n.set s50_080725n.set.zip 56 s50_080731m.set s50_080731m.set.zip 57 s52_081017n.set s52_081017n.set.zip 58 s53_081018n.set s53_081018n.set.zip 59 s53_090918n.set s53_090918n.set.zip 60 s53_090925m.set s53_090925m.set.zip 61 s54_081226m.set s54_081226m.set.zip 62 s55_090930n.set s55_090930n.set.zip
Code-availability.zip**
[image:6.595.156.498.46.692.2]Tutorial Data Analysis for Multi-channel EEG Recordings during a Sustained-attention Driving Task.pdf***
EEG validation.
Consistent with previous data descriptors on practice reuse of EEG processing23,24, notethat all EEG data including both raw and pre-processed versions, were saved in the figshare. In terms of the pre-processed dataset, all EEG data were saved after the pre-processing steps. The pre-processing steps included bandpass filters and artefact rejection. To be specific, raw EEG signals were subjected to 1-Hz high-pass and 50-Hz low-pass finite impulse response (FIR) filters. For artefact rejection, apparent eye blink contamination in the EEG signals was manually removed by visual inspection. Second, artefacts were removed by the Automatic Artifact Removal (AAR) plug-in for EEGLAB, which provided automatic correction of ocular and muscular arte-facts in the EEG signals. The file names of the raw and pre-processed versions of the dataset are shown in Table 3. Additionally, we shared this EEG dataset with our partner groups, including the University of California at San Diego (UCSD) and the DCS Corporation. Our findings are consistent with their results25,26, providing technical
validation of this method for accurately estimating changes in driver arousal, fatigue, and vigilance levels by eval-uating changes in behavioural and neurocognitive performance.
Usage Notes
The raw experimental dataset21 and the pre-processed dataset22 can be downloaded from the publicly
accessi-ble repository of figshare. Any user interested in this dataset do not need to register with figshare to download two versions of the datasets, the raw and pre-processed versions, to the user’s personal computer. The raw and pre-processed versions of the dataset in the figshare projects are named “Multi-channel EEG recordings during a sustained-attention driving task (raw dataset)” and “Multi-channel EEG recordings during a sustained-attention driving task (pre-processed dataset)”, respectively.
The data can be analysed in EEGLAB, which is a MATLAB toolbox with an interactive graphical user interface (GUI). It includes multiple functions for processing continuous and event-related EEG using independent com-ponent analysis (ICA), time/frequency analysis and other methods, including artefact rejection under multiple operation systems. EEGLAB also provides extensive tutorials (https://sccn.ucsd.edu/wiki/EEGLAB_TUTORIAL_ OUTLINE) to help researchers conduct data analyses. We recommend that researchers use EEGLAB with version 5.03 on Windows 7 or Linux.
A data analysis tutorial (named “Tutorial Data Analysis for Multi-channel EEG Recordings during a Sustained-attention Driving Task.pdf) and MATLAB codes (named “Code-availability.zip”) are provided as ref-erence material for EEG pre-processing and data analysis during a sustained-attention driving task. These items can be accessed at our figshare webpage, ensuring that researchers can easily reuse the dataset.
Additionally, we provide some key notes regarding the data analysis.
1. Load the existing dataset. Select menu item ‘File’ and select the ‘Load existing dataset’ sub-menu item. Then, select the existing dataset (e.g., s01_051017m.set) from the sub-window pop up. If users use the pre-processed dataset, each file must first be decompressed, and then, the .set file should be selected. 2. Check the workspace in MATLAB. The ‘EEG’ variable contains the following information:
srate: sampling rate
EEG.chanlocs: the number of channels EEG.event: event type and latency
data: EEG signals with channels multiply times
3. Extract data epochs and conduct further data analysis. To study the event-related EEG dynamics of continuously recorded data, we must extract the data epoch time of the events of interest (for example, the data epoch time of the onsets of one class of experimental stimuli) by selecting Tools > Extract Epochs. Additionally, removing a mean baseline value from each epoch is useful when there are baseline differ-ences between data epochs (e.g., arising from low frequency drifts or artefacts). Additionally, EEGLAB contains several functions for plotting averages of dataset trials/epochs, selecting data epochs, comparing event-related brain potential (ERP) images, working with ICA components, decomposing time/frequency information and combining multiple datasets.
4. Considering the sample size calculation, if we consider a population size with 62 copies, a 95% confidence level, and a 5% margin of error, the minimum sample size should be 54 copies.
Code availability
Readers can access tutorial and codes in our raw and pre-processed datasets at the figshare.com. Of them, a 59-page tutorial named “Tutorial Data Analysis for Multi-channel EEG Recordings during a Sustained-attention Driving Task.pdf” is provided for researchers to pre-process and analyse multi-channel EEG data acquired during a sustained-attention driving task. Furthermore, MATLAB codes named “Code-availability.zip” for EEG pre-processing and data analysis can also be found.
references
1. Lee, J. D. Fifty years of driving safety research. Human Factors 50, 521–528 (2008).
2. Lal, S. K. & Craig, A. A critical review of the psychophysiology of driver fatigue. Biological Psychology 55, 173–194 (2001). 3. Huang, R.-S., Jung, T.-P. & Makeig, S. Tonic changes in EEG power spectra during simulated driving. Lecture Notes in Computer
Science 5638, 394–403 (2009).
4. Liao, L.-D. et al. Biosensor technologies for augmented brain-computer interfaces in the next decades. Proceedings of the IEEE 100, 1553–1566 (2012).
5. Lin, C.-T. et al. EEG-based assessment of driver cognitive responses in a dynamic virtual-reality driving environment. IEEE Transactions on Biomedical Engineering 54, 1349–1352 (2007).
6. Wu, R.-C. et al. Proceedings. 2004 IEEE International Joint Conference in Neural Networks. 585–590 (IEEE) (2004).
8. Chuang, S. et al. Assessing EEG Spectral Comodulation in a Realistic Driving Experiment using Independent Components Analysis.
NeuroImage 47, 124 (2009).
9. Lin, C. et al. Auditory Feedback Affects Driver Attention and Brain Activity. NeuroImage 47, 65 (2009).
10. Chuang, C.-H. et al. Brain electrodynamic and hemodynamic signatures against fatigue during driving. Frontiers in Neuroscience 12, 181 (2018).
11. Lin, C.-T., Ko, L.-W. & Shen, T.-K. Computational intelligent brain computer interaction and its applications on driving cognition.
IEEE Computational Intelligence Magazine 4, 32–46 (2009).
12. Lin, C.-T. et al. EEG-Based Brain-Computer Interfaces: A Novel Neurotechnology and Computational Intelligence Method. IEEE Systems, Man, and Cybernetics Magazine 3, 16–26 (2017).
13. Chuang, C.-H. et al. Dynamically Weighted Ensemble-based Prediction System for Adaptively Modeling Driver Reaction Time. Preprint at, https://arxiv.org/abs/1809.06675 (2018).
14. Chuang, C.-H., Ko, L.-W., Jung, T.-P. & Lin, C.-T. Kinesthesia in a sustained-attention driving task. Neuroimage 91, 187–202 (2014). 15. Lin, C.-T. et al. Mind-wandering tends to occur under low perceptual demands during driving. Scientific Reports 6, 21353 (2016). 16. Lin, C.-T. et al. Wireless and wearable EEG system for evaluating driver vigilance. IEEE Transactions on Biomedical Circuits and
Systems 8, 165–176 (2014).
17. Lin, C.-T., Tsai, S.-F. & Ko, L.-W. EEG-based learning system for online motion sickness level estimation in a dynamic vehicle environment. IEEE Transactions on Neural Networks and Learning Systems 24, 1689–1700 (2013).
18. Chuang, C.-H., Huang, C.-S., Ko, L.-W. & Lin, C.-T. An EEG-based perceptual function integration network for application to drowsy driving. Knowledge-Based Systems 80, 143–152 (2015).
19. Liu, Y.-T., Lin, Y.-Y., Wu, S.-L., Chuang, C.-H. & Lin, C.-T. Brain dynamics in predicting driving fatigue using a recurrent self-evolving fuzzy neural network. IEEE Transactions on Neural Networks and Learning Systems 27, 347–360 (2016).
20. Wu, D., Lawhern, V. J., Gordon, S., Lance, B. J. & Lin, C.-T. Driver drowsiness estimation from EEG signals using online weighted adaptation regularization for regression (OwARR). IEEE Transactions on Fuzzy Systems 25, 1522–1535 (2016).
21. Cao, Z., Chuang, M., King, J.-T. & Lin, C.-T. Multi-channel EEG recordings during a sustained-attention driving task (raw dataset).
figshare https://doi.org/10.6084/m9.figshare.6427334.v5 (2019).
22. Cao, Z., Chuang, M., King, J.-T. & Lin, C.-T. Multi-channel EEG recordings during a sustained-attention driving task (pre-processed dataset). figshare https://doi.org/10.6084/m9.figshare.7666055.v3 (2019).
23. Brantley, J. A., Luu, T. P., Nakagome, S., Zhu, F. & Contreras-Vidal, J. L. Full body mobile brain-body imaging data during unconstrained locomotion on stairs, ramps, and level ground. Scientific Data 5, 180133 (2018).
24. Shin, J. et al. Simultaneous acquisition of EEG and NIRS during cognitive tasks for an open access dataset. Scientific Data 5, 180003 (2018).
25. Wei, C.-S., Wang, Y.-T., Lin, C.-T. & Jung, T.-P. Toward Drowsiness Detection Using Non-Hair-Bearing EEG-Based Brain-Computer Interfaces. IEEE Transactions on Neural Systems and Rehabilitation Engineering 26, 400–406 (2018).
26. Hsu, S.-H. & Jung, T.-P. Monitoring alert and drowsy states by modeling EEG source nonstationarity. Journal of Neural Engineering 14, 056012 (2017).
Acknowledgements
This work was supported in part by the Australian Research Council (ARC) under discovery grants DP180100670 and DP180100656. This research was also sponsored in part by the Army Research Laboratory and was completed under Cooperative Agreement Number W911NF-10-2-0022 and W911NF-10-D-0002/TO 0023. The views and the conclusions contained in this document are those of the authors and should not be interpreted as representing the official policies, either expressed or implied, of the Army Research Laboratory or the U.S. Government. The U.S. Government is authorized to reproduce and distribute reprints for government purposes notwithstanding any copyright notation herein. Additionally, we express our gratitude to all of the subjects who kindly participated in this study. We thank all of the students and staff at the Brain Research Center in National Chiao Tung University and Computational Intelligence and Brain Computer Interface Center in University of Technology Sydney for their assistance during the study process.
author Contributions
C.T. Lin and J.T. King designed and performed the experiment. Z. Cao and C.H. Chuang collected, checked and analysed the data. Z. Cao and C.H. Chuang wrote the paper. C.T. Lin and J.T. King revised the manuscript. All of the authors read and approved the final manuscript.
additional information
Competing Interests: The authors declare no competing interests.
Publisher’s note: Springer Nature remains neutral with regard to jurisdictional claims in published maps and institutional affiliations.
Open Access This article is licensed under a Creative Commons Attribution 4.0 International License, which permits use, sharing, adaptation, distribution and reproduction in any medium or format, as long as you give appropriate credit to the original author(s) and the source, provide a link to the Cre-ative Commons license, and indicate if changes were made. The images or other third party material in this article are included in the article’s Creative Commons license, unless indicated otherwise in a credit line to the material. If material is not included in the article’s Creative Commons license and your intended use is not per-mitted by statutory regulation or exceeds the perper-mitted use, you will need to obtain permission directly from the copyright holder. To view a copy of this license, visit http://creativecommons.org/licenses/by/4.0/.
The Creative Commons Public Domain Dedication waiver http://creativecommons.org/publicdomain/zero/1.0/
applies to the metadata files associated with this article.