A study on the effect of massive pleural effusion on
cardiovascular hemodynamics
Dissertation submitted to
THE TAMIL NADU DR. M.G.R. MEDICAL UNIVERSITY
In partial fulfilment of the requirements for the award of the degree of
M.D.BRANCH - I GENERAL MEDICINE
MADRAS MEDICAL COLLEGE
RAJIV GANDHI GOVERNMENT GENERAL HOSPITAL, CHENNAI 600 003
THE TAMILNADU DR. M.G.R. MEDICAL UNIVERSITY CHENNAI, INDIA
CERTIFICATE
This is to certify that the dissertation titled “A study on the effect of massive pleural
effusion on cardiovascular hemodynamics” is the bonafide original work of
Dr. MURUGA BHARATHY K., in partial fulfilment of the requirements for M.D. Branch– I (General Medicine) Examination of the Tamilnadu Dr. M.G.R. Medical University to be held in April 2012. The Period of study was from April 2011 to November 2011.
Prof. C.RAJENDIRAN, M.D.,
Guide and Supervisor, Director,
Institute of Internal Medicine, Madras Medical College and
Rajiv Gandhi Government General Hospital, Chennai.
Dr. V. KANAGASABAI, M.D.,
Dean,
DECLARATION
I hereby solemnly declare that the dissertation titled ―A study on the effect of massive pleural effusion on cardiovascular hemodynamics” was done by me at Madras Medical College and Rajiv Gandhi Government General Hospital, Chennai-3, during April 2011 to November 2011 under the guidance and supervision of my unit Chief Prof. C. RAJENDIRAN, M.D.
The dissertation is submitted to the Tamilnadu Dr. M.G.R. Medical University towards the partial fulfilment of requirement for the award of M.D Degree (Branch-1) in General Medicine.
SIGNATURE OF THE CANDIDATE
ACKNOWLEDGEMENT
At the outset, I thank Prof.V. KANAGASABAI, M.D., Dean, Madras Medical College and Rajiv Gandhi Government General Hospital, Chennai-3, for having permitted me to use hospital data for the study.
I am indebted to my chief Prof. C. RAJENDIRAN, M.D., Director and Head of the Department, Institute of Internal Medicine, Madras Medical College and Rajiv Gandhi Government General Hospital, Chennai-3, for his encouragement and unstinting support throughout the study.
I am grateful to Prof. GEETHA SUBRAMANIAN, D.M., Head of the Department and Dr. SUNDAR, Assistant Professor, Department of Cardiology, Madras Medical College and Rajiv Gandhi Government General Hospital, Chennai-3, for their support and guidance.
I thank my Assistant Professors Dr. ANUSUYA, M.D., and Dr. S.BASKER, M.D.,
Institute of Internal Medicine, Madras Medical College and Rajiv Gandhi Government General Hospital, Chennai-3, for their support.
I thank all the patients who participated in the study.
ABBREVIATIONS
RA right atrium
RV right ventricle
LA left ventricle
RVDC Right ventricular diastolic collapse
PR pulse rate
SYS BP systolic blood pressure DIA BP diastolic blood pressure RA cm right atrial size in centimetre LA cm left atrial size in centimetre
RV basal right ventricular dimension at the base RV mid right ventricular size at mid-level RV base-apex right ventricular size from base to apex LV sys left ventricular size in systole
LV dias left ventricular size in diastole
SpO2 pulse oximetry haemoglobin saturation
BTC before thoracentesis ATC after thoracentesis
CONTENTS
PAGE NO
1. INTRODUCTION ... 1
2. AIMS AND OBJECTIVES ... 3
3. REVIEW OF LITERATURE ... 4
4. MATERIALS AND METHODS ... 16
5. RESULTS ... 20
6. DISCUSSION ... 45
7. CONCLUSION ... 50
8. REFERENCES ... 51
9. APPENDIX ... 55 a. PROFORMA
b. MASTER CHART
INTRODUCTION
Pleural effusion is a medical emergency if it is more than moderate.
Pleural effusion of any etiology may compromise pulmonary function resulting
in dyspnea. The close relation between pleura and pericardium and the
dependence of their pressure kinetics are well known factors. Many literatures
on pleural effusion deal with the effect of pleural effusion on gaseous functions
and diaphragmatic functions1, 2, 3, 4and literatures are very few on the effects of
pleural effusion on cardiovascular hemodynamics5. So a study on the impact of
pleural effusion on cardiovascular hemodynamics taking into consideration all
possible variables will bring into limelight the relationship between these two
cavities and help to formulate concepts that may provide some insight into the
pathophysiology of symptoms in pleural effusion.
The mediastinal pleura and the pericardium are closely related6.In pleural
effusion there is a gradient in the pleural pressure due to the hydrostatic column
of fluid6,7. Accordingly, the pleural pressure in the dependent part of the
hemithorax is much greater than that in the superior part of the hemithorax. So
the collections in the pleural cavity can compromise cardiac function mimicking
a tamponade. There are few case reports on cardiac chamber collapse in cases of
massive pleural effusion8,9. Intra thoracic pressure is transmitted to cardiac
chambers through pericardium, and one of the important determinants of
intrathoracic pressure is intrapleural pressure. Intra pericardial pressure both
pleural pressure normally reduces pericardial pressure, RA, RV, pulmonary
capillary wedge pressure and systemic arterial pressure slightly.
It has been shown in a canine model that large bilateral pleural effusions
lead to an increase in intrapleural pressure8, which causes a linear increase in
intrapericardial pressure finally leading to right ventricular diastolic collapse10,
11
. So cardiac tamponade physiology is not only related to pericardial effusions.
Large pleural effusions of various etiologies, in the absence of significant
pericardial effusions, have been reported to lead to cardiac tamponade
physiology. Clinical manifestations of large pleural effusions include
hemodynamic instability and pulsus paradoxus. Larger effusions and bilateral
effusions cause higher incidence of ventricular collapse and hemodynamic
AIMS AND OBJECTIVES
To study the impact of pleural effusion on cardiovascular hemodynamics.
To analyse whether the sidedness of pleural effusion has any impact on
cardiovascular hemodynamics.
REVIEW OF LITERATURE
The pleura is a thin serous layer, which covers the lungs (visceral pleura)
and is reflected, by way of the lung hila, on to the chest wall and pericardium
(parietal pleura).The pleural space thus created extends from the root of the
neck, 3 cm above the mid-point of the clavicle, down behind the abdominal
cavity, in the costo-diaphragmatic recess, to the 12th rib overlying the
kidney12.Only a thin layer of pleural fluid separates the parietal and visceral
pleura. The parietal layer secretes 2400mlof fluid daily, which is resorbed by
the visceral layer13.Pathological collection of fluid in pleural cavity leads to
pleural effusion. Pleural pressure increases with accumulation of fluid. When
pleural fluid is present, its volume must be compensated for by an increase in
the size of the thoracic cavity, a decrease in the size of the lung or a decrease in
the size of the heart, or a combination of these changes6.
Since the thoracic cavity, lungs, and heart are all distensible objects, the
volume of each is dependent on the pressure inside minus the pressure outside.
The presence of pleural fluid increases the pleural pressure. Since the distending
pressure of the thoracic wall is the atmospheric pressure minus the pleural
pressure, an increase in the pleural pressure will lead to an increase in the
distending pressure of the thoracic cavity and an increase in the volume of the
thoracic cavity. The distending pressure of the lungs is the alveolar pressure
minus the pleural pressure. Therefore, an increase in the pleural pressure will
intracardiac pressure minus the pleural pressure, an increase in the pleural
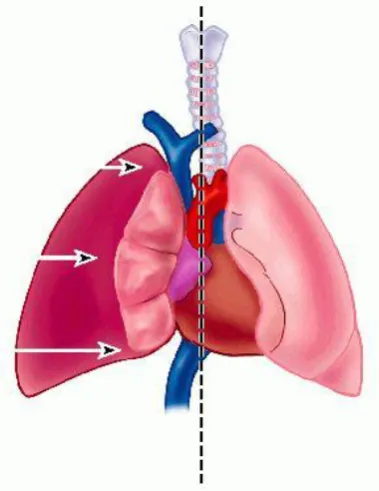
[image:11.595.166.475.169.422.2]pressure will lead to a decrease in the size of the heart6.
Figure 1 Relationship between pleura and pericardium14
[image:11.595.221.411.488.734.2]Pericardial space anatomy:
The pericardium is a fibroserous sac15 that encloses the heart and the root
of the great vessels. Its function is to restrict excessive movements of the heart
as a whole and to serve as a lubricated container in which the different parts of
the heart can contract.
The serous pericardium lines the fibrous pericardium and coats the heart.
It is divided into parietal and visceral layers. The parietal layer lines the fibrous
pericardium and is reflected around the roots of the great vessels to become
continuous with the visceral layer of serous pericardium that closely covers the
heart.
The visceral layer is closely applied to the heart and is often called the
epicardium. The slit like space between the parietal and visceral layers is
referred to as the pericardial cavity. Normally, the cavity contains a small
amount of fluid (about 50 mL), the pericardial fluid, which acts as a lubricant to
facilitate movements of the heart.
Pleural fluid physiology:
The pleural space contains a tiny amount (≈0.3 ml/kg) of hypo-oncotic
fluid (≈1 g/dl protein). Pleural fluid turnover is estimated to be ≈0.15 ml/kg/h.
Pleural fluid is produced at parietal pleural level, mainly in the less dependent
regions of the cavity. Reabsorption is accomplished by parietal pleural
lymphatics in the most dependent part of the cavity, on the diaphragmatic
increase in response to an increase in pleural fluid filtration, acting as a negative
feedback mechanism to control pleural liquid volume. Such control is very
efficient, as a 10 fold increase in filtration rate would only result in a 15%
increase in pleural fluid volume. When filtration exceeds maximum pleural
lymphatic flow, pleural effusion occurs16.
Relationship between pleura and pericardium:
The parietal pleura has costal, mediastinal, and diaphragmatic parts and a
cupola. The costal pleura is separated from the sternum, costal cartilages, ribs,
and muscles by a loose connective tissue termed endothoracic fascia, which
provides a natural cleavage plane for surgical separation of the pleura from the
thoracic wall. Anteriorly, the costal pleura turns sharply onto the mediastinum,
and the underlying portion of the pleural cavity is called the costomediastinal
recess. Inferiorly, the costal pleura is continuous with the diaphragmatic pleura,
and the underlying space is termed the costodiaphragmatic recess. In the adult,
the anterior borders of the right and left pleurae probably meet at or near the
median plane during a part of their course. The left anterior border sometimes
diverges to leave a part of the pericardium uncovered (bare area). Posteriorly,
the pleura crosses the twelfth rib. At the root of the lung, the mediastinal pleura
turns laterally, enclosing the structures at the root and becoming continuous
with the visceral pleura. This reflection projects downward as a tapering double
fold called the pulmonary ligament. The mediastinal pleura is adherent to the
relationship between mediastinal pleura and pericardium is responsible for
transmission of pressure alterations in the pleural cavity to pericardium and
chambers of heart.
Mechanism of cardiac tamponade with a large pleural effusion:
Figure 3 Mechanism of cardiac tamponade in massive pleural effusion
The figure. 3 (i)18 demonstrates a normal subject where intrapericardial
pressure (A mmHg) and intrapleural pressures (A mmHg) are the same. The se
figure. 3(ii) demonstrates a model where a pleural effusion is present and the
intrapleural pressure increases from A to A+B. The pericardial pressure is also
increased to A+B because intrapleural pressure is transmitted to the pericardial
sac. If there is a concomitant pericardial effusion in addition to pleural effusion,
the intrapericardial pressure will increase further to A+B+C (figure. 3(iii)).
PLF - pleural fluid and PE - pericardial effusion.
Pathophysiology of cardiac tamponade:
For each cardiac chamber, its transmural pressure ie. intracardiac pressure
minus pericardial pressure, is a principal determinant of its filling(Transmural
preload.19,20).Normal pericardial pressure is lower than the right atrial mean and
right ventricular diastolic pressure that right atrial transmural pressure (right
atrial pressure minus pericardial pressure) is normally higher than its cavitary
pressure. In tamponade, rising pericardial pressure progressively reduces the
transmural atrial and ventricular pressure and ultimately can make the average
transmural pressure of first the right and subsequently the left cardiac chambers
phasically negative.21,22 Survival necessitates the ensuing parallel rise in
diastolic pressures, first in the right side of the heart and later the left side of the
heart.
In order to adequately fill the ventricles, against the increasing pericardial
pressure both systemic and pulmonary vascular beds must generate sufficient
pressure. In addition cardiac chamber compliance is also reduced by pericardial
compression, leading to progressive resistance to filling. So to increase the
filling pressure, body starts to conserve fluid, which is a gradual adaptation,
hence requires time, which is not possible in acute cardiac tamponade.
As a result in case of gradually developing tamponade, diastolic pressure
in both ventricles and pulmonary artery equilibrates with mean right and left
atrial pressure at approximately the intra-pericardial pressure. This is the phase
at which most patients will have frank exaggeration of respiratory fluctuation in
arterial blood pressure (pulsus paradoxus).
Tamponading pericardial fluid compresses the heart throughout systole
when blood is leaving it during the right and left ventricular ejection periods,
since ventricular ejection expels blood, reducing ventricular volumes. Ejection
thus transiently reduces pericardial pressure, transiently increasing transmural
pressure. Ejection simultaneously aids atrial filling through enlarging the atria
by pulling their ―floors‖ (valve levels) toward the ventricular apices22
.
Like most tamponade induced abnormalities of pressure and flow,
transmural pressures are reciprocally reduced and increased during the
respiratory phases for the left vs the right heart. Thus, inspiration increases right
heart filling at the expense of the left heart with reversal in expiration. In critical
tamponade, when cardiac output usually has fallen by at least 30%21,23.24,25,
transmural pressures are, on average, zero (typically between 15 and 30 mmHg
within the pericardium and between 15 and 30 mmHg within the heart in
euvolemic patients) so that respiratory reciprocation becomes a principal
physiologic mechanism contributing at some level to cardiac input and output.
A significant component of respiratory reciprocation is the marked shift of the
ventricular septum into the left ventricle when inspiration fills the right heart at
the expense of the left with reversal on expiration. Clinically, respiratory
reciprocation is expressed as pulsus paradoxus.
Echo parameters used to confirm cardiac tamponade:
The criteria26,27 that suggest cardiac tamponade by echocardiogram are:
2. Interventricular septum deviation toward the left ventricular cavity on
inspiration.
3. An increase in trans-mitral inflow E wave velocity of more than 25% on
expiration and/or increase in tricuspid inflow E wave velocity by greater
than 40% on inspiration.
4. Inspiratory variation of peak aortic and pulmonary flow velocities32.
5. Inferior vena cava diameter and its variation with respiration.
The normal trans-AV valvular flow profile has two peaks - an E and an A
wave. The E peak arises due to early diastolic filling. Most filling (70-75%) of
the ventricle occurs during this phase. The A peak arises due to atrial
contraction, forcing approximately 20-25% of stroke volume into the ventricle.
Classically, the E-wave velocity is slightly greater than that of the A wave. As
the normal output of ventricles varies with respiration, so varies the peak of
Eand A velocity during phases of respiration. This phenomenon is exaggerated
in cardiac tamponade and is taken as a marker for tamponade.
Previous studies:
Few animal studies were done to establish the hypothesis that massive
pleural effusion can cause cardiac tamponade like physiology, based on the
concept of close approximation of both pleura around the heart and the close
relationship between intra-pleural and intra-pericardial pressure during normal
Vaska8 et al demonstrated that right ventricular diastolic collapse28 was
produced by intrapleural instillation of fluid in a canine model. It was observed
that the larger the pleural effusion, the higher the pericardial pressure. In the
study by Vaska et al, the following figures give relationship between various
parameters and intra-pericardial pressure, with instillation of fluid in pericardial
[image:18.595.157.479.331.569.2]space and pleural space.
Figure 4Relationship between pleural and pericardial pressure during intrapleural instillation (dotted lines) and intrapericardial instillation (solid lines) of fluid
Figure 4 shows that, with intra-pleural instillation of fluid, the relationship
between pleural pressure and intra-pericardial pressure rise is linear, whereas
with intra-pericardial instillation of fluid, intra-pericardial pressure rises
Figure 5 Showing relationship between intra-pericardial pressure and cardiac output with intra-pleural (dotted lines) and intra-pericardial instillation of fluid (solid lines)
From Figure 5, it is clear that intra-pericardial pressure rises with both
intra-pleural and intra-pericardial instillation of fluid, but more steeply with
intrapericardial instillation of fluid, compared to intra-pleural instillation. When
cardiac output is compared, intra-pleural fluid instillation is better tolerated than
intra-pericardial instillation of fluid, due to less abrupt fall in cardiac output in
the former.
Wrisleyetal28 had demonstrated marked diastolic collapse of right atrium
without hemodynamic compromise in dogs. Similar results were obtained from
animal studies conducted by Kaplan et al29 and Venkatesh et al33.
Echocardiographic evidence of cardiac tamponade in patients with pleural
reported that in 116 patients with pleural effusion with no pericardial effusion
18% had evidence of cardiac chamber collapse on echocardiography.
Traylor et al34 evaluated 37 patients with large pleural effusion with
echocardiographic and clinical signs of cardiac tamponade9. In their study, the
patients were divided into two groups. Group 1: Pleural effusions occupying
less than a hemithorax, (n = 10). Group 2: Effusions greater than a hemithorax
on chest X ray, (n = 27). Group 1 patients had no clinical or echocardiographic
signs of cardiac tamponade. However, in Group 2, 8 subjects had elevated JVP,
8 had pulsus paradoxus, 6 had RV diastolic collapse, and 23 had flow velocity
paradoxus. Those signs of cardiac tamponade resolved completely in 20 patients
after thoracentesis. Pericardiocentesis was not performed in any of these
patients. In terms of sidedness of pleural effusion, group 2 showed that 11
patients had left, 8 had right, and 8 had bilateral pleural effusions. Although the
study clearly demonstrated size of pleural effusion is an important factor,
location of pleural fluid did not have a significant impact on cardiac tamponade
physiology.
In the study by Traylor et al. in group 2, 8 patients had small pericardial
effusion (not quantitated). Studies had shown that size of pericardial effusion is
not linearly related to intra-pericardial pressure and any acute increase in
quantity of pericardial fluid can result in cardiac tamponade, rather than
absolute quantity of fluid increase. So as there are no clues to rapidity of fluid
effusion being a confounder. So this study was planned to exclude all
pericardial effusions, however trivial they may be.
Other assumptions and procedures were planned similar Traylor et.al34.
Right ventricular diastolic collapse is a sensitive and specific indicator for
the early detection of hemodynamically important pericardial effusions and is
used in experimental studies on pleural effusion. Traylor et al had noted right
atrial collapse, which is the commonly used marker for tamponade physiology,
as RVDC occurs early in the course of tamponade than right atrial collapse.
In addition to flow velocity paradoxus across AV valves all possible
parameters involved in cardiac tamponade like pulmonary artery and aortic
respiratory variations RA,RV,LA sizes before and after thoracentesis were
included in this study.
Further improvement, in defining the concept can be done by future
studies with invasive monitoring of pleural pressure, pericardial pressure and
MATERIALS AND METHODS
Setting : In-patient department,
Institute of Internal Medicine,
Rajiv Gandhi Government General Hospital,
Madras Medical College, Chennai.
Echocardiography lab,
Department of cardiology,
Madras Medical College, Chennai.
Sampling technique : Convenient sampling
Ethical committee approval : Obtained
Design of the study : Prospective study
Period of study : April 2011 to November 2011
Inclusion Criteria:
1. Age > 12
2. Unilateral or bilateral massive pleural effusion of non-cardiac etiology
Exclusion Criteria:
1. Pleural effusion secondary to cardiac disease
2. Constrictive pericarditis
3. Pericardial effusion
Case Definition:
In our study, the criteria used for classifying massive pleural effusion is
any pleural effusion with chest x-ray postero-anterior view showing
METHODOLOGY AND INVESTIGATION DETAILS OF PATIENTS
After obtaining informed and written consent, patients above the age of
12 years who had unilateral or bilateral massive pleural effusion of non-cardiac
etiology were included in the study. Patients with pleural effusion secondary to
cardiac disease and patients with constrictive pericarditis, patients with mild and
moderate pleural effusion (less than ¾ of a hemithorax) were excluded from the
study. Patients were selected from inpatients wards in Institute of internal
medicine, where they were evaluated for pleural effusion.
Relevant history, physical examination, chest X ray, electrocardiogram
were done for all the patients. Patients with JVP above 3 cm from sternal angle
are noted.Spo2, pulse rate, respiratory rate, systolic and diastolic blood pressure
were taken and patients with pulsus paradoxus are noted. All the patients
underwent detailed echocardiographic study. The following echocardiographic
parameters were done which includesflow velocity across tricuspid valve, mitral
valve, pulmonary valve, and aorta, size of all the chambers and pulmonary
artery pressures were measured.
All the patients underwent therapeutic thorocentesis for massive pleural
effusion.A repeat chest x ray was taken to assure that the pleural effusion
remained less than a ½ of a hemithorax and all the clinical and echo parameters
were measured again within 24 hours. Pre and post therapeutic echo parameters
Data Analysis Methods:
Statistical analysis was done withGraphpadinstat3. Values obtained
before and after intervention were analysed using paired t-test and significance
of sidedness of pleural effusion, for development of cardiac tamponade
RESULTS
Patients‟ demographics and clinical factors:
Forty patients who had massive unilateral or bilateral pleural effusion
were included in our study. Out of 40 patients, 32were male and 8 were female
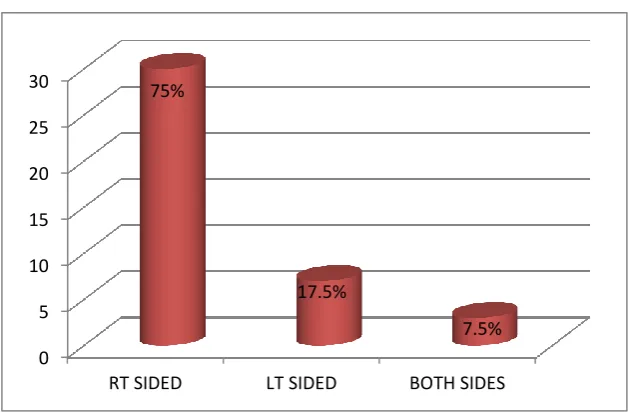
patients. 30patients had right sided, 7 had left sided and 3 had bilateral pleural
effusion. 25 patients had pleural effusion secondary to tuberculosis and 14
secondary to malignancy 1 due to decompensated liver disease with moderate
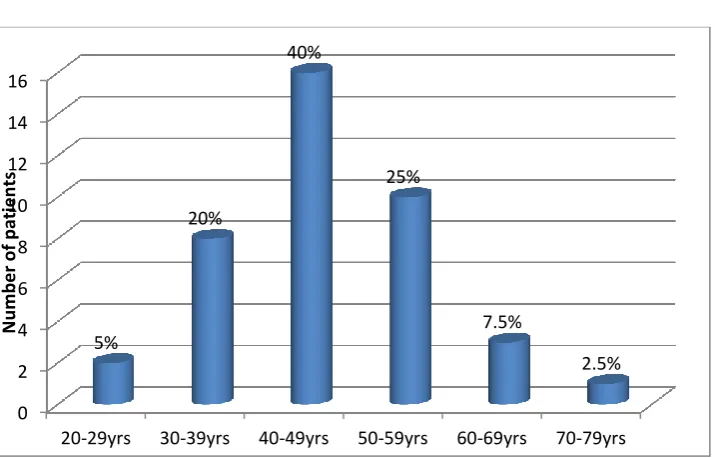
[image:26.595.140.498.376.605.2]ascites. Mean age of the patients was 46.6.
Figure 6 Age distribution
0 2 4 6 8 10 12 14 16
20-29yrs 30-39yrs 40-49yrs 50-59yrs 60-69yrs 70-79yrs
5%
20%
40%
25%
7.5%
2.5%
N
u
m
b
e
r
o
f p
atien
Figure 7 Sex distribution
Figure 8 Sidedness of pleural effusion
80% 20%
Males
Females
0 5 10 15 20 25 30
RT SIDED LT SIDED BOTH SIDES
75%
17.5%
Figure 9 Etiologies of pleural effusion
Figure 10 X-ray of a patient with right sided massive pleural effusion
Out of 7 patients with left sided massive pleural effusion, 4 had elevated
JVP and all the 4 patients also demonstrated pulsus paradoxus. In case of right
sided pleural effusion, out of 30 cases with massive pleural effusion 13had
62.5% 35%
2.5% TUBERCULOSIS
LUNG MALIGNANCY
elevated JVP and 18demonstrated pulsus paradoxus, whereas all three patients
who had bilateral pleural effusion with at least one hemithorax meeting the
inclusion criteria had both elevated JVP and pulsus paradoxus.
Figure 11 Elevated JVP in the study group
Figure 12 Pulsus paradoxus in the study group
50%
50% elevated JVP
Normal JVP
63% 37%
Pulsus paradoxux
Figure 13 Relative percentage of patients in each group with pulsus paradoxus and elevated JVP
As shown in table 1, before thorocentesis, SpO2 (mean ± SD)
was97%±1.3%, pulse rate was101.75±4.8, systolic blood pressure
was110.2±9.2, and diastolic blood pressure was 75±7.3. After thorocentesis,
SpO2was 98%±0.9, pulse rate was 93.43±3.5, systolic blood pressure
was114.40±7.6, and diastolic blood pressure was 78.60±4.6.
Table 1
Parameter Before Thoracentesis After Thoracentesis
SPO2 97%±1.3% 98%±0.9%
Systolic BP 110.2±9.2 114.40±7.6
Diastolic BP 75±7.3 78.60±4.6
Pulse rate 101.75±4.8 93.43±3.5
43%
46% 100%
43%
63% 100%
7
30 3
0 5 10 15 20 25 30 35
lt sided pleural effusion right sided pleural effusion bilateral pleural effusion
total no. of patients
Pulsus paradoxus
Figure 14 Mean SpO2, systolic BP, diastolic BP, pulse rate before and after thoracentesis
Figure 15 SpO2 values before and after thoracentesis
0 20 40 60 80 100 120
SpO2
pulse rate
systolic BP
diastolic BP
before thoracentesis
after thoracentesis
92% 93% 94% 95% 96% 97% 98% 99% 100% 101%
1 3 5 7 9 111315171921232527293133353739
Sp
O2
(%
)
SPO2 BEF
Figure 16 Pulse rate in study patients before and after thoracentesis
Figure 17 Systolic blood pressure in study patients before and after thoracentesis
0 20 40 60 80 100 120 140
1 3 5 7 9 111315171921232527293133353739
Pu lse R ate (p e r m in ) PR BEF PR AFTER 0 20 40 60 80 100 120 140
1 3 5 7 9 111315171921232527293133353739
Figure 18 Diastolic blood pressure in study patients before and after thoracentesis
Echocardiographic parameters:
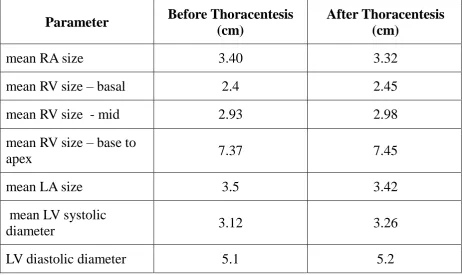
Chamber size before thoracentesis, mean right atrial size 3.40cm, mean
left atrial size 3.5cm, mean left ventricular systolic diameter 3.12 cm, mean left
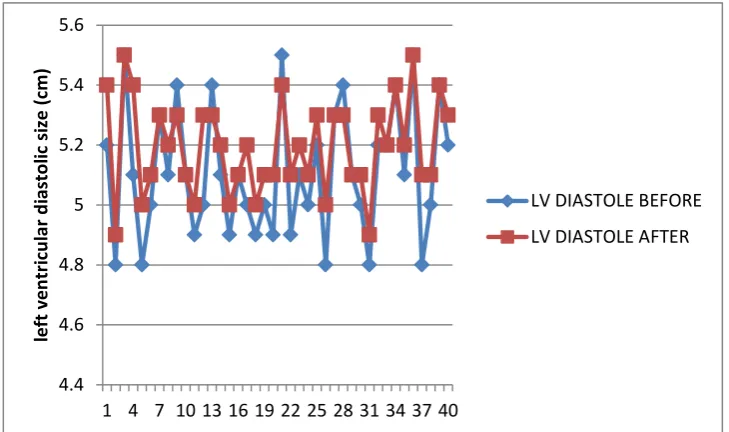
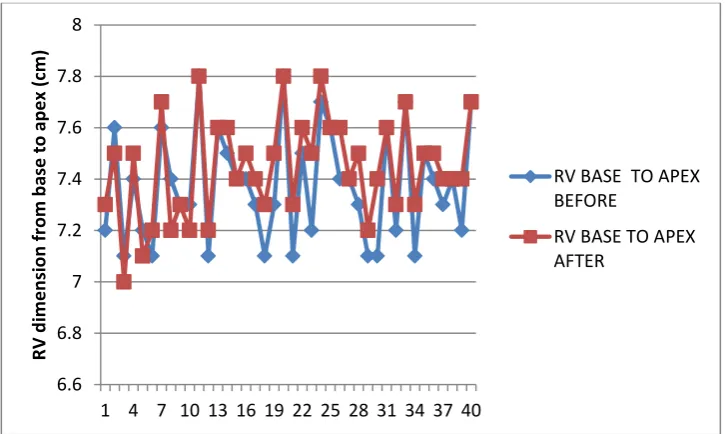
ventricular diastolic diameter 5.1cm. Mean right ventricular measurements at
the basal, mid and base to apex were 2.4 cm, 2.93 cm, and 7.37 cm respectively.
After thoracentesis, mean right atrial size 3.32 cm , mean left atrial size 3.42
cm, mean left ventricular systolic diameter 3.26cm, mean diastolic diameter 5.2
cm, mean right ventricular measurements at the basal, mid and base to apex
measurements 2.45 cm, 2.98 cm,7.45 cm respectively and 6 patients had right
atrial collapse.
0 10 20 30 40 50 60 70 80 90 100
1 3 5 7 9 111315171921232527293133353739
D
iasto
lo
ic
B
P (m
m
H
g)
DBP BEF
Figure 19 Echo showing right atrial collapse35
Figure 20 right atrial size before and after thoracentesis
0 0.5 1 1.5 2 2.5 3 3.5 4
1 3 5 7 9 11 13 15 17 19 21 23 25 27 29 31 33 35 37 39
R
ig
h
t
atr
ial
si
ze
(
cm
)
RA BEF
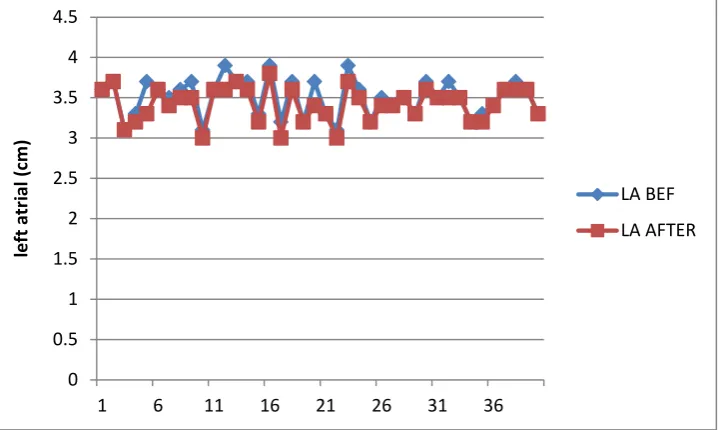
Figure 21 left atrial size before and after thoracentesis
Figure 22 left ventricular dimension before and after thoracentesis
0 0.5 1 1.5 2 2.5 3 3.5 4 4.5
1 6 11 16 21 26 31 36
le ft at ri al (c m ) LA BEF LA AFTER 0 0.5 1 1.5 2 2.5 3 3.5 4 4.5
1 4 7 10 13 16 19 22 25 28 31 34 37 40
le ft ven tr ic u lar sys to lic si ze (c m )
LV SYSTOLE BEFORE
[image:35.595.135.498.510.727.2]Figure 23 left ventricular diastolic size before and after thoracentesis
Figure 24 right ventricular size at base before and after thoracentesis
4.4 4.6 4.8 5 5.2 5.4 5.6
1 4 7 10 13 16 19 22 25 28 31 34 37 40
le ft ven tr ic u lar d iasto lic si ze (c m )
LV DIASTOLE BEFORE
LV DIASTOLE AFTER
0 0.5 1 1.5 2 2.5 3 3.5
1 4 7 10 13 16 19 22 25 28 31 34 37 40
R V d im e n si o n at b ase (c m )
RV BASE BEFORE
[image:36.595.137.497.495.710.2]Figure 25 right ventricular size at mid-level before and after thoracentesis
Figure 26 right ventricular size (base to apex) before and after thoracentesis
0 0.5 1 1.5 2 2.5 3 3.5 4
1 4 7 10 13 16 19 22 25 28 31 34 37 40
R V d im e n si o n at m id sep tal l e ve l (c m )
RV MID BEFORE
RV MID AFTER
6.6 6.8 7 7.2 7.4 7.6 7.8 8
1 4 7 10 13 16 19 22 25 28 31 34 37 40
R V d im e n si o n fr o m b ase to ap e x (c m )
RV BASE TO APEX BEFORE
[image:37.595.135.498.509.726.2]Table 2 showing mean chamber size before and after thoracentesis
Parameter Before Thoracentesis
(cm)
After Thoracentesis (cm)
mean RA size 3.40 3.32
mean RV size – basal 2.4 2.45
mean RV size - mid 2.93 2.98
mean RV size – base to
apex 7.37 7.45
mean LA size 3.5 3.42
mean LV systolic
diameter 3.12 3.26
LV diastolic diameter 5.1 5.2
Before thoracentesis mean flow velocity across tricuspid valve during
inspiration (E) - 74.47cm/s,(A) - 63.77cm/s; during expiration (E) - 52 cm/s, (A)
42.825 cm/s. Mean flow velocity across mitral valve during expiration (E)
-70.7 cm/s, (A) - 72.4 cm/s; during inspiration (E) - 53.6 cm/s , (A) - 57.8 cm/s.
Mean flow velocity across pulmonary artery during inspiration was 85.65 cm/s,
and during expiration was 63.27cm/s. Mean flow velocity across aorta during
expiration was 86.2 cm/s and during inspiration was 71.68 cm/s.
After thoracentesis, mean flow velocity across tricuspid valve during
inspiration (E) - 68.4 cm/s, (A) - 62 cm/s; during expiration (E) - 52.2 cm/s, (A)
cm/s, (A) - 70.3 cm/s; during inspiration (E) - 54.55 cm/s, (A) - 58.32 cm/s.
Mean flow velocity across pulmonary artery during inspiration was 81.46 cm/s,
and during expiration was 70 cm/s. Mean flow velocity across aorta during
[image:39.595.114.519.319.623.2]expiration was 79.5cm/s and during inspiration was 70 cm/s.
Figure 28 measurement of tricuspid E, A velocities
[image:40.595.141.491.420.703.2]Figure 30 measurement of pulmonary artery flow velocities
[image:41.595.135.496.449.727.2]Figure 32 mitral E velocity variation before and after thoracentesis
Figure 33 mitral A velocity variation before and after thoracentesis
-20 -10 0 10 20 30 40 50 60 70
1 4 7 10 13 16 19 22 25 28 31 34 37 40
m itr al E v e lo ci ty (c m /sec )
MITRAL E BEF
MITRAL E AFTER
-60 -40 -20 0 20 40 60 80 100
1 4 7 10 13 16 19 22 25 28 31 34 37 40
m itr al A veloc ity (c m /sec )
mitral A after
[image:42.595.136.503.514.730.2]Figure 34 tricuspid E velocity variation before and after thoracentesis
Figure 35 tricuspid A velocity variation before and after thoracentesis
0 10 20 30 40 50 60 70 80 90 100
1 4 7 10 13 16 19 22 25 28 31 34 37 40
tr ic u sp id E v e lo ci ty (c m /sec )
TRICUSPID E BEF
TRICUSPID E AFTER
0 20 40 60 80 100 120 140
1 4 7 10 13 16 19 22 25 28 31 34 37 40
tr ic u sp id A v e lo ci ty (c m /sec )
TRICUS A BEF
[image:43.595.135.498.509.735.2]Figure 36 pulmorary artery flow velocity variation before and after thoracentesis
Figure 37 aortic flow velocity variation before and after thoracentesis
0 20 40 60 80 100 120
1 3 5 7 9 111315171921232527293133353739
p u lm o n ar y ar te ry fl o w ve lo ci ty (c m /sec ) PUL BEF PUL AFTER -20 -10 0 10 20 30 40 50 60
1 3 5 7 9 111315171921232527293133353739
[image:44.595.138.497.527.728.2]Figure 38 mean respiratory variation across AV valves, pulmonary and aortic valve
Table 3 showing mean flow velocities across A-V valves and semilunar valves
before and after thoracentesis
Table 3
Parameter (Mean Respiratory
Variation)
BeforeThoracentesis Normal
Values
After Thoracentesis
Tricuspid E 45.04±10.4% <40% 32±11.3%
Tricuspid A 53.71±28% <40% 32.08±12.5%
Mitral E 32.30±12 %, <25% 19.78±7.8%
Mitral A 26±11.2% <25% 21±9.3%
Pulmonary artery 42.63±31.3% <10% 17.70±6.2%
Aorta 21.57±11.4% <15% 14.08±7.6%
0 10 20 30 40 50 60
mean respiratory variation before thoracentesis in cm/sec
Mean flow velocity respiratory variations, across tricuspid valve before
thoracentesis and after thoracentesis were E- 45.04±10.3, E - 32±11.3% (p value
< 0.001); A - 53.71±29%, A- 32.08±12.5% (p < 0.001); across mitral valve E -
32.30±12.7 %, E - 19.78±7.8% (p < 0.001); A - 26±11.2 %, A- 21±9.3% (p <
0.001); across pulmonary artery 42.63±31.3%, and 17.70±6.2% (p < 0.001);
across aorta 21.57±11.4% , 14.08±7.6 % (p < 0.001). The cut off values to
designate the respiratory variations in flow velocities as remarkable and
representative of cardiac tamponade, for mitral, tricuspid, pulmonary and aorta
[image:46.595.91.546.367.650.2]were >25%, >40%, >10%, >15% respectively.
Table 4
Mean N Standard
Deviation
Pair 1 Mitral E BTC 0.3230 40 0.127
Mitral E ATC 0.1978 40 0.077
Pair 2 Mitral A BTC 0.2597 40 0.1122
Mitral A ATC 0.2099 40 0.093
Pair 3 Tricuspid E BTC 0.4504 40 0.1035
Tricuspid E ATC 0.3199 40 0.1135
Pair 4 Tricuspid A BTC 0.5371 40 0.29
Tricuspid A ATC 0.3209 40 0.13
Pair 5 Pulmonary BTC 0.4263 40 0.31
Pulmonary ATC 0.1771 40 0.062
Pair 6 Aorta BTC 0.2157 40 0.11
Aorta ATC 0.141 40 0.075
BTC- before thoracentesis
Table 5
N Std. Error
Mean
Two tailed „P‟ value
Pair 1
Mitral E BTC 40 0.02
0.000 Mitral E ATC 40 0.01
Pair 2
Mitral A BTC 40 0.018
0.006 Mitral A ATC 40 0.014
Pair 3
Tricuspid E BTC 40 0.016
0.000 Tricuspid E ATC 40 0.018
Pair 4
Tricuspid A BTC 40 0.046
0.000 Tricuspid A ATC 40 0.02
Pair 5
Pulmonary BTC 40 0.050
0.000 Pulmonary ATC 40 0.01
Pair 6
Aorta BTC 40 0.02
0.000
Aorta ATC 40 0.012
From table 4, it is clear that the average respiratory variation across AV
valves, pulmonary valve, and aortic valve, before thoracentesis showed values
found in cardiac tamponade and after thoracentesis the values reduced to normal
range, which was statistically significant, implying that massive pleural effusion
Table 6
Mean N Std.
Deviation
Std. Error Mean
Two tailed
„P‟ value
Pair 1
SPO2 BTC 97.2609 40 1.3 0.25318 0.348
SPO2 ATC 98.2609 40 0.9 0.16890
Pair 2
PR BTC 101 40 4.8 0.75 0.000
PR ATC 93 40 3.52 0.56
Pair 3
SYS BP BTC 110 40 9.2 1.45 0.001
SYS BP ATC 114.4 40 7.64 1.20
Pair 4
DIA BP BTC 75 40 7.3 1.15 0.000
DIA BP ATC 78.6 40 4.56 0.72
BTC – before thoracentesis
ATC- After thoracentesis
From the table 5, it is clear that for Spo2, pulse rate, systolic and diastolic
blood pressure before and after thoracentesis, on correlation by statistical
Regarding chamber size changes before and after thoracentesis, the right
atrium, left atrium, left ventricle systolic and diastolic, right ventricle basal,
mid, base to apex, p values are 0.001, 0.0001,0.9, 0.0001,0.0056,0.0021,0.0003
respectively, which is depicted in tables 6 and 7.
Using Fisher’s exact test for statistical significance, there is no
significance for sidedness of pleural effusion on cardiac tamponade physiology
in our study and the sample population is also small, to represent a true
[image:49.595.90.555.343.669.2]validation.
Table 7
Mean N Std.
Deviation
Std. Error Mean
Pair 1 RA cm BTC 3.41 40 0.2179 0.034
RA cm ATC 3.33 40 0.1728 0.027
Pair 2 LA cm BTC 3.50 40 0.23 0.04
LA cm ATC 3.42 40 0.21 0.03
Pair 3 LV sys BTC 3.1 40 0.245 0.04
LY sys ATC 3.26 40 0.315 0.05
Pair 4 LV dias BTC 5.11 40 0.21 0.03
LV dias ATC 5.19 40 0.16 0.02
Pair 5 RV basal BTC 2.4 40 0.24 0.04
RV basal ATC 2.45 40 0.20 0.03
Pair 6 RV mid BTC 2.93 40 0.21 0.033
RV mid ATC 2.98 40 0.205 0.032
Table 8
N Sig.
Pair 1 RA cm BTC & RA cm ATC 40 0.000
Pair 2 LA cm BTC & LA cm ATC 40 0.001
Pair 3 LV sys BTC& LV sys ATC 40 0.0018
Pair 4 LV dias BTC & LV dias ATC 40 0.000
Pair 5 RV basal BTC & RV basal ATC 40 0.006
Pair 6 RV mid BTC& RV mid ATC 40 0.002
DISCUSSION
This study was undertaken to establish the concept of cardiovascular
hemodynamics alteration in massive pleural effusion, which could also be a
reason for breathlessness, in addition to ventilation perfusion mismatch.
Previous animal experiments and patient studies had proved the cardiac
tamponade physiology in massive pleural effusion, but with only a few
parameters analysed and with confounders like small pericardial effusion, as in
study by Traylor et al, it appears, therefore justified to make an attempt to rule
out all possible confounders and to invoke all possible parameters altered in
cardiac tamponade, to bring this concept to limelight.
In the study, out of 40 patients who had pleural effusion greater than ¾ of
a hemithorax, 32 were males and 8 were females. Bilateral pleural effusion was
found in 3 patients and of the remaining, 7 had left sided pleural effusion and 30
had right sided pleural effusion. Regarding etiology, in 25 cases it was due to
tuberculosis, in the remaining, 1 case had decompensated liver disease and rest
14 had lung malignancy. Traylor et al34had studied a total of 27 patients
dividing them into 2 groups, one with pleural effusion greater than ½ of
hemithorax and the other with pleural effusion less than half of a hemithoarax.
In our study, 50% of patients had elevated jugular venous pressure and
63% had clinical evidence of pulsus paradoxus, 100% of bilateral effusions
showed both, in comparison with Traylor et.al who had shown 36% in a group
In echo parameters, for cardiac tamponade, 15% of the patients had right
atrial collapse (which included 3 patients with bilateral pleural effusion, 2
patients with right sided pleural effusion, and 1 patient with left sided pleural
effusion). 85% of the patients had significant tricuspid flow velocity respiratory
variations, 80% had significant mitral flow velocity respiratory variations, 100%
had significant pulmonary artery respiratory flow variation, and 85% had
significant aortic flow velocity respiratory variation, all of which came to
normal values after thoracentesis with significant p value.
The amount of pleural fluid tapped ranged from 1750ml to 2500ml, after
which a repeat chest x ray was taken to assure that the pleural effusion remained
less than a ½ of a hemithorax and all the clinical and echo parameters measured
again within 24 hours. No chest tubes were placed for patients during study
period. In Traylor et al. the amount of pleural fluid ranged from 2,000 to 4,000
ml (mean 3,050).
In Traylor et al. both groups, one with pleural effusion greater than 1
hemithorax, and the other with effusion less than a hemithorax, some patients,
in addition, had small pericardial effusion, which could act as a confounder.
This cofounder was eliminated in this study right from beginning by excluding
patients with, even mild pericardial effusion from the study.
In this study, we had included other parameters, which could possibly be
affected by the pressure changes in the pleural cavity, pericardial cavity like
RV size at basal, mid septal level, and from base to apex,
LA size,
LV systolic dimension and
LV diastolic dimension.
From tables 7 and 8 it is clear that the parameters of cardiac chamber size of
both right and left side of the heart, had shown statistically significant alteration
with massive pleural effusion, before and after thoracentesis, reflecting that
pressure changes in pleural cavity due to massive pleural effusion are
transmitted to cardiac chambers through pericardium space, generating
respiratory flow velocity variations
On comparing, clinical parameters reflecting hemodynamic status like
SpO2, pulse rate, systolic blood pressure and diastolic blood pressure, before and
after thoracentesis of massive pleural effusion in the study there is a statistically
significant alteration in pulse rate, systolic blood pressure and diastolic blood
pressure.
Regarding sidedness of pleural effusion, and clinically detected evidence of
cardiac tamponade like elevated jugular venous pulse and pulsus paradoxus, in
our study, no statistically significant correlation was found and any conclusion
regarding sidedness of pleural effusion causing cardiac tamponade requires an
invasive study, measuring and correlating intra-pleural, intra-pericardial
pressure and cardiac chamber pressure to find out a plausible mechanism, to be
Even those patients who had massive pleural effusion without showing
tricuspid and mitral respiratory variation not amounting to cardiac tamponade
had their values well above the normal. This could be explained by the fact that
there are significant interindividual variation in the size of heart, lungs, pleural
cavities with their surrounding pleura, which determines the closeness contact
of the pleura and pericardium , which in turn determines the amount of area of
compression on the heart when the pleura is distended with pathological fluid
collection. Moreover unlike pneumothorax which uniformly increases pleural
pressure, pleural effusion creates a gradation in pleural pressure6, 7, due to the
dependency based distribution of fluid as well as the consistency of
accumulating fluid.
This concept can be made clearer still, by further studies with invasive
measurements correlating intra-pleural pressure, intra-pericardial pressure and
LIMITATIONS OF THE STUDY
1. Patients, who had significant respiratory flow variations across valves,
yet, not amounting to tamponade features clinically, could not be
explained clearly without invasive monitoring of pleural, pericardial and
cardiac chamber pressures.
2. The exact location and distribution of pleural effusion cannot be
ascertained only from chest x ray film, and needs a CT chest, which could
explain why some patients with relatively lesser quantity of pleural
effusion demonstrate remarkable tamponade physiology, whereas, some
with larger quantities does not, was not planned in this study.
3. Because of the small study group, effect of sidedness of pleural effusion
on cardiovascular hemodynamic alteration, could not be commented with
CONCLUSION
1. This study establishes that massive pleural effusion can have significant
hemodynamic impairment as evidenced by altered Doppler AV filling
profile.
2. Regarding sidedness of pleural effusion, there is no significant correlation
between side of massive pleural effusion and development of cardiac
tamponade physiology in this study.
3. There was no elevation of pulmonary arterial pressure in spite of
mechanical effect of pleural effusion over the lung vasculature.
4. We believe that one of the mechanisms of dyspnoea in massive pleural
REFERENCES
1. Wang JS, Tseng CH. Changes in pulmonary mechanics and gas exchange after thoracentesis on patients with inversion of a hemidiaphragm secondary to large pleural effusion. Chest 1995;107:1610-1614
2. Nishida O, Arellano R, Cheng DC, et al. Gas exchange and hemodynamics in experimental pleural effusion. Crit Care Med 1999;27:583-587
3. Agusti AG, Cardus J, Roca J, et al. Ventilation-perfusion mismatch in patients with pleural effusion: effects of thoracentesis. Am J RespirCrit Care Med 1997; 156:1205-1209.
4. Sonnenblick M, Melzer E, Rosin AJ. Body positional effect on gas exchange in unilateral pleural effusion. Chest 1983;83:784-786
5. Can Pleural Effusions Cause Cardiac Tamponade?*Hasan B. Alam, MD, Adam Levitt, MD, Robert Molyneaux, PA-C
6. Light RW. Physiological effects of pleural air or fluid. In: Light RW, Lee YCG, eds. Textbook of pleural diseases, Chapter 4. London: Arnold Publishers, 2003:45-55 7. Agostoni E, D'Angelo E. Thickness and pressure of the pleural liquid at various
heights and with various hydrothoraces. RespirPhysiol 1969;6:330-342
8. Vaska K, Wann LS, Sagar K, et al. Pleural effusion as a cause of right ventricular diastolic collapse. Circulation 1992;86:609;617
10.Appleton CP, Hatle LK, Popp RL. Cardiac tamponade and pericardial effusion: respiratory variation in transvalvular flow velocities studied by Doppler echocardiography. J Am Coll Cardiol 1988;11:1020-1030
11.Armstrong WF, Schilt BF, Helper DJ, et al. Diastolic collapse of right ventricle with cardiac tamponade: An echocardiographic study. Circulation. 1982;65:1491-1496 12.Anon Last's anatomy. London: Churchill Livingstone, 1990.
13.Wang N-S Anatomy and physiology of the pleural space. Clin Chest Med 1985; 6: 3– 16
14.Gray’sanatomy, from public domain published in 1858. 15.Richard .S. snell. Clinical anatomy by regions 8th edition
16.Physiology and pathophysiology of pleural fluid turnover. G. Miserocchi Eur Respir J., 1997; 10: 219–225
17.Basic Human Anatomy. A Regional Study of Human Structure. Ronan O'Rahilly, M.D. Fabiola Müller, Dr. Stanley Carpenter, Ph.D. Rand Swenson, D.C chapter 22. the pleurae and lungs
18.Yuji Saito, M.D., Ph.D., Amanda Donohue, D.O., Sherwin Attai, M.D., ArashVahdat, M.D., RamandeepBrar, M.D.,IroshanHandapangoda, B.A., and P. Anthony Chandraratna, M.D., F.R.C.P., The Syndrome of Cardiac Tamponade with ―Small‖ Pericardial Effusion ECHOCARDIOGRAPHY, Volume 25, March 2008
19.Spodick DH. The normal and diseased pericardium: current concepts of pericardial physiology, diagnosis and treatment.J Am Coll Cardiol 1983; 1:240-51
20.Spodick DH. Inferior vena cava plethoric with blunted respiratory response [letter]. J Am Coll Cardiol 1989; 13:1217-18
22.Shabetai R. Changing concepts of cardiac tamponade. J Am Coll Cardiol 1988; 12:194-95
23.Cogswell TL, Bernath GA, Keelan MH, et al. Laboratoryi nvestigation— cardiac tamponade: the shift in the relationship between intrapericardial fluid pressure and volume induced by acute left ventricular pressure overload during cardiac tamponade. Circulation 1986; 74:173-80
24.Spodick DH, Paladino D, Flessas AP. Respiratory effects on systolic time intervals during pericardial effusion. Am J Cardiol 1983; 51:1033-37
25.Spodick DH. Threshold of pericardial constraint: the pericardial reserve volume and auxiliary pericardial functions. J Am Coll Cardiol 1985; 6:296-99
26.Troughton RW, Asher CR, Klein AL: Pericarditis. Lancet 2004;363(9410):717–727 27.Maisch B, Seferovic PM, Ristic AD, et al: Guidelines on the diagnosis and
management of pericardial diseases executive summary; The Task force on the diagnosis and management of pericardial diseases of the European society of cardiology. Eur Heart J 2004;25(7):587–610
28.Wrisley D. Marked diastolic collapse of the right atrium without hemodynamic compromise caused by a large pleural effusion. J Am Soc Echocardiogr 1994 Jan-Feb;7(1):87-8
29.Venkatesh G, Tomlinson CW, O'Sullivan T, McKelvie RS. Right ventricular diastolic collapse without hemodynamic compromise in a patient with large, bilateral pleural effusions. J Am Soc Echocardiogr 1995 Jul-Aug;8(4):551-3
31.Gillam L, Guyer D, Gibson T, King M, Marshall J, Weyman A. Hydrodynamic compression of the right atrium: a new echocardiographic sign of cardiac tamponade. Circulation 1983;68:294–301
32.Picard MH, Sanfilippo AJ, Newell JB, Rodriguez L, Guerrero JL, Weyman AE. Quantitative relation between increased intrapericardial pressure and Doppler flow velocities during experimental cardiac tamponade. J Am Coll Cardiol. 1991 Jul;18(1):234-42
33.Kaplan LM, Epstein SK, Schwartz SL, Cao QL, Pandian NG. Clinical, echocardiographic, and hemodynamic evidence of cardiac tamponade caused by large pleural effusions. Am J Respir Crit Care Med 1995 Mar;151(3 Pt 1):904-8
34.Traylor JJ, Chan K, Wong I, et al. Large pleural effusions producing signs of cardiac tamponade resolved by thoracentesis. Am J Cardiol 2002;89:106;108
35.David R. Holmes JR, MD, Rick Nishimura, MD, Rebecca Fountain, RN, Zoltan G. Turi, MD, Iatrogenic Pericardial Effusion and Tamponade
PROFORMA
Age
Male
Female
Clinical parameters
Systolic blood pressure
Diastolic blood pressure
Elevated JVP
Pulsus paradoxus
Pulse rate
Respiratory rate
Spo2
Co-morbid conditions
Diabetes
Systemic hypertension
Renal failure
Tuberculosis
Malignancies
HIV
Heart failure
Constrictive pericarditis
ECHO PARAMETERS
Parameter Before
Thoracentesis
After Thoracentesis
Mitral A inspiration
Mitral A expiration
Mitral E inspiration
Mitral E expiration
Tricuspid A inspiration
Tricuspid A expiration
Tricuspid E inspiration
Tricuspid E expiration
Pulmonary flow velocity inspiration
Pulmonary flow velocity expiration
Aortic flow velocity Inspiration
Aortic flow velocity expiration
RA size
LA size
RV size base
RV size at mid-septal level
RV size base to apex
LV systolic dimension
MASTER CHART BEFORE THORACENTESIS # AG E SE X CAUSE SI D E J VP P ARAO DXUS
DIMENSIONS FLOW PARAMETERS
SPO 2 PR SYS B P DIA B P RA( CM ) L A( CM ) L V SYS L V DIA S RV B ASA L MID B AS E -AP E X MITRAL INFLOW (cm/s) TRICUSPID INFLOW (cm/s) PUL ART FLOW AORTIC FLOW E (I NSP) E (E XP ) A( INSP) A( E XP ) E (I NSP) E (E XP ) A( INSP) A( E XP )
INSP EXP INSP EXP
AFTER THORACENTESIS # AG E SE X J VP P ARAO DXUS
DIMENSIONS FLOW PARAMETERS
SPO 2 PR SYS B P DIA B P RA( CM ) L A( CM ) L V SYS L V DIA S RV B ASA L MID B AS E -AP EX MITRAL INFLOW (cm/s) TRICUSPID INFLOW (cm/s) PUL ART FLOW AORTIC FLOW E (I NSP) E (E XP ) A( INSP) A( E XP ) E (I NSP) E (E XP ) A( INSP) A( E XP )
INSP EXP INSP EXP