PATIENTS WITH HYPODIVERGENT, HYPERDIVERGENT AND
AVERAGE GROWTH PATTERNS”
A CEPHALOMETRIC STUDY
Dissertation Submitted to the
TAMILNADU DR. M.G.R.MEDICAL UNIVERSITY, CHENNAI
In partial fulfillment of the requirements for the degree of
MASTER OF DENTAL SURGERY
BRANCH -V
This is to certify that DR.SANTOSH REDDY.B, post graduate student(2008-2011)
in the Department Of Orthodontics & Dentofacial orthopedics , J.K.K.Nataraja Dental College,
Komarapalayam, Namakkal Dist – 638183, Tamilnadu. Has done the dissertation titled
“COMPARATIVE STUDY OF MANDIBULAR MORPHOLOGY IN
PATIENTS WITH HYPODIVERGENT, HYPERDIVERGENT AND AVERAGE GROWTH PATTERNS” A CEPHALOMETRIC STUDY
Under my direct guidance and supervision in the partial fulfillment of the regulations laid down
by
THE TAMIL NADU DR.M.G.R MEDICAL UNIVERSITY, CHENNAI,
for
M.D.S
BRANCH – ORTHODONTICS & DENTOFACIAL ORTHOPEDICS DEGREE
EXAMINATION.
It has not been submitted (partial or full) for the award of any other degree or diploma
.
Dr.T.P.SWAMY. M.D.S, Dr.Siva Kumar, M.D.S,
Professor& Head, Principal,
Department of Orthodontics J.K.K.Nataraja Dental College J.K.K.Nataraja Dental College Komarapalayam
Komarapalayam, Namakkal Dist – 638183, Namakkal Dist – 638183, Tamilnadu
ACKNOWLEDGEMENT
A sense of satisfaction is empowering my heart as my dissertation is getting materialized.
I feel a sense of gratitude towards all my mentors, peers and well wishers whom I wish to thank.
I bow my head in reverence to the “Lord Almighty” for the showers of blessings He has
bestowed on me without whom all this would have been an insurmountable task.
I have no words to express gratitude to my Parents for their never ending support,
encouragement and all the sacrifices they have made to make me what I am today.
I express my sincere thanks to my teacher Dr. T.P.SWAMY., M.D.S., Professor & HOD
Department of Orthodontics & Dentofacial Orthopedics, J.K.K.Nataraja. Dental College &
Hospital, Komarapalayam, for not only his everlasting inspiration, meticulous supervision
support and guidance.
I sincerely thank Dr.Siva Kumar., Principal, J.K.K.Nataraja. Dental College & Hospital,
Komarapalayam, for his kind help and encouragement provided during my postgraduate studies.
It is my pleasant privilege to thank my teachers, Dr. Neethika Mukhija, Dr. Kohila.K,
Dr.Arul Raj.S, Dr.Satheesh for their endless encouragement and esteemed expertise throughout
my postgraduate course. I remain grateful to them for their wholehearted support and kindness
extended.
A vote of thanks for Dr. Pranav Dhyani, HOD and Professor ,Department of Oral
Medicine & Radiology, J.K.K.Nataraja. Dental College & Hospital, Komarapalayam, for
rendering immense help during sample data collection.
My sincere thanks to my juniors, Dr. Muthu Kumar, Dr.Thiruvenkadam, Dr.Kumar .P,
I thank Mr. Tejaswi, Bangalore for his magnificent help for the statistical analysis.
1 | P a g e
Craniofacial Biology is the study of the “development, growth and
adaptation, both phylogenetically and ontogenetically, of the craniofacial skeleton and
related structures”
The condylar cartilage acts as a regional adaptive growth site during mandibular growth.
Absence of the condyles affects the amount of mandibular growth. Deviations in condylar
growth can affect facial esthetics. Mechanical compression induces chondrogenesis and
condylar growth. Masseteric resection in growing rats caused bradyauxesis of the
mandibular condyles, indicating that occlusal force may also affect condylar growth.
Occlusal force, maxillofacial morphology and mandibular condyle morphology seem to
influence each other, but the relationship between occlusal force and mandibular condyle
morphology has not been reported.
MANDIBULAR GROWTH
The mandible increases in size as a result of combined
endochondral ossification and bone remodeling throughout its surface, particularly along
its posterior border and buccal surface. Relative to itself (i.e., superimposed on stable
structures within the mandible), the mandible increases in length, height and width as a
result of expansion along its buccal surface and the entire posterior aspect of the ramus,
i.e., the mandible grows upward and backward. Because it is attached to the rest of the
cranium at its posterior-superior aspect, the temporomandibular joint, this upward and
backward growth of the mandible is expressed as a downward and forward displacement
relative to the cranium.
In this overall pattern, the growth of the mandible follows the growth of the
2 | P a g e
the normally growing face. However, the relative rate and amount of growth of the
maxilla and the mandible differ.
Geometrically, for every increment of maxillary growth, in a downward and
forward direction, the mandible must grow significantly more if it is to keep pace with the
midface.
The understanding of craniofacial growth is mandatory to diagnose the
problem, to better understand the etiology of the problem and to evaluate the
pre-treatment and post-pre-treatment changes. When comprehensive understandings of these
subjects are gained, favourable growth patterns will be identified and advantages will be
taken from it. Unfavorable growth patterns must also be assessed because their treatment
is more challenging.
The universally accepted orthodontic treatment goals of esthetics, health,
function and stability must also be maintained in treating patients with hypodivergent
and hyperdivergent growth pattern. Diagnosing a case with varied growth pattern requires
a thorough understanding of growth, growth rotations and morphology of skeletal
structures.
Facial growth relative to the cranial base line proceeds along a vector composed of
variable amount of horizontal forward growth and vertical downward growth.
For normal occlusion and facial harmony, all bones should grow in harmony to each
other. If a bone does not grow in harmony with the surrounding parts, some compensation
3 | P a g e
Sites where major increases in bone size occur during facial growth include the
sutures, the alveolar processes and the mandibular condyles. Consequently the growth of
mandible plays an important role in the facial growth and development.
Mandibular growth changes are essentially recorded at four growth sites of mandible
namely,
Condyle and ramus
Corpus
Anterior alveolar process
Posterior alveolar process.
Recently a great emphasis is placed on vertical dimensions of facial
morphology. The vertical development is related to many skeletal units such as
nasomaxillary complex, alveolar process and mandible.
The terms hypodivergent and hyperdivergent are used for describing the
vertical growth patterns of face. If condylar growth is greater than vertical growth in the
molar area, the mandible rotates counter-clockwise and results in a more horizontally
directed growth of the chin and less increase in anterior facial height, extremes of this
condition causing deep bites.
Conversely, if the vertical growth in the molar region is greater than that at the
condyles, the mandible rotates clock-wise, resulting in more anterior facial height and less
horizontal growth expression of the chin, tending to cause openbite.
The terms forward rotation & backward rotation, clockwise rotation &
4 | P a g e
Additional factors that influence craniofacial growth and the resultant facial
morphology includes – congenital defects , environmental defects at all stages of
development, predisposing metabolic conditions and diseases, nutritional deficiencies and
habits , altered muscle function as a result of tongue position , adenoid and tonsil size ,
breathing mode and tooth contacts in excursive mandibular positions.
Possibility of predicting the mandibular growth pattern by looking at specific
anatomic mandibular structures.
On the lateral cephalogram seven structural signs seen for the identification of the
mandibular growth rotation: 12
(1) Inclination of the condylar head.
(2) Curvature of the mandibular canal.
(3) Shape of the lower border of the mandible.
(4) Inclination of the symphysis.
(5) Interincisal angle.
(6) Interpremolar or intermolar angle.
(7) Anterior lower face height.
In the past, various attempts have been made to assess the reliability of mandibular
growth prediction using mandibular anatomic structures. Some authors could find an
association between the mandibular morphology and the future growth direction.
The ‘shape of the mandible’ is often used by clinicians as an aid in predicting
mandibular growth. Factors such as the size of the gonial angle, the inclination of the
condyle, the depth of the antegonial notch, and the morphology of the symphyseal region
have been associated by numerous investigators with the amount and direction of
subsequent growth. However, most of these studies have used conventional cephalometric
5 | P a g e
Structural signs of mandibular growth rotation are associated with
hyperdivergent or hypodivergent skeletofacial morphology. Furthermore, age related
changes in these structural signs have not been extensively studied.
In Dentofacial orthopedics a thorough knowledge of the skeletal and dental
components that may contribute to a particular malocclusion is essential because these
elements may influence the approach to treatment.
So, the present study attempts to relate hypodivergent, hyperdivergent average
growth patterns and to determine alterations in mandibular morphology that occurs as a
result of different vertical facial growth patterns in the local komarapalayam population.
There has been an interest in the multitude of differences in the diagnosis,
treatment and treatment response between hyperdivergent, hypodivergent, and average
6 | P a g e
AIMS AND OBJECTIVES
The present study was undertaken with the following aims and objectives:
1.
To evaluate the mandibular morphology in average growth pattern, hypo divergent
growth pattern, and hyper divergent growth pattern.
2.
To compare the mandibular morphology between
7 | P a g e
William gillmore (1950)1 conducted a study on 62 excellent occlusion cases and 67 class II cases in the age group of 16-42 years .The study concluded shorter mandible in
class II there was no difference in cranial base length and gonial angle in both types of
occlusions. Both occlusions maintained same relation with cranial base.
Ricketts (1960)4 in his article he stressed the need for more understanding of the application of cephalometrics in treatment planning. A cephalometric procedure was thus
shown to help establish the treatment goals for a particular case. Such terms as prediction,
projection, prognosis, estimation, and cephalometric setup had come to be related to
anticipation of the future behavior of an orthodontic case.
Garn, S.M. et al (1963)5 their study had reported that, symphyseal thickness was probably independent of the major mass of muscle action although an exact mode of
inheritance was not known. This study implied that the symphysis can be measured as a
separate unit which develops independently from other morphological expressions in the
same mandible.
Sassouni V, Nanda S (1964)6 in their study Eight persons with skeletal deep bite and eight persons with skeletal open bite were followed longitudinally from age of 6 years to
adulthood. In each type, the basic facial pattern was different. However, the intensity of
expression of each trait composing the openbite and deep bite was less marked at 6 year
level than adulthood. There were two significant differences with respect to the origin of
the mechanism of open bite versus deep bite. The position of condyle was higher in open
8 | P a g e
F. F Schudy (1964)7Conducted a study to find out the relationship between the posterior and anterior facial height. Author introduced the term facial divergence, and the terms
hyperdivergent and hypodivergent suggested as extreme facial divergence and he used
SN-MP angle as a measure of facial divergence .Study concluded high angle cases
showed low values for posterior to anterior height percentage.
Schudy FF (1965)8 conducted a study to initiate the purpose of documenting the growth changes, which produced rotation of mandible and to identify specific increments of
growth responsible. Study concluded, growth changes are interplay between vertical and
anteroposterior growth directions and also concluded that there was a difference of 11mm
in the nasion menton distance between retrognathic and prognathic type.
Creek more T.D. (1967)9 conducted a study to document how the vertical
growth was related to anterior and posterior growth. The untreated group consisted of 62
children with a mean age of 10-14 years, with a mean SN-MP angle of 33.77°. The
treated group consisted of 50 patients, 18 males and 32 females, with SN-MP angle
average of 31.57° Results showed that anteroposterior relation of maxilla to mandible
decreased as the face matured. Rotation of the mandible was the result of difference in
vertical growth at the condyle and total vertical growth in the molar region. Adaptability
of the alveolar processes was the compensating element that maintained the stability of
intercuspation.
Sassouni V, A(1969)10 on classification of facial types showed that 4 basic facial types could be defined 2 in anteroposterior and 2 in vertical dimension. There were other
9 | P a g e
multidimensional nature and are derived from the anteroposterior and vertical growth.
Various bones interact intimately during growth, increasing or masking initial
deformities.
Issacson JR, et al (1971)13conducted a study to examine the relationship between vertical parameters and mandibular rotation, and to examine extreme variations in facial
growth. Lateral cephalograms of 183 patients with SN-MP angles greater than 38 degrees
and of 60 patients with lesser than 26 degrees were selected and from these groups, 20
records were selected. Third group of 20 patients whose mandibular plane was recorded
at 32 degrees were selected. Cephalometric tracings were done and results showed that
high MP-SN angles resulted from relatively large amount of vertical alveolar growth, the
vertical length of upper and lower molars as well as anterior dental height. As teeth or
skeletal parts are located posteriorly, the MP-SN angle increased and with anterior
positioning, the angle decreased.
Nahoum HI.(1975)15 in his study the group with craniofacial malformations had slightly longer total facial height and palatal plane may be tipped upwards anteriorly so that upper
anterior face height was shorter and lower anterior face height was longer. Posterior
facial height was shorter than normal. An obtuse gonial angle was seen with a steep,
notched mandibular plane. Dentoalveolar height was normal except for mandibular molar,
which was significantly shorter.
Schendel SA, et al (1976)16carried out a study to distinguish between 2 groups of long face syndrome, with and without openbite. 31 patients of 17-25 years of age with vertical
10 | P a g e
included. 15 were openbite and 17 were non-openbite group. Cephalograms were used to
measure linear and angular measurements. Mandibular plane angle and posterior facial
height were greater in open bite group than non openbite group.
Issacson RJ, et al (1977)17 conducted a study to demonstrate jaw rotations and to explain how those rotations occurred. The study concluded that when the vertical growth at the
condylar- fossa area exceeded the vertical growth at the sutural–alveolar process area,
forward rotation occurred. When the amount of vertical growth at the alveolar process
was equal to the vertical growth at condyle, mandible had a parallel movement and when
vertical growth at alveolar process exceeded the vertical growth at condyles, backward
rotation occurred.
Isaacson R.J (1977)18carried out a study to determine whether the theory of archial growth of the mandible was clinically acceptable as a method of predicting mandibular
morphology and size. 8 patients 6 girls, 2 boys were selected and for them gold implants
were placed. Lateral cephalograms were taken and 6 year growth prediction using racial
methods was done. The results stated that racial method appears valid for prediction of
mandibular growth.
OpdebeeckH.1978)20 studied Lateral cephalograms of 27 untreated adult Caucasians. Some linear and angular parameters were compared to the Bolton standards. The short
face syndrome was a recognizable facial type with reduced lower face height, increased
ramus height, posterior maxillary height, and reduced SN-MP angle, and also showed
11 | P a g e
Opdebeeck H et al (1978)21conducted by tracing 27 lateral cephalograms of untreated adult Caucasians with reduced lower anterior face height and they were compared with 9
tracings of untreated adults of the same origin with increased lower anterior facial height.
The linear and angular measurements used suggested that long face syndrome was
attributed to clockwise rotation of mandible and short face syndrome attributed to
counterclockwise rotion of mandible.
Haskell B.S (1979)22study suggested that chin increased in size as mandibular type varied from vertical type to horizontal type of growth pattern. With vertical development
of the mandible, a smaller proportion of protruding chin was present. Chin increased in
size as mandibular basal arch form varied from tapered in vertical cases to more square in
horizontal cases.
R E Bibby (1979)23 study on lateral ceph of 144 males, 124 females and study concluded that female cranial dimensions were smaller than the corresponding males.Craniofacial
morphology in males and females appeared to be identical except in posterior facial
height. Male skulls were 8.5% larger than female skulls.
SAMIR.E.BISHARA (1981)24examined the changes in mandibular dimensions and relationship as they related to standing height. Subjects consisted of 20 males and 15
females’ ages between 8 and 17 years. Their study concluded
- The timing of mandibular changes in size and relationship were not correlated and
not accurately predictable, to the changes in standing height.
- There were significant changes in mandibular morphology between 8 and 17 years
- The presently available methods of prediction did not accurately determine which
12 | P a g e
might express one; it was still impossible to accurately estimate the timing as well
as the magnitude of the change.
- The changes in mandibular relationship in the premaximum, and the maximum
periods were of similar magnitudes clinically and statistically.
- The findings indicated that treatment of anteroposterior discrepancies should be
started as soon as the orthodontist believes that it is indicated.
Fields HW et al (1984)25carried out study to describe vertical facial morphology and to identify morphologic factors associated with long face syndrome. 42 children of 6-12
years old and 42 young adults with varied vertical types were examined clinically and
categorized into 3 vertical classifications- long, normal and short face. Lateral
radiographs were taken, 7 angular, 18 linear and 6 ratio measurements were calculated.
Results showed that for both long faced children and adults, anterior total face height,
mandibular plane angle, gonial angle, and mandibulopalatal plane angle were
significantly greater than normal. There was a tendency for long faced adults to have a
short rami.
Vibeke Skieller, Arne Bjork (1984)26did a study for predicting the amount of growth
rotation of the mandible on the basis of morphologic criteria observed on a single profile
radiograph at pubertal age. Conducted study in sample size of 21 in whom actual
mandibular growth rotation was determined from metallic implants over a 6 year period
at around the time of puberty. Changes in molar inclination, shape of lower border of
mandible and inclination of symphysis were observed. Intermolar angle tend to increase
in forward rotation of mandible and decreased in backward. Convex shape of lower
13 | P a g e
border observed in backward rotators. Forward growth rotation of mandible was
characterized by retroclination of symphysis irrespective of small or great mandibular
inclination and backward growth rotation was characterized by proclination of symphysis
and great inclination of mandible.
Henry w fields (1984)27conducted a study to
1) Describe facial morphology in long – normal and short faced children and long faced
normal adults
2) Identified morphological factors associated with clinical evaluation of the long faced
and normal subjects. Subjects for that study 42 children age of 6 to 12 years, 42 adults
Study concluded - Children with long face displayed steep mandibular plane, increased
PP-MP angle, no difference in size of the ramus or body of the mandible, larger gonial
angle.
Bishara et al (1985)28 compared the dentofacial relationships of three normal facial types (long, average, and short) between 5 years and 25.5 years of age both longitudinally and
cross-sectionally. The subjects consisted of 20 males and 15 females and found,
(1) There was a strong tendency to maintain the original facial type with age.
(2) Comparisons of the growth curves — with the exception of the incremental curves
for MP: SN and Pog:NB in males
— Consistently demonstrated parallelism of the curves, regardless of the facial type.
(3) The persons within each facial type expressed a relatively large variation in the size
and relationship of the various dentofacial structures.
(4) Significant differences in the dentofacial parameters were present between males and
14 | P a g e
(5) Longitudinal analysis of the data lend more consistent and therefore, more
meaningful results than cross-sectional comparisons when facial growth trends needed to
be evaluated.
Singer et al (1987)29 25 orthodontically treated patients with deep mandibular antegonial notch were compared with a similar group of 25 shallow notch subjects by the use of
longitudinal lateral cephalometric radiographs. Deep notch cases had more retrusive
mandibles with a shorter corpus, smaller ramus height, and a greater gonial angle than did
shallow notch cases. The lower facial height in the subjects with a deep mandibular notch
was found to be longer and both the mandibular plane angle and facial axis were more
vertically directed. The results of this study suggested that the clinical presence of a deep
mandibular antegonial notch was indicative of a diminished mandibular growth potential
and a vertically directed mandibular growth pattern.
Rodney s lee (1987)31 did a study on 21 implant subjects with extreme growth patterns against an alternative sample of 25 implant patients with less extreme facial patterns.
Mandibular plane angle, intermolar angle, symphysis inclination, facial height index
were used in this study. Study concluded that predicting future growth was highly
successful in extreme cases than normal cases. He advised orthodontist must continue to
rely more on clinical observations made during treatment than upon predictions made
using pretreatment records.
Nanda (1988)32did a study to examine the patterns of facial growth development in subjects with skeletal open-bite and skeletal deep-bite faces. Longitudinal data based on
15 | P a g e
were used. It was established that the anterior dimensions of the face demonstrated
divergent patterns of development in open and deep-bite faces. The posterior dimensions
of the face did not discriminate between those two typological groups. The female
open-bite subjects were earliest in the timing of the adolescent growth spurt, followed in
succession by deep-bite female subjects, open-bite male subjects and finally the deep-bite
male subjects.
P.A. Cook et al (1988)33The tracing errors associated with the structures used in Bjork’s method of mandibular superimposition was investigated using multiple tracing of 50
lateral cephalometric radiographs. The horizontal error levels were much less than the
vertical, midline structures more reliable than bilateral structures and the lower third
molar tooth germ more reliable than the inferior dental canal.
Luc P.M. Tourne (1990)35Experimental evidence suggested that altered
muscular function can influence craniofacial morphology. The switch from a nasal to an
oronasal breathing pattern induces functional adaptations that included total anterior
facial height and vertical development of the lower anterior face.
Halazonetis et al (1991) 36A study was done to provide quantitative data at the period around the pubertal growth spurt and to test the hypothesis that early mandibular shape
may influence the amount and direction of subsequent mandibular growth. Longitudinal
data from lateral cephalograms were used. The shape of the mandible showed a slight
difference between sexes and this difference increased after the pubertal growth spurt.
Significant changes in mandibular shape during growth— especially after the pubertal
16 | P a g e
mandibular outline was moderately to highly correlated to the variables indicating
mandibular and ramus inclination but poorly correlated to variables indicating
anteroposterior jaw relationship
Tuomo kantomaa et al (1991)37Origin of condylar cartilage is not periosteal like that of other secondary cartilages; this cartilage originates from its own cellular blastema.
Proliferation cells of the condylar cartilage are multipotential, they switch their
differentiation pathway in the direction of osteoblasts in the absence of function and
growth of cartilage ceases. This regulation of differentiation was mediated by maturation
of cartilage cells. Cyclic AMP and Ca were important mediators in that process
Baumrind et al (1992)38did a study to evaluate the proportion of external chin in relation to symphyseal area in normal jaws and in those with diverse morphology was done.
subjects were selected on the basis of normal growth, horizontal and vertical growth.
Lateral and frontal radiographs were taken to analyze the general mandibular form and to
determine the percentage of external / total symphyseal area. The mean displacement of
gonion was in an upward and backward direction at an angle of approximately 45° to the
Frankfort plane. Mean displacements at menton and pogonion were in a downward and
backward direction but were very small. Mean displacement at point B was somewhat
greater than that of menton and gonion, oriented in an upward and backward direction
Urban Hagg et al (1992)39In his study showed clearly that the mandibular growth was more pronounced when the scientific method (Bjork) was applied in comparison with the
three standard cephalometric methods. Standard cephalometric methods did not express
17 | P a g e
the reliability estimate of mandibular growth by means of standard cephalometric method
seems to decrease with age.
Aki T, Nanda et al (1994)40 conducted a study to determine whether symphysis could be
used as predictor of the direction of mandibular growth. Symphyseal dimensions studied
were height, depth, ratio and angle. It was shown that symphysis morphology was
associated with direction of mandibular growth. Mandible with anterior growth direction
was associated with small height, large depth , small ratio and large angle of symphysis.
Posterior growth ofmandible was associated with a large height, small depth, large ratio
and decreased angle of symphysis.
Tor karlsen et al (1995)41Craniofacial growth was followed longitudinally in two groups of boys with low and high MP-SN angles. Group differences in dimensional changes
were explained by a difference in matrix rotation of mandibular corpus, especially in the
6-12 year period. In the 12-15 year period, matrix rotation was similar in the two groups
and so were dimensional changes. Morphologically, dimensional group differences in
6-12 year period were theoretically compatible with the fact that mandibular rotation was
clearly more forward in the low angle than in the high angle group
Lambrechts, Harris et al (1996)42conducted a study to observe the dimensional differences in the craniofacial morphologies of groups with deep and shallow mandibular
notching. 40 lateral cephalograms of untreated subjects with shallow mandibular notches
and 40 subjects with deep notches. The study concluded that subjects with shallow
mandibular notches revealed mandibular planes that were more horizontal, chins that
18 | P a g e
posterior ramus notch depths, and smaller occlusal plane inclinations than did deep
antegonial notch subjects .
Clifford .p. singer (1996)43 Conducted a study in 25 orthodontically treated deep
mandibular notches and compared with a similar group of 25 shallow notch group
subjects. Study concluded that the lower facial height in the subjects with deep
mandibular notches was found to be longer and mandibular plane angle was more
vertically directed. Deep mandibular antegonial notch is an indication of diminished
mandibular growth potential and a vertically directed mandibular growth potential.
Gail burke, Paul major et al(1998)44 carried out study to determine the correlation between the condylar characteristics measured from pre-orthodontic tomograms of
preadolescents and their facial morphologic characteristics. The study concluded that
condylar head inclination and superior joint space proved to be the most significantly
correlated condylar characteristics to facial morphology. Patients with vertical facial
morphology displayed decreased superior joint spaces and posteriorly angled condyles,
whereas, patients with horizontal facial morphology demonstrated increased superior joint
space and anteriorly angled condyles.
Masahiro tsunori (1998)45 did a study to evaluate the relationship between mandibular body tooth inclination, cortical bone thickness and facial types. Material for this study
consisted 39 dry skulls, lateral cephalogram and 4 CT’s obtained for every skull. Study
concluded that long face patterns included narrow arches because of narrow mandible and
width of arches were smaller than short face subjects. Buccal Cortical bone thickness was
19 | P a g e
Short face subjects showed flat mandibular plane, lesser gonial angle, long mandible and
shorter lower anterior facial height.
Laurel R.leslie et al(1998)46conducted study to assess the method proposed by
Skieller,Bjork,and Linde- Hansen in 1984 to predict mandibular growth, results were comparable to the Skieller value of 86%,and this method does not permit clinically useful
predictions to be made in general population relative to the direction of future
mandibular growth rotation
Andrew Girardot (2001.)48conducted a study to compare the condylar position in hypodivergent facial skeletal types, which concluded that the amount of condylar
movement from the upward and forward position to the intercuspal position and it was
measured. It was hypothesized that hyperdivergent group would exhibit greater condylar
displacement than the hypodivergent group
A.B.M Rabie (2002)49 designated a study to identify series of factors regulating condylar growth. Study conducted on 115 Sprague dawley rats, 35 days old.
Immunostaining was used to identify those factors in protein level. Study concluded that
Sox 9 factor which is expressed by cells in proliferative layer regulates condylar growth.
Ronald p. kolodziej, et al (2002)50Conducted a study to test the hypothesis that the antegonial notch depth was a useful predictor of facial growth. Study concluded that
20 | P a g e
sufficiently indicate future facial growth to warrant its application as growth predictor in
non extreme population.
Julia von Bremen, Hans pancherz et al (2005)51conducted study to apply Bjorks structural signs of mandibular growth rotation to assess the hypodivergency or
hyperdivergency of mandible. 135 lateral cephalograms of subjects were collected, out
of which 95 subjects exhibited large and 40 subjects exhibited small mandibular plane
angle. There was no association between the degree of hypo/ hyperdivergency or the age
of the subject’s .However hypodivergency was recognized more easily than
hyperdivergency.
Herbert A klontz (2006)52The skeletal pattern of the high angle patient was generally a result of a multifactorial problem. Bjork stated that people who have long anterior facial
heights were backward rotators. The indicators for these were straight condylar head,
straight mandibular canal, notched inferior border of mandible, forwardly sloping
mandibular symphysis.
Aya Kurusu; Mariko Horiuchi et al (2009)53did a study to clarify the relationship between occlusal force and mandibular condyle morphology using clinical data. The
subjects were 40 female patients with malocclusion. The mandibular condyle morphology
was assessed by using limited cone-beam CT imaging. The maximum occlusal
force was calculated by using pressure-sensitive films. Moreover, condylar length was
significantly correlated with the occlusal plane angle to the FH, the mandibular plane
angle to the FH, the ramus inclination, and the posterior facial height (S-Go).
21 | P a g e
METHODOLOGY
For the present study, a sample of 60 randomly selected adult female patients with an age
above 18 years were selected from department of Orthodontics, J.K.K. Nataraja dental
college & hospital, Komarapalayam, Namakkal Dist . Ethical clearance was obtained
from the institution.
Criteria for selection of patients;
No severe craniofacial disorders
No history of previous orthodontic treatment.
No missing maxillary and mandibular first molar and anterior teeth.
60 patients in the age group range 18 years and above were selected.
Source of data:
The study was performed on the basis of standard lateral cephalograms of the patients and
the cephalograms were traced. Cephalometric measurements were carried out manually
using Bjork signs.
METHOD
Materials for radiographs:
Lateral cephalograms to evaluate the dentoskeletal features.
For exposing lateral cephalometric radiograph
8x10” Kodak film
8x10” cassette with Kodak intensifying screens
22 | P a g e
CEPHALOMETRIC TECHNIQUE
Standardization and accuracy in relationship of the tube head to cephalostat were
most important.
Standard lateral cephalograms were taken with the target film distance 17.14cm,
73 KVp, 15ma and 9.4 seconds exposure time.
Preparation of the patient-
Patient was instructed to remove all removable dental prosthesis and metallic
objects such as glasses and jwellery from the head and neck region.
Patient stood with her face towards the front.
Ear plugs were inserted into the external auditory canals.
Localizer was switched on to position the patient’s head according to the FH.
Localizer switched off after approx 100sec or as soon as the exposure started.
Patient head was tilted or raised until it was positioned correctly.
Adjusting the nose support –
The nose support was folded down.
Nose support was pushed to the nasal root.
The diaphragm and sensor move all the way to front and into the starting position for scanning
Exposure was released.
Exposure was made with the teeth in complete centric occlusion; the lips were in relaxed
23 | P a g e
TRACING - Equipment and material necessary for tracing included a view box, with variable light intensity; 0.003-inch thick trace acetate with one matte surface, a millimeter
ruler; protractor, two draftsman’s triangles and a well sharpened medium hard pencil. The
matte acetate was customarily attached to the film with two small pieces of masking tape
along one side.
Reduced room illumination helped in accurately locating the landmarks.
Accuracy and consistency in tracing technique was essential so tracing was always
carried out by the same operator.
Method of collection of data: Sample consisted of randomly selected 60 adult female
patient records, which included pre-treatment lateral cephalometric radiographs of all
these patients.
According to Bjork Subjects were divided into 3 groups with regard to SN-GoGn angle.
¾ Hypodivergent group with SN-GoGn angle less than 28degrees.
¾ Average group with SN-GoGn angle between 28-32degrees.
¾ Hyperdivergent group with SN-GoGn angle greater than 32 degrees.
Bjork seven signs used in this study to evaluate mandibular morphology are:
¾ Inclination of condylar head
¾ Curvature of mandibular canal
¾ Shape of lower border of the mandible ¾ Inclination of symphysis
¾ Inter-incisal angle
24 | P a g e
POINTS USED IN THIS STUDY
(Fig 1)Anterior Nasal Spine [ANS] 55: point ANS is the tip of the bony anterior nasal spine as seen the lateral cephalogram.
Anterior convex point (ACP) 50 - point of greatest convexity along the anterior- inferior border of mandible
Gonion [Go] 55: a constructed point, the intersection of lines tangent to the posterior margin of the ascending ramus and the mandibular base.
Inferior gonion (IGo) 50 – point of greatest convexity along the posterior – inferior border of the mandible
Menton [Me] 55: is the most inferior point on the outline of the symphysis as seen on the lateral cephalogram.
Orbitale [Or] 55: most inferior on the infra – orbital margin
Pogonion [Pog] 55: most anterior point on the bony chin as seen on the lateral cephalogram.
Point B [Supramentale] 55: It is the most posterior point in the outer contour of the mandibular alveolar process.
Porion [Po] 55: ‘anatomic porion’ is the outer upper margin of the external auditory canal, Machine porion’’ is the upper most point on the outline of the metal rings on the ear rods
25 | P a g e
POINTS USED IN THIS STUDY
26 | P a g e
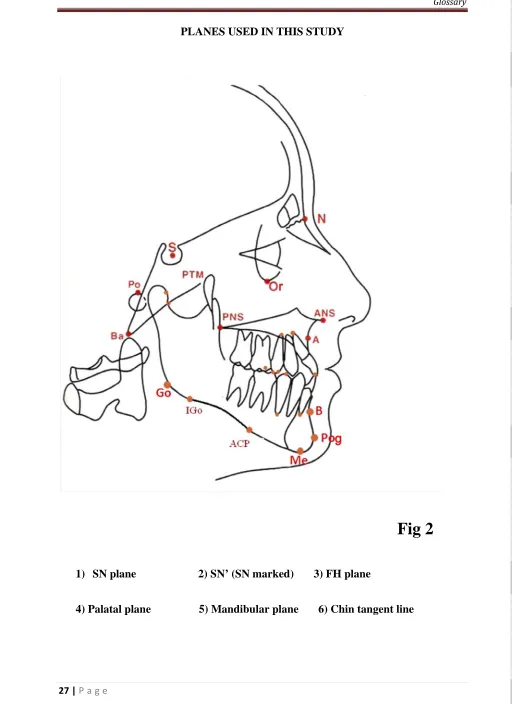
PLANES USED IN THIS STUDY (Fig 2)
1) S-N plane 56– Sella– nasion anteroposterior extent of anterior cranial base
2) SN marked (SN’)41 – sagittal axis was constructed through at an angle of 8° to t he SN line
3) Frankfort horizontal plane [FH] 56: A line connecting point’s porion to Orbitale.
4) Palatal plane [ANS-PNS] 56: A line connecting the anterior nasal spine of the maxilla and posterior nasal spine of the palatine bone.
5) Mandibular plane [MP] 56: A line connecting points Gonion and menton.
27 | P a g e
PLANES USED IN THIS STUDY
Fig 2
1) SN plane 2) SN’ (SN marked) 3) FH plane
4) Palatal plane 5) Mandibular plane 6) Chin tangent line
1
3
2
4
[image:31.612.52.565.49.753.2]
28 | P a g e
ANGULAR MEASUREMENTS USED IN THIS STUDY ( Fig 3)
1) Condylar head inclination44 –Angle between lines represent anterior cant of the condylar head and line perpendicular to Frankfort horizontal plane.
2) Symphysis inclination26 – Angle between chin line and SN plane
3) Inter molar angle (IMA): A vertical line drawn from the mesiobuccal cusp of upper first molar to the palatal plane and connecting the line joining the
mesiobuccal cusp of lower first molar to the mandibular plane.
4) Inter premolar angle (IPA) Angle between long axis of upper and lower 2nd pre molar
5) Inter incisal angle (IIA) 56: A line drawn through the long axis of the upper central incisor and the lower central incisor. The intersecting angle was taken.
6) Mandibular plane angle (SN-MP) – Angle formed between the SN plane to MP plane
29 | P a g e
ANGULAR MEASUREMENTS USED IN THIS STUDY (Fig 3)
Fig 3
1) Condylar inclination 2)symphysis inclination
3) Intermolar angle 4) Interpremolar angle
5) Inter incisal angle
1
2
3 4
30 | P a g e
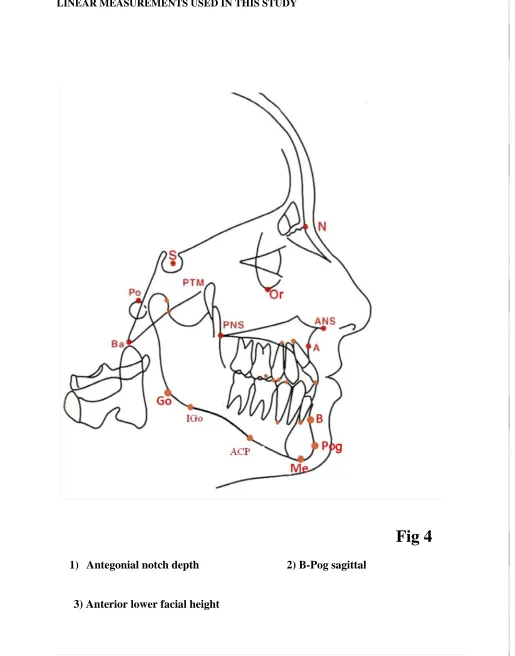
LINEAR MEASUREMENTS USED IN THIS STUDY ( Fig 4)
Ante gonial notch50: antegonial notch depth as measured from greatest point of convexity in antegonial notch to line connecting anterior convex point with inferior
gonion.50
B-Pog sag41 – sagittal distance between B-point and pogonion on to SN marked. An expression of the inclination of the symphysis
Anterior lower facial height (ALFH) – distance measured from ANS and Me
31 | P a g e
LINEAR MEASUREMENTS USED IN THIS STUDY
Fig 4
1) Antegonial notch depth 2) B-Pog sagittal
3) Anterior lower facial height
1
2
[image:35.612.54.569.77.733.2]32 | P
P a g e
AVARAG
GE GROWT
COLO
TH PATTER
OUR PLATE
RN WITH T
E NO-1
TRACING
33 | P
P a g e
HYP
PODIVERG
GENT GRO
COLO
OWTH PAT
UR PLATE
TTERN WI
E NO - 2
TH TRACI
ING
34 | P
P a g e
HYP
PER DIVER
RGENT GR
ROWTH PA
COLOUR P
ATTERN W
PLATE NO
WITH TRAC
- 3
CING
35 | P
P a g e
ORTHO
COLOU
OPHOS XG
UR PLATE
5DS/CE
36 | P
COL
P a g e
LOUR PLAT
FRONT V
TE NO -5
VIEW
PATI
PATIEN
ENT IN
NT POSITIO
SITU
ONING
37 | P a g e
HYPODIVERGENT GROWTH PATTERN
SL
NO
NAME
MP
GO‐ME
INCLINATIN OF CONDYLAR HEAD ANTE GONIAL NOTCH SYMPHYSIS INCLINATIO N INTER INCISAL ANGLE INTER MOL AR ANGL E INTER PRE MOLAR ANGLE ALFH
1 GOPIKA 27° 8° 1mm 89°,2mm 120° 162° 173° 69mm
2 BANU
PRIYA
27° 9° 1mm 90°,3mm 108° 157° 160° 68mm
3 RAJESHWARI 23° 7° 0mm 97°,5mm 90° 155° 159°
67mm
4 HARI PRIYA 20° 10° 0mm 115°,3mm 94° 166° 160°
58mm
5 MUMTHA 24° 9° 0mm 98°,6mm 104° 166° 171° 68mm
6 RAMYA 26° 13° 1.5mm 94°,5mm 109° 157° 174° 74mm
7 NIVETA 27° 9 2mm 94°,4mm 112° 160° 170° 66mm
8 SUJITHA 25° 12° 0mm 87°,3mm 132° 165° 166° 68mm
9 HEMA
LATHA
25° 17° 1mm 95°,3mm 120° 160° 175° 69mm
10 POONZH
LAALI
22° 17° 0mm 98°,4.5mm 125 166 169° 64mm
11 THIRUMALAR 18° 7° 0mm 105°,5.5mm 117° 164° 166°
61mm
12 ASHWINYA 27° 10° 2mm 84°,1mm 109° 160° 165° 70mm
13 PRIYA 27° 14° 2mm 86°,2mm 128° 163° 164° 66mm
14 SALINI 24° 17° 2mm 94°,4mm 116° 164° 171° 57mm
15 RAJESHWARI 21° 13° 3mm 100°,4.5mm 103° 160°
157° 65mm
16 SANGEETA 26° 12° 0mm 85°,2mm 113° 165° 173° 62mm
17 RETHIKA 27° 8° 2.5mm 89°,2mm 102° 152° 170° 77mm
18 KOWSALYA 25° 13° 1mm 95°,3mm 120° 160° 171° 68mm
19 PRIYA 24° 9° 0mm 98°4mm 104° 166° 175° 68mm
38 | P a g e
AVERAGE GROWTH PATTERN
SL
NO
NAME
MP
(GO‐ME)
INCLINATIN OF CONDYLAR HEAD ANTE GONIAL NOTCH SYMPHYSIS INCLINATION INTER INCISAL ANGLE INTER MOLAR ANGLE INTER PRE MOLAR ANGLE ALFH
1 SARANYA 30° 8° 2mm 81°,1mm 86° 160° 161° 63mm
2 KIRUTHIGA 29° 18° 2mm 91°,2.5mm 133° 160° 161° 57mm
3 SWATHI 30° 7° 2mm 89°,2mm 130° 157° 166° 74mm
4 ABIRAMI 30° 9° 1mm 78°,1mm 103° 155° 167° 69mm
5 PRIYANGA 31° 11° 0mm 88°,2mm 114° 154° 162° 69mm
6 PRAVEENA 32° 12° 1mm 85°,1mm 95° 153° 159° 65mm
7 PRABA 31° 8° 0mm 75°,1mm 108° 160° 158° 70mm
8 AARTHI 29° 8° 2mm 90°,2mm 104° 159° 165° 64mm
9 MAHA
LAKSHMI
32° 7° 1mm 96°,4mm 103° 152° 168° 61mm
10 SALINI 30° 10° 1mm 93°,3mm 112° 158° 163° 70mm
11 PADMINI 32° 7° 2mm 78°,0mm 107° 159° 162° 66mm
12 FOUZIA 31° 5° 2mm 84°,1mm 110° 159° 176° 59mm
13 ANU
BARATHI
29° 5° 1mm 88°,2mm 124° 156° 162° 65mm
14 POOVJA 32° 5° 1mm 82°,2mm 113° 155° 155° 82mm
15 SELVA
NAYAKI
29° 5° 2mm 70°,‐2mm 104° 162° 165° 65mm
16 RAMYA 30° 6° 1mm 83°,1mm 118° 156° 162° 72mm
17 KALAI
VANI
32° 6° 1mm 84°,2mm 117° 157° 162° 70mm
18 MOHANA
BIHAM
31° 6° 1mm 84°,0mm 109° 163° 163° 71mm
19 NIRMALA 31° 8° 1mm 79°,1mm 104° 155° 170° 67mm
39 | P a g e
HYPERDIVERGENT GROWTH PATTERN
SL
NO
NAME MP
(GO‐ME)
INCLINATIN OF CONDYLAR HEAD ANTE GONIAL NOTCH SYMPHYSIS INCLINATION INTER INCISAL ANGLE INTER MOLAR ANGLE INTER PRE MOLAR ANGLE ALFH
1 DIVYA
BHARATHI
43° 6° 1.5mm 77°,1mm 120° 142° 159° 89mm
2 KRISHNA
VENI
36° 4° 0mm 87°,0mm 123° 149° 155° 79mm
3 VISHNAVI 34° 8° 2mm 68°,‐3mm 97° 154° 154° 64mm
4 VIKASHINI 42° 6° 2.5mm 74°,1mm 108° 144° 160° 75mm
5 SHARMILA 40° 2° 2.5mm 80°,1mm 87° 148° 162° 73mm
6 AMBIKA 35° 5° 2mm 76°,‐1mm 95° 152° 176° 55mm
7 PUNITHA 38° 4° 1mm 77°,0mm 108° 149° 154° 80mm
8 SARNYA 36° 5° 2mm 85°,1mm 109° 152° 140° 70mm
9 DEVIKA 36° 5° 1.5mm 80°,0mm 87° 159° 157° 72mm
10 RAMYA 42° 7° 3mm 67°,‐1mm 104° 145° 147° 77mm
11 SABARI 33° 10° 3.5mm 85°,2.5mm 130° 160° 160° 72mm
12 LIJITHA 35° 5° 0mm 71°,‐2mm 109° 145° 160° 76mm
13 LEEMA 39° 6° 1mm 80°,0mm 97° 145° 160° 71mm
14 NITHYA 37° 14° 0mm 85°,2mm 115° 152° 157° 67mm
15 KALAMANI 43° 8° 0mm 80°,0.5mm 95° 136° 160° 87mm
16 DEVAKI 41° 3° 2mm 78°,1mm 109° 150° 170° 71mm
17 MUTHU
LAKSHMI
37° 6° 1mm 84°,0mm 95° 144° 156° 85mm
18 MENAKA 40° 8° 2mm 76°,0mm 82° 146° 168° 73mm
19 RAJANI 36° 5° 0mm 90°,2mm 120° 148° 166° 72mm
20 KIRUTHIGA 42° 6° 2mm 92°,2mm 108° 145° 168° 75mm
40 | P a g e
NULL HYPOTHESIS:
There was no significant difference in the mean values of the three
groups i.e. µ
1= µ
2= µ
3ALTERNATE HYPOTHESIS:
There was a significant difference in the mean values of the
three groups i.e. µ
1≠
µ
2≠
µ
3LEVEL OF SIGNIFICANCE:
α
=0.05
STATISTICAL TECHNIQUE USED:
Analysis of Variance (ANOVA).
DECISION CRITERION:
The decision criterion was to reject the null hypothesis if the
p-value was less than 0.05 otherwise we accepted the null hypothesis.
If there was a significant difference between the groups, we carried out multiple comparisons
(post-hoc test) using Bonferroni test.
41 | P a g e
ANALYSIS OF MANDIBULAR PLANE ANGLE ( SN – MP(GO-ME):
TABLE -1
Group Mean
Std
dev
Min
Max
F
P-Value
Significantly
different
from
i)Hypodivergent 24.60° 2.64° 18° 27°
152.845 <0.001*
ii, iii
ii)Hyperdivergent 38.25° 3.18°
33°
43°
i,
iii
iii)Average
30.50°
1.15°
29°
32°
ii, iii
*denotes significant difference
Higher mean MP (GO-ME)
wasobserved in hyperdivergent group followed by average and
hypodivergent group respectively. The difference in mean MP (GO-ME) between the three
groups
wasfound to be statistically significant (P<0.001). The difference in mean MP
(GO-ME) between hypodivergent and hyperdivergent group as well as between hypodivergent &
average group is found to be statistically significant. Also, the difference in mean MP
(GO-ME) between hyperdivergent and average group
wasalso found to be statistically significant.
GRAPH - 1
0 5 10 15 20 25 30 35 40 45
Hypodivergent Hyperdivergent Average
Mean MP in the three groups
42 | P a g e
ANALYSIS OF CONDYLAR INCLINATION:
(Note: Kruskal-Wallis test has been used here as the data did not follow normal distribution)
TABLE - 2
Group Mean
Std
dev
Min Max
Kruskal-Wallis Chi-sq
P-Value
Significantly
different
from
(i) Hypodivergent 11.50° 3.03°
7°
17°
25.182 <0.001*
ii, iii
(ii)Hyperdivergent 6.20° 2.63° 2°
14°
i,
iii
(iii) Average
7.90°
3.09°
5°
18°
ii, iii
*denotes significant difference
Higher mean condylar inclination
wasobserved in hypodivergent group followed by average
and hyperdivergent group respectively. The difference in mean condylar inclination between
the three groups
wasfound to be statistically significant (P<0.001). The difference in mean
condylar inclination between hypodivergent and hyperdivergent group as well as between
hypodivergent & average group
wasfound to be statistically significant. Also, the difference
in mean condylar inclination between hyperdivergent and average group
wasalso found to be
statistically significant.
GRAPH - 2
0 2 4 6 8 10 12 14
Hypodivergent Hyperdivergent Average
Mean condylar inclination in the three groups
43 | P a g e
ANALYSIS OF ANTEGONIAL NOTCH:
TABLE -3
Group Mean
Std
dev
Min
Max
Kruskal-Wallis Chi-sq
P-Value
(i) Hypodivergent
1.05mm 1.01mm 0.58mm 1.52mm
4.029 0.133
(ii) Hyperdivergent 1.68mm .99mm 1.21mm 2.14mm
(iii) Average
1.13mm 1.09mm 0.62mm 1.63mm
Higher mean antegonial notch
wasobserved in hyper divergent group followed by average
group and hypodivergent group respectively. The difference in mean antegonial notch
between the three groups
wasnot statistically significant (P>0.05).
GRAPH - 3
0.00 0.20 0.40 0.60 0.80 1.00 1.20 1.40 1.60 1.80
Hypodivergent Hyperdivergent Average
Mean
Mean antegonial notch in the three groups
44 | P a g e
ANALYSIS OF SYMPHYSIS INCLINATION (degrees):
TABLE 4
Group Mean
Std
dev
Min
Max
F
P-Value
Significantly
different
from
(i) Hypodivergent
94.15°
7.37°
84°
115°
23.798 <0.001*
ii, iii
(ii)Hyperdivergent 79.60° 6.75°
67°
92°
I
(iii) Average
84.15°
6.31°
70°
96°
I
*denotes significant difference
Higher mean symphysis inclination
wasobserved in hypodivergent group followed by
average and hyperdivergent group respectively. The difference in mean symphysis
inclination between the three groups
wasfound to be statistically significant (P<0.001). The
difference in mean symphysis inclination between hypodivergent and hyperdivergent group
as well as hypodivergent and average group
wasfound to be statistically significant. No
statistically significant difference
wasobserved between average group and hyperdivergent
groups.
GRAPH - 4
70 75 80 85 90 95 100
Hypodivergent Hyperdivergent Average
Mean
Mean Symphysis inclination in the three groups
45 | P a g e
ANALYSIS OF SYMPHYSIS INCLINATION (mm):
TABLE - 5
Group Mean
Std
dev
Min
Max
F
P-Value
Significantly
different
from
(i)Hypodivergent 3.48mm 1.34mm
1.0mm 6.0mm
29.617 <0.001*
ii, iii
(ii)Hyperdivergent 0.30mm 1.39mm
-3.0mm 2.5mm
i,iii
(iii) Average
1.38mm 1.24mm
-2.0mm 4.0mm
i,
ii
*denotes significant difference
Higher mean symphysis inclination
wasobserved in hypodivergent group followed by
average and hyperdivergent group respectively. The difference in mean symphysis
inclination between the three groups
wasfound to be statistically significant (P<0.001). The
difference in mean symphysis inclination between hypodivergent and hyperdivergent group
as well as between hypodivergent & average group
wasfound to be statistically significant.
Also, the difference in mean symphysis between hyperdivergent and average group
wasalso
found to be statistically significant.
GRAPH - 5
0.00 0.50 1.00 1.50 2.00 2.50 3.00 3.50 4.00
Hypodivergent Hyperdivergent Average
Mean
Mean Symphysis inclination (mm) in the three groups
46 | P a g e
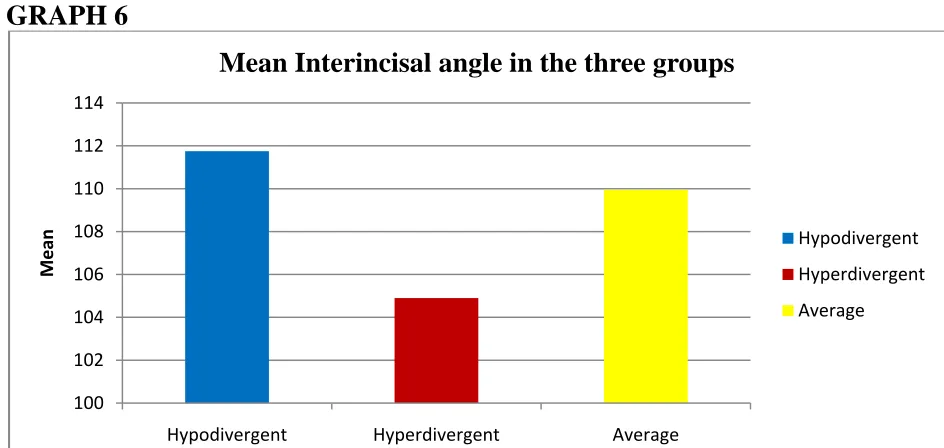
[image:50.612.87.559.312.536.2]ANALYSIS OF INTERINCISAL ANGLE:
TABLE - 6
Group Mean
Std
dev
Min
Max
F
P-Value
(i) Hypodivergent 111.75° 10.80°
90°
132°
1.865 0.164
(ii)Hyperdivergent 104.90° 12.94°
82°
130°
(iii) Average
109.95° 11.03°
86°
133°
Higher mean interincisal angle
wasobserved in hypodivergent group followed by average
and hyperdivergent group respectively. The difference in mean interincisal angle between the
three groups
wasnot statistically significant (P>0.05).
GRAPH 6
100 102 104 106 108 110 112 114
Hypodivergent Hyperdivergent Average
Mean
Mean Interincisal angle in the three groups
47 | P a g e
ANALYSIS OF INTERMOLAR ANGLE:
TABLE - 7
Group Mean
Std
dev
Min
Max
F
P-Value
Significantly
different
from
(i) Hypodivergent
161.40°
4.02°
152°
166°
48.173 <0.001*
ii, iii
(ii)Hyperdivergent 148.25° 5.65°
136°
160°
i,
iii
(iii) Average
157.40°
2.93°
152°
163°
ii, iii
*denotes significant difference
Higher mean intermolar angle
wasobserved in hypodivergent group followed by average and
hyperdivergent group respectively. The difference in mean intermolar angle between the
three groups
wasfound to be statistically significant (P<0.001). The difference in mean
intermolar angle between hypodivergent and hyperdivergent group as well as between
hypodivergent & average group
wasfound to be statistically significant. Also, the difference
in mean intermolar angle between hyperdivergent and average group
wasalso found to be
statistically significant.
GRAPH - 7
140 145 150 155 160 165
Hypodivergent Hyperdivergent Average
Mean
Mean Intermolar angle in the three groups
48 | P a g e
ANALYSIS OF INTER PREMOLAR ANGLE:
TABLE-8
Group Mean
Std
dev
Min
Max
F
P-Value
Significantly
different
from
(i) Hypodivergent 167.70°
5.57°
157°
175°
8.962 <0.001*
Ii
(ii)Hyperdivergent 159.30° 8.05°
140°
176°
I
(iii) Average
163.85°
4.75°
155°
176°
*denotes significant difference
Higher mean interpremolar angle
wasobserved in hypodivergent group followed by average
and hyperdivergent group respectively. The difference in mean interpremolar angle between
the three groups
wasfound to be statistically significant (P<0.001). The difference in mean
interpremoalr angle between hypodivergent and hyperdivergent group
wasfound to be
statistically significant. No statistically significant difference
wasobserved between average
group and the other groups.
GRAPH - 8
154 156 158 160 162 164 166 168 170
Hypodivergent Hyperdivergent Average
Mean
Mean Interpremolar angle in the three groups
49 | P a g e
ANALYSIS OF ANTERIOR LOWER FACIAL HEIGHT (ALFH):
TABLE -9
Group Mean
Std
dev
Min
Max
F
P-Value
Significantly
different
from
(i) Hypodivergent 66.75mm 4.79mm
57mm 77mm
8.871 <0.001*
Ii
(ii)Hyperdivergent 74.15mm 7.77mm
55mm 89mm i,
iii
(iii) Average
67.35mm 5.56mm
57mm 82mm
Ii
*denotes significant difference
Higher mean ALFH
wasobserved in hyperdivergent group followed by average and
hypodivergent group respectively. The difference in mean ALFH between the three groups
was
found to be statistically significant (P<0.001). The difference in mean ALFH between
hypodivergent and hyperdivergent group
wasfound to be statistically significant. Also, the
difference in mean ALFH between hyperdivergent and average group
wasalso found to be
statistically significant. No statistically significant difference
wasobserved between
hypodivergent and average group with respect to the mean ALFH.
GRAPH - 9
62 64 66 68 70 72 74 76
Hypodivergent Hyperdivergent Average
Mean
Mean ALFH in the three groups
50 | P a g e
Diagnosis and treatment of malocclusion depends on the form and growth of the
human face. The interplay of vertical growth as related to anteroposterior growth is
responsible for various facial types. The various descriptions of facial types, such as
hyperdivergent, hypodivergent and average, are related to structural variations and
interactions between vertical and anteroposterior growth.
Extensive knowledge of facial morphology and development is necessary for the
successful treatment of dentofacial deformities.
Orthodontist must understand and appreciate the value of vertical growth and also
must constantly seek a deeper understanding into how the growth in this direction
produces different facial types.
Bjork’s structural signs of mandibular growth rotation by Pancherz 50 et al assessed the hypodivergency and hyperdivergency of mandible, which showed
hypodivergency, was more easily appreciable than hyperdivergency.
The present study was aimed to seek compare the morphological changes in
mandible between hypodivergent, hyperdivergent and average growth patterns using
51 | P a g e
This cephalometric study of mandible in average, hypodivergent and
hyperdivergent patterns was based on 60 adult subjects within the age group of 18 years
and above. None of them had previous history of orthodontic treatment. The subjects
were divided into 3 groups of 20 each.
¾ Hypodivergent group withSN-GoGn angle less than 28degrees.
¾ Average group with SN-GoGn angle between 28-32degrees.
¾ Hyperdivergent group with SN-GoGn angle greater than 32 degrees.
Various cephalometric points, planes, linear and angular measurements were
used in the study to evaluate the morphological changes of mandible in each group.
Bjork12seven signs of mandibular rotation i.e.