A STUDY OF PULMONARY FUNCTION TEST IN TYPE
II DIABETES MELLITUS – SPIROMETRY BASED
Dissertation submitted to
THE TAMILNADU Dr. M. G. R MEDICAL UNIVERSITY
In partial fulfillment of the
regulations for the award of the degree of
M.D. (PHYSIOLOGY)
BRANCH-V
THANJAVUR MEDICAL COLLEGE AND HOSPITAL
THE TAMIL NADU Dr. M.G.R MEDICAL UNIVERSITY
CHENNAI, INDIA
CERTIFICATE
This is to certify that this Dissertation entitled “A STUDY OF
PULMONARY FUNCTION TEST IN TYPE II DIABETES MELLITUS –
SPIROMETRY BASED” is submitted to the Tamilnadu Dr. M.G.R
Medical University, Chennai which was done under the guidance of our
Professor Dr.R.Vinodha M.D., Professor and HOD, Department of Physiology, Thanjavur Medical College, Thanjavur.
This dissertation is a record of fresh work done by the candidate Dr.S.Suguna during the course of the study (2010-2013). This work was carried out by the candidate herself under my supervision.
DR. C.GUNASEKARAN,M.D.,DCH DR. R.VINODHA M.D.,
The Dean Professor and Head of the Department Thanjavur Medical College Department of Physiology
DECLARATION
I hereby declare that this dissertation entitled “A study of pulmonary
function test in type II diabetes mellitus – Spirometry based” is a bonafide
and genuine research work done by me under the guidance of our Professor Dr.R.Vinodha M.D., Professor and Head of Department, Department of Physiology, Thanjavur Medical College, Thanjavur.
This dissertation is submitted to the Tamilnadu Dr. M.G.R Medical University, Chennai in partial fulfillment of the university requirements for the award of degree M.D in physiology.
Place:
ACKNOWLEDGEMENT
I express my deep sense of gratitude to my teacher and guide Professor
Dr.R.Vinodha M.D., Professor and Head of Department, Department of
Physiology, Thanjavur Medical College, Thanjavur, for her valuable suggestion and excellent guidance throughout the period of my study.
Our Professor has been always inspiring me and without her inspiration and encouragement this dissertation would have never been a complete one.
I express my gratitude to the Dean, Thanjavur Medical College for allowing me to pursue this dissertation work.
I sincerely thank HOD of Diabetology for permitting me to carry out the study in the outpatient department of diabetes.
I also thank HOD of biochemistry for permitting me to carry out the biochemical evaluations in their department.
S.NO
CONTENTS
PAGE NO
1.
INTRODUCTION
1
2.
AIMS & OBJECTIVES
3
3.
REVIEW OF LITERATURE
4
4.
MATERIALS & METHODS
48
5.
RESULTS
53
6.
DISCUSSION
71
7.
CONCLUSION
79
8.
BIBLIOGRAPHY
INTRODUCTION
Diabetes mellitus is one of the most common chronic diseases in nearly all countries, and continues to increase in numbers and significance, as changing lifestyles lead to reduced physical activity, and increased obesity (1).
According to WHO survey, India will be the world diabetic capital in 2025. As the prevalence of diabetes is increasing, with type II diabetes accounting for 90 – 95% of all cases (2). It is often asymptomatic in its early stages and can remain undiagnosed for many years.
The etiogenesis of type II diabetes reflects the heterogeneous genetic, pathologic, environmental and metabolic abnormalities that can exist in different patients and all lead to a final common pathway of hyperglycemia (3). Chronic hyperglycemia is associated with continuing damage, dysfunction and failure of various organs, especially the eyes, kidneys, nerves, heart, lungs and blood vessels (4).
It has been demonstrated that pulmonary complications in diabetes are due to thickening of walls of alveoli, alveolar capillaries and pulmonary arterioles and these changes cause pulmonary dysfunction (4).
These microvascular complications appear early within 5 to 10 yrs and macrovascular complications appear within 15 to 20 yrs from the onset of diabetes (6).
In type I diabetes lung function has been investigated in several clinical studies and evidenced reduced lung volume, reduced elastic recoil, diminished respiratory muscle performance, decrease in pulmonary diffusion capacity for carbon monoxide (7) .
As the prevalence of type II DM is increasing, particularly in developing countries like India, and since these changes can potentially incapacitate the patients, it is of utmost importance to define these changes. It is also important to find ways of retarding the progression of disease so that they do not become irreversible thus allowing millions of patients to be economically productive (2).
It has been suggested that pulmonary dysfunction may be one of the earliest measurable non metabolic alteration in diabetes.So it is important to determine whether these lung function changes also occur in type II diabetes.
AIMS
&
AIMS & OBJECTIVES
To study lung function in type II diabetic patients. To correlate pulmonary function test with duration of diabetes mellitus.REVIEW
OF
REVIEW OF LITERATURE
DIABETES MELLITUS
The term diabetes is derived from the greek word meaning ‘siphon’ was named by Aretaeus of cappadoica. Cullen added the word ‘mellitus’ meaning honey, to the name diabetes (8).
Diabetes mellitus is a syndrome characterized by chronic hyperglycemia and disturbances of carbohydrate, fat and protein metabolism associated with absolute or relative deficiencies in insulin secretion or insulin action.
The characteristic symptoms of diabetes mellitus are polyphagia, polydipsia, polyuria and weight loss (6).
HISTORY:
Diabetes was described more than 2000 years ago. Polyuric states, clinically resembling diabetes mellitus were described as early as 1550 B.C, by Georg Ebers (6).
The sugar in diabetic urine was identified as glucose by Chevreul in 1815. In the 1840’s , Bernard showed that glucose was normally present in blood and showed that it was stored in the liver as glycogen for secretion into the blood stream during fasting.
pancreatic ‘islets’ described by Langerhans in 1869 produced as internal secretion that regulated glucose metabolism.
Insulin was discovered in 1921 by Banting, Best acid – ethanol extracts of pancreas.
awarded the noble prize in 1923 and Insulin was first used for treatment in J
INSULIN:
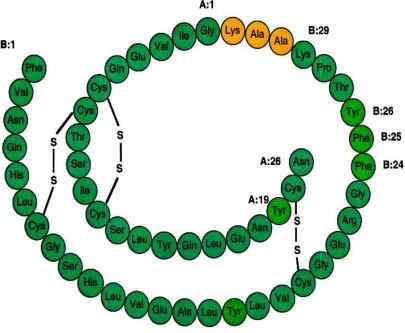
Insulin is a polypeptide containing 2
[image:13.595.110.515.382.715.2]disulfide bridges, secreted by beta cells of pancreas.
Figure 1:
described by Langerhans in 1869 produced as internal secretion that regulated glucose metabolism.
s discovered in 1921 by Banting, Best, Macleod and Collip in ethanol extracts of pancreas. For this, Banting and Macleod were the noble prize in 1923 and they shared it with Best and Collip. was first used for treatment in January 1922 (9).
is a polypeptide containing 2 chains of amino acids disulfide bridges, secreted by beta cells of pancreas.
Figure 1: Structure of Human Insulin.
described by Langerhans in 1869 produced as internal
, Macleod and Collip in For this, Banting and Macleod were shared it with Best and Collip.
In humans, the gene encoding preproinsulin, the precursor of insulin, is located on the short arm of chromosome 11. It is 1355 base pairs in length and its coding region consists of three exons. The first encodes the signal peptide at the N – terminus of preproinsulin, the second the B chain and part of C peptide and the third the rest of the C peptide and the A chain.
Preproinsulin, an 11.5 KDa polypeptide is rapidly discharged into the rough endoplasmic reticulum where proteolytic enzymes immediately cleave the signal peptide, generating proinsulin.
Proinsulin is a 9-KDa peptide, containing the A and B chains of insulin joined by the C peptide. It is transported in micro vesicles to the golgi apparatus where it is packaged into membrane – bound vesicles known as secretory granules. It is converted into insulin by two endopeptidases.
Insulin and C peptide are stored together in the secretary granules and are ultimately released in equimolar amounts by a process of regulated exocytosis (9).
Mechanism of action of insulin:
Insulin receptor is a tetramer made up of two α and two β glycogen subunits. All these are synthesized on a single mRNA and then proteolytically separated and bound to each other by disulfide bonds. The subunits bind insulin and are extracellular, whereas the β subunit span the membrane and the intracellular portion have tyrosine kinase activity.
Binding of insulin with α subunit of insulin receptor triggers the tyrosine kinase activity of the β subunits, producing autophosphorylation of the β
subunits on tyrosine residues. This autophosphorylation of insulin receptor is essential for insulin to exert its metabolic effects. In the tissue insulin increases the number of glucose transporters in the cell membrane (GLUT) (10).
The primary function of insulin is to lower the plasma glucose concentration by increasing glucose entry into the cell and stimulates its oxidation and also promotes its storage. At the same time insulin inhibits glucose production.
In skeletal muscle, insulin stimulates glucose transport and glucose storage as glycogen, as well as glycolysis and tricarboxylic acid cycle activity. Insulin also lowers hepatic glucose output by inhibiting glycogenolysis, gluconeogenesis and augments glycogen formation.
Insulin also enhances cell growth, differentiation and survival as a consequence of mitogenic and anti-apoptotic process. Thus oxidative stress, endoplasmic reticulum stress and inflammation are associated with insulin resistance, obesity and metabolic syndrome (9).
DIABETES MELLITUS
The constellation of abnormalities caused by insulin deficiency is called diabetes mellitus. It is characterized by polyuria, polydipsia, polyphagia, hyperglycemia, glycosuria, ketosis, acidosis, and coma.
The fundamental changes are
• Decrease in the entry of glucose into peripheral tissues. • Increased synthesis of glucose by the liver.
Therefore there is an excess extracellular glucose and in many cells an intracellular glucose deficiency-a situation called “starvation in the midst of plenty” (10).
Based on the pathogenesis responsible for hyperglycemia, diabetes mellitus is classified as
1. Type I Diabetes Mellitus. 2. Type II Diabetes Mellitus.
3. Other specific types [Maturity-Onset Diabetes of the Young (MODY), due to endocrine disorder, infection ]
TYPE I DIABETES MELLITUS:
It is characterized by the development of a state of complete insulin deficiency, as a result of cellular mediated autoimmune destructive process which ultimately destroys the β cells.
TYPE II DIABETES MELLITUS:
It represents a heterogeneous constellation of disease syndromes, all leading to a final common pathway of hyperglycemia. It is due to impaired insulin secretion, insulin resistance and increased hepatic glucose production.
OTHER SPECIFIC TYPE:
1. Defects in insulin secretion are the Maturity-Onset Diabetes of the Young (MODY) family, which are a group of autoimmune – dominant inherited disorder where there is hyperglycemia at an early age, generally of a mild nature.
2. Diseases of the exocrine pancreas often cause diabetes through destruction of islets – eg: Pancreatitis, Hemochromatosis, Cystic fibrosis.
3. Several endocrinopathies are associated with diabetes – cushing syndrome, acromegaly, pheochromocytoma, hyperthyroidism and glucagonoma.
GESTATIONAL DIABETES:
Gestational diabetes is hyperglycemia first detected during pregnancy. Screening for GDM is generally undertaken at around 28 wks (3).
Of these, type II DM is a predominant form of diabetes worldwide. The complications of type II DM are due to microangiopathy and macroangiopathy, which affect the eyes, kidneys, nerves, heart and major blood vessels (11).
WHO – recommended criteria for the diagnosis of diabetes and
intermediate hyperglycemia
TEST NORMOGLYCEMIA IFG (mg/dl) IGT (mg/dl) DIABETES
Fasting plasma glucose
< 100 100-125 ≥126mg / dl
2 hr plasma glucose
< 140 149 -199 ≥200mg / dl
Causal plasma glucose
≥200mg/ dl &
symptoms of diabetes
TYPE II DIABETES MELLITUS
An epidemic of type II diabetes is underway in both developed and developing countries like India due to change in life style, junk foods, sedentary life, environmental factors and stressful life .
MAJOR RISK FACTORS FOR TYPE II DIABETES MELLITUS:
• Over weight (Body Mass Index ≥ 25 kg / m2). • Physical inactivity.
• Race / ethnicity.
• Previously identified Impaired Fasting Glucose or Impaired Glucose Tolerance.
• Hypertension (Blood pressure ≥ 140 /90 mm Hg).
• Triglyceride ≥ 250 mg / dl or HDL cholesterol ≤ 35 mg / dl. • History of Gestational Diabetes Mellitus or delivery of a
baby weighing > 4.1 kg.
• Poly cystic ovarian disease (11).
The three major metabolic abnormalities that coexist in type II diabetes are 1. Increased hepatic glucose production.
2. Target tissues are insulin resistant ( skeletal muscle) 3. Abnormal islet cell function.
Genetic factors:
Type II diabetes is not simply the result of a single gene defect. The disease appears to be a polygenic disorder, meaning that different combinations of gene polymorphisms may exist among patients. Individuals may be predisposed to develop type II diabetes through their inheritance of particular combination of genes, but acquired environmental factors are necessary to bring out the phenotypic manifestation of hyperglycemia.
Acquired factors:
1. Westernized life style is associated with change to a diet that has a higher content of total calories, fats, and refined carbohydrates.
2. The reduced level of physical activity and obesity leads to develop diabetes.
3. Low birth weight is one of the risk factor for the development of insulin resistance.
4. Decline in insulin secretion and insulin sensitivity, results in decreased glucose tolerance in aged individuals.
Pathophysiology of type II diabetes mellitus:
1. Abnormal beta cell function:
Glucose stimulated insulin secretion involves transport of glucose into cells by a specific glucose transporter termed GLUT2. Genetic deletion of GLUT2 leads to loss of glucose stimulated insulin secretion.
2. Peripheral insulin resistance:
Insulin resistance is a metabolic state where there is normal insulin production but less biological response.
One of the most important effects of insulin was stimulation of glucose uptake into skeletal muscle, adipocytes and heart muscle. Tissue glucose uptake is mediated by a family of at least five facilitative glucose transporters. Out of them, GLUT4 was uniquely expressed in skeletal muscle, adipocytes and heart muscle. Upon insulin stimulation, GLUT4 are translocated from the intracellular vesicular pool to the plasma membrane, where they begin to transport glucose into cell.
The major manifestation of insulin resistance is decreased glucose disposal. The cause for this may be due to
• Decrease in cellular insulin receptors.
• Abnormal coupling between the glucose transporters and insulin receptors.
• Decrease in the activity of the glucose transporters.
Mechanism of hyperglycemia induced damage:
Due to generalized hyperglycemia, certain types of cells are potentially damaged. Because these cells fails to down regulate the glucose uptake, even when the extracellular glucose concentrations are elevated.
The major target for hyperglycemic damage are vascular endothelial cells, which shows no significant change in glucose transport even when the glucose concentration is elevated, resulting in intracellular hyperglycemia.
1. Hyperglycemia increases glucose metabolism by sorbital pathway. This leads to cellular dysfunction, as a result of increase in cellular osmolarity, altered redox potential, generation of reactive oxygen species.
2. Increased intracellular advanced glycation end products, formed by reaction of glucose and other glycating compounds with proteins and to some extent, nucleic acids.
3. Increase in the expression of Advanced Glycated End products receptor and its activating ligand.
5. Increased hexosamine pathway flux which generates fructose -6-phosphate, a substrate for O – linked glycosylation and proteoglycan production.
Finally a single process due to increased mitochondrial production of oxygen free radicals activates each of this mechanism.
The consequence of persistent hyperglycemia is increased superoxide production which explains the continuing progression of tissue damage even after the improvement of glycemic levels (glycemic memory). So early glycemic control appears to be important in order to reduce vascular complications in subsequent decades (9).
Biochemical test to be done to diagnose and monitor the efficacy of
treatment to DM:
Glycated hemoglobin and blood glucose are the two most frequently used measure of glycemia in current practice.
1. Fasting blood glucose should be obtained after an approximately 10 hr fast. Urine glucose measurement is not used in diabetic diagnosis; however some patients use this measurement for monitoring purposes.
2. Oral glucose tolerance test:
Patient should be on a normal to high carbohydrate intake for 3 days before the test. The patient should be fasting for at least 10 hrs and not more than 16 hrs. The test should be performed in the morning because of the hormonal diurnal effect on glucose.
Fasting blood sample is collected. A solution containing 75gm of glucose is given orally and blood for plasma glucose measurement is drawn 2hrs later. If the two hr glucose is 149 -199 mg/dl is called impaired glucose
tolerance and > 200 mg/dl is called diabetes.
3. Glycosylated hemoglobin is the most reliable method to monitor long term diabetes control rather than random blood glucose. HbA1c is the most commonly detected hemoglobin, is a glucose molecule attached to one or both N- terminal valine of the β- polypeptide chain of normal adult hemoglobin(9) .
Complications of diabetes mellitus:
1. Acute complications:
• Metabolic – diabetic ketoacidosis.
Hyperglycemic hyperosmolar syndrome. Hypoglycemia.
• Others – acute infections. Acute coronary syndromes. Cerebrovascular accidents. 2. Chronic complications:
• Microvascular – Neuropathy and Retinopathy.
• Macrovascular – Hypertension, Coronary arterial disease. HbA1c
Mean plasma glucose mmol/L mg/dl
6 7.0 126
7 8.6 154
8 10.2 183
9 11.8 212
10 13.4 240
11 14.9 269
• Others – Diabetic foot, Gastro intestinal and genitourinary dysfunction.
• Dermatological disorders. • Infections.
Management of Type II Diabetes:
The management of type II diabetes mellitus was very important to achieve good glycemic control, in order to prevent or reduce the severity of chronic complications.
1. Lifestyle intervention.
Diet –the caloric content of the diet is based on the patient’s current
weight. 150 kJ / kg for men and 140 kJ/kg for women are reasonable initial values in most patients.
The protein requirement for good nutrition is about 1.0 to 1.5 g/kg of body weight/ day. The average fat intake should be 30 % of total calories and the remaining calories are assigned to carbohydrate. Increasing the fiber content of the diet is helpful.
exchanges or experience – based estimation of consumption of carbohydrate at meals or snacks.
The glycemic index (GI) of a carbohydrate – containing food describes its post prandial glucose response over 2hrs in the area under the good glucose curve compared with a reference food with the same amount of carbohydrate, usually 50 g glucose. Foods can be differentiated into high (GI: 70-100) average (GI: 55-70) or low (GI: 55) glycemic index food.
High GI foods (e.g.: mashed potatoes, sugary drinks, cookies) should be substituted with low GI foods (e.g. oats, whole grain breads, certain raw fruits) as they lower post-prandial hyperglycemia (9).
Exercise: One of the important lifestyle modifications in diabetes is
exercise. It is associated with improved glycemic control, insulin sensitivity, and cardiovascular fitness and remodeling.
Self-monitoring of blood glucose is an integral part of the process,
allows the patients to assess the effect of their lifestyle and pharmacologic efforts in controlling post prandial glucose levels (3).
2. Pharmacotherapy.
The available oral hypoglycemic agents are
• Sulfonylureas (eg: gliclazide, glimepride) act on the pancreas β cells to stimulate insulin secretion.
• Meglitinides, also known as prandial insulin releasers, taken before meals to boost insulin levels during digestion, thereby reducing prandial hyperglycemia.
• Thiazolidinediones alter the expansion of certain insulin sensitive genes by stimulating the peroxisome-proliferator-activated receptor γ and produce a slow –onset-glucose lowering effect, attributed mainly to increased insulin sensitivity.
• α – glucosidase inhibitor (eg: acarbose) show the digestion of
carbohydrates by competitive inhibition of intestinal α – glucosidase enzymes.
The advanced stages of type II diabetes insulin therapy should be initiated, along with oral hypoglycemic agents (9).
RESPIRATORY SYSTEM
The organ that supports gas exchange comprises the respiratory system. They are the upper airways, lower airways, lung parenchyma, chest wall, respiratory muscle, pulmonary blood vessels, support nerves and lymphatics. Lung is a sophisticated conglomerate of alveolar air sacs, whose primary function is continuous absorption of O2 and excretion of CO2 (12).
lungs are low – density organs that occupy a volume of approximately 3.5 liters and weight approx 900gm.
The chest wall and the lungs are elastic structures that can expand and recoil when inflated with air. This elasticity results from surface tension forces in the alveoli & from the elastic properties of the tissues & various connective tissue fibers. The presence of elastin fibers in the alveolar walls, the small airways and pulmonary capillaries produces elastic recoil.
Collagen and reticulin fibers located in the visceral pleurae and airway walls combine to create a basket like helical network of connective tissue fibers around the alveoli and airway walls that extends to the lumen.
Tendency of the lung to collapse is counteracted by the thoracic walls tendency to spring outward and to hold the lung inflated. The tension developed by these two opposing tendencies result in the development of subatmospheric intrapleural pressure (13).
INSPIRATION AND EXPIRATION:
Inspiration is an active process. The muscles of inspiration are diaphragm, external intercostals, sternocleidomastoid muscle, serratus anterior and scalene muscle. Their contraction increases the lung volume.
the surface of lungs with greater force creating negative intrapulmonary pressure.
At the end of inspiration, the inspiratory muscles relax and the recoiling force of the lungs begins to pull the chest wall back to expiratory position. The pressure in the airway becomes slightly positive, and the air flows out of the lungs.
Expiration during quiet breathing is passive. At the end-expiratory position where the recoil force of the lungs and recoil force of thoracic cage balance, the pleural pressure returns back to -2.5 mm Hg (10).
RESPIRATORY UNIT:
It is composed of a respiratory bronchiole, alveolar ducts and alveoli. There are about 300 million alveoli in the lungs; each alveolus is about 0.2 mm in diameter. The alveolar walls are thin and has solid network of interconnecting capillaries. Gas exchange occurs between the alveoli and pulmonary capillary blood.
RESPIRATORY MEMBRANE:
The layers of the respiratory membrane are 1. A fluid layer containing surfactant. 2. A layer of alveolar epithelium.
4. A thin interstitial space between the alveolar epithelium & the capillary membrane.
5. A capillary basement membrane. 6. The capillary endothelial cell layer.
Despite the large number of layers, the thickness of the respiratory membrane is 0.2 µm and the total surface area is about 70 square meters (14).
PULMONARY FUNCTION TEST
The pulmonary function tests are very important age old test to assess the respiratory function of a person. They are important for clinical, diagnostic and prognostic values (7).
The factors that determine the lung functions at a particular point in adult life are
1. The maximally attained level of lung function. 2. The onset of decline of lung function.
3. The rate of decline of lung function.
Normally the maximum lung function is around the ages of 20 and 25 years. After the age of 30-35 years there is decline in lung function (15).
Therefore, the subjective assessment of the severity of the disease is sometimes difficult. It may lead to inadequate treatment interventions and control of the disease.
Measurements of the lung function tests are important in diagnosis and monitoring of treatment of lung disorders (16).
The ability of the lungs to perform gas exchange depends upon
1. The diaphragm and thoracic muscles which are capable of expanding the thorax and lungs to produce a subatmospheric pressure.
2. The airways must be unobstructed so that it allows gas flow into the lungs and reach the alveoli.
3. The cardiovascular system must circulate blood through the lungs and ventilated alveoli.
4. O2 and CO2 must be able to diffuse through the alveolar – capillary membrane.
Pulmonary function tests can provide valuable information about these important individual processes that support gas exchange i.e. ventilation, diffusion & perfusion (13).
Pulmonary function tests can be divided into categories based on the aspect of lung function they measure
1) Airway function
3) Diffusion capacity tests.
4) Blood gases and gas exchange tests. 5) Cardiopulmonary exercise tests. 6) Metabolic measurements.
Airway function and lung volumes are almost always measured with spirometry.
SPIROMETRY
Spirometry is a powerful tool that can be used to detect, differentiate, follow and also to manage patients with pulmonary disorders. It typically assesses the lung volumes and flows. It is also useful to determine the patterns of lung dysfunction (4).
In the middle of 18th century, Hutchinson developed a simple water sealed spirometer that allowed measurement of vital capacity. He also observed that VC was related to the standing height of the patient (17).
In 1679, Borelli first measured the volume of air inhaled by single deep breath. The need for temperature correlation was pointed out by Goodwyn (1788). In 1831, Thackrah showed the volume of air to be less in women than in men.
Forced vital capacity is a refinement of the simple VC test. During the 1930s, Barach observed that patients with asthma exhaled more slowly than healthy patients. He noted that airflow out of the lungs was important in detecting obstruction of the airways. He also used kymograph to display VC changes as a spirogram.
In 1950, Gaensler began using a microswitch in conjuction with water – sealed spirometer to time FVC. He observed that healthy patients consistently exhaled approximately 80% of their FVC in 1 second and almost all of the FVC in 3 seconds. He used the FEV1 to assess airway obstruction.
In 1955, Leuallen and Fowler demonstrated a graphic method to assess airflow. They measured airflow between the 25% and 75% points on a forced expiratory spirogram. This was described as maximal mid expiratory flow rate [MMFR] and now referred to as Forced Expiratory Flow 25% - 75%.
In the late 1950s, Hyatt and others began using the flow – volume display to assess airway function. The tracing was termed the Maximal Expiratory Flow Volume (MEFV) curve. By combining it with an inspiratory maneuver, a closed loop was displayed called the flow – volume loop.
In the 1960s, Wright used the peak flow to monitor asthmatic patients. Peak Expiratory Flow (PEF) is measured using either a flow – sensing spirometer or a peak flow meter.
capacity. The MVV gives an estimate of the peak ventilation available to meet physiologic demands (17).
Nowadays, modern computerized pulmonary function systems allow very sophisticated data handling and storage, graphic display of maneuvers, accurate calculations and enhanced reporting capabilities. They combine physical transducers, analog to digital converters, and computer software to process and record physiologic data. Microprocessor-based spirometers are now small enough to be handheld and portable (17).
TYPES OF SPIROMETERS:
Broadly there are two types of spirometers:
I.VOLUME DISPLACEMENT SPIROMETERS:
These records the amount of air exhaled or inhaled within a certain time. These widely used types of volume spirometer are
1) Water seal spirometer. 2) Dry rolling seal spirometer. 3) Bellows spirometer.
II. FLOW SENSING SPIROMETER OR PNEUMOTACHOMETER:
The most common types of flow spirometers are 1) Rotating vanes (Turbines)
2) Pressure differential flow sensing spirometers. 3) Hot wire anemometers.
4) Pitot tube flow sensing spirometers (16).
Spirometry can be performed in either the sitting or standing position for adults and children. The use of nose clips is recommended for spirometric measurements that require rebreathing, even if just for a few breaths.
American Thoracic Society Standards for Spirometry are
The spirometer should be able to measure up to 30 seconds, while measuring the slow vital capacity and for FVC, the time capacity should be at least 15 seconds.
It should have a capacity of at least 8 Liters and should measure volumes with less than 3% error or within 50ml of a reference value, whichever greater.
A diagnostic spirometer should measure flow of about 95% accurate over the entire 0 to 14 L/sec range of gas flow.
The values produced by spirometer is corrected for body temperature, ambient pressure, and saturated with water vapour (BTPS).
INDICATIONS OF SPIROMETRY:
1. To detect the presence or absence of lung disease. 2. To monitor the progress of the disease.
3. To monitor the efficiency of treatment.
4. To evaluate the respiratory fitness prior to surgery.
5. To measure effects of occupational or environmental exposure
6. To evaluate disability or impairment (17).
CONTRAINDICATIONS OF SPIROMETRY:
1. Hemoptysis of unknown origin. 2. Respiratory infections.
3. Pneumothorax.
4. Recent myocardial infarction or pulmonary embolus. 5. Recent eye surgery or surgery of thorax or abdomen. 6. Thoracic, abdominal or cerebral aneurysms (4).
LUNG VOLUMES AND CAPACITIES
disease. Lung volumes are almost ai spirometry.
Figure 2: Diagrammatic representation of lung volumes and capacities
disease. Lung volumes are almost airways measured in conjunction with
Figure 2: Diagrammatic representation of lung volumes and capacities
based on a simple spirogram.
ways measured in conjunction with
The four lung volumes are
1. Tidal volume is the volume of air inspired or expired during
quiet breathing and is about 500ml.
2.The amount of air inspired with maximum inspiratory effort above the normal tidal volume is called inspiratory reserve
volume: it is about 3000ml.
3. The expiratory reserve volume is the volume of air expired with maximum expiratory effort after the normal tidal expiration: this normally amounts to about 1100ml.
4. The volume of air remaining in the lungs after the forceful expiration is known as residual volume: it is normally about 1200ml.
The pulmonary capacities are
1. The maximum amount of air inspired after completing the tidal expiration is defined as inspiratory capacity and is about 3500ml. 2. The functional residual capacity is the amount of air remaining in
the lung at the end of normal expiration and is about 2300ml.
3. The vital capacity is the maximum amount of air expired forcefully after a maximum inspiratory effort and is about 4600ml.
Indices based on volume:
The volume of gas measured from a slow, complete expiration after a maximal inspiration, without forced or rapid effort is known as vital capacity. It is also referred to as the slow vital capacity, distinguishing it from forced vital capacity.
Forced vital capacity is defined as the maximum volume of expired
forcefully and rapidly after a maximal inspiration.
In healthy individuals FVC equals VC or FVC & VC should be within 200ml of each other. Reduced FVC is a non specific finding. Values lower than 80% of predicted or less than the 95% confidence limit are considered abnormal. Low FVC may be caused either by obstruction or restriction.
FEV1 is the volume of air expired in the first second of an FVC
maneuver. It is reported as a volume, although it measure flow over a specific interval. The index was pioneered by Tiffeneau and Pinelli and by Gaensler. FEV1, like FVC may be reduced in either obstructive or restrictive patterns.
FVC is measured concurrent with FEV1 and its main application is to standardize FEV1 for lung size using the relationship:
FEV1% = (FEV1/FVC) × 100
The relationship is a component of most lung function reports (12).
adults average 4 to 5 L / sec. It is useful in to detect air flow limitation in the early stage itself.
PEF primarily measures large airway function. Effort dependence of
PEF makes it a good indicator of patient effort during spirometry. It is particularly useful for monitoring asthma patients at home.
Maximal voluntary ventilation (MVV) is the maximum volume of air
expired in a specific period of time (12 sec for normal subjects). It tests the overall function of the respiratory system. It is influenced by airway resistance, respiratory muscle, compliance of the lung/ chest wall and ventilatory control
mechanisms. Values in healthy young men average between 150 – 200 L/min. MVV is decreased in patients with moderate or severe obstructive
disease. MVV may be normal in patients who have restrictive pulmonary disease. They can compensate by performing the MVV maneuver with VT and breathing rates (17).
Indices based on time:
Indices from the relationship of flow to volume:
The flow – volume curve
flows and lung volume. The curve can be for expiration alone or for expiration and inspiration (flow
[image:42.595.112.545.229.647.2]proved to be a value for diagnosis.
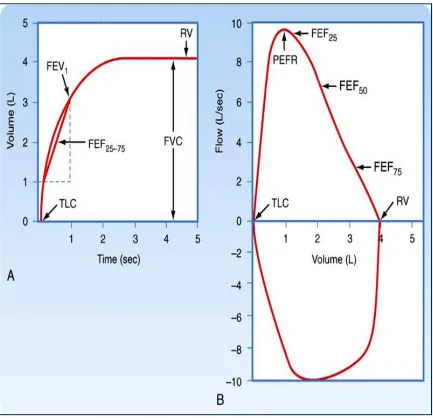
Figure 3: A – shows volume
Flow is plotted on the vertical axis
horizontal axis. Expiratory flow is plotted upward and inspiratory flow is
Indices from the relationship of flow to volume:
volume curve reflects the relationship between the respiratory lung volume. The curve can be for expiration alone or for expiration and inspiration (flow – volume loop). The shape of the flow-
proved to be a value for diagnosis.
shows volume – time graph. B – Shows flow
is plotted on the vertical axis and volume is plotted on the Expiratory flow is plotted upward and inspiratory flow is reflects the relationship between the respiratory lung volume. The curve can be for expiration alone or for expiration volume curve has
Shows flow-volume loop.
plotted downward. Peak flows for expiration and inspiration (PEF and PIF) can be read directly and the instantaneous flow (FEF) at any point in the FVC also can be measured directly (17).
The procedure to record the flow-volume loop is to ask the patient to perform FVC maneuver, inspiring fully and then exhaling as rapidly as possible. To complete the loop, the patient inspires as rapidly as possible from the maximal expiratory level back to maximal inspiration.
The flow-volume loop gives data for FVC, PEFR and Expiratory flow rates. When the expiratory flow-volume curve is divided into quarters, the instantaneous flow rate which 50% of the VC remains to be exhaled is called the FEF 50%, the instantaneous flow rate which 75% of the VC remains has been exhaled is called the FEF75% and the instantaneous flow rate which 25% of the VC has been exhaled is called the FEF 25% (18).
PATTERNS OF ABNORMALITIES IN PFT RESULTS
The three main types of ventilatory dysfunctions observed in spirometry are 1. Obstructive lung disorders in which the FEV1 is decreased, the FVC is usually normal and the FEV1/ FVC ratio is decreased. Obstructive lung disease can be caused by conditions such as asthma, bronchitis, COPD, etc.
such as fibrosis, interstitial lung disease, pneumoconiosis, sarcoidosis, obesity, pregnancy and loss of lung tissue due to surgery etc.
3. Mixed function disorders - all the three parameters FVC, FEV1 and FEV1/ FVC are reduced. Mixed pattern may be seen in conditions such as bronchiectasis, cystic fibrosis, post-tubercular fibrosis, allergic bronchopulmonary Aspergillosis etc (13).
INTERPRETATION OF SPIROMETRY RESULTS (16)
FEV1/FVC ratio
Low Normal
Obstructive lung diseases
FVC FVC
Low Normal Low Normal
Pure obstructive or combined obstructive and restrictive disease
Pure obstructive lung disease
Restrictive lung
Pulmonary Function
Parameter
Obstructive Type Restrictive Type
FVC (L) ↓ ↓
FEV1 ↓ ↓
FEV1/ FVC% ↓ Normal
FEF25 – 75% (L/SEC) ↓ Normal to ↑
PEFR ↓ Normal
Severity of pulmonary impairments based on a percentage (%) of the
predicted values
Degree of impairment Obstruction based on
FEV1
Restriction or
Obstruction based on
TLC,FRC,RV
Normal 80%-120% 80%-120%
Mild 70%-79% 70%-79% or 121%-130%
Moderate 60%-69% 60%-69% or 131%-140% Moderately Severe 50%-59% 50%-59% or 141%-150% Severe 35%-49% 35%-49% or 151%-165%
LUNG FUNCTION IN DIABETES
Spirometry is the non-invasive test that quantifies the physiological reserves that are not clinically affected by diabetes.
The pathogenesis of diabetic complications is due to involvement of both microangiopathy and non-enzymatic glycosylation of tissue proteins. This results in impaired collagen and elastin cross-linkage, reduction of strength and elasticity of connective tissue (5).
Since the lung has an abundant connective tissue, it may be a ‘target organ’ in diabetic patients (5). Lung function also provides useful measures of the progression of systemic microangiopathy in diabetic patients (4).
The another important issue is that the lungs have a large surface area which has the ability to transfer large amounts of oxygen from the air to blood, favours a convenient portal of entry of therapeutic agents (55).
It was formerly thought that diabetes did not affect the lungs. However in the mid 1980s, the FVC, FEV1, TLC, FRC & RV were observed to be reduced in diabetes. There was no evidence of airflow limitation. The finding was attributed to a reduction in lung compliance (12).
The decreased lung function is due to
The pulmonary pathologic changes such as thickened alveolar epithelial and pulmonary capillary basal laminae are secondary to pulmonary microangiopathy (20).
Long term diabetes mellitus is characterized by widespread alterations of basal lamina. The classic morphologic findings in diabetic microangiopathy are the thickening of basement membranes in capillaries. This is a generalized phenomenon which affects both vascular and nonvascular tissues. Weynand et al demonstrated the thickenings of basal lamina of pulmonary capillaries are homogenous throughout the whole lung parenchyma (21).
All pulmonary function parameters were lower in diabetics of both sexes than non diabetic controls with greater reduction in males than in females and were due to diminished elastic recoil of lungs (22).
The reasons are some genetic factor involved for abnormal collagen structure linked to genetic predisposition of diabetes mellitus or age related changes in lung functions which might appear early in diabetic males than females (22).
The effects of diabetes on the respiratory system are numerous. They are • Decreased lung volumes.
• Reduced vital capacity. • Reduced TLC.
• Decreased inspiratory muscle strength.
• Increased bronchial responsiveness with increased threshold for cough response.
• More prone to develop respiratory tract infections.
• Sleep apnea is common in those having autonomic neuropathy (19).
Diabetes mellitus and lung function have a two way relationship. It is important to assess respiratory dysfunction caused by diabetes mellitus. It is even more pertinent, in non- diabetic subjects, to assess the risk of diabetes mellitus.
The impaired lung function may be the forecast quite reliably many years before the actual diagnosis of diabetes mellitus (23).
Augusto A. Litonjua et al observed that the diabetics had reduced lung function (especially FEV1 and FVC but not FEV1 / FVC ratio) than non – diabetic subjects. This decreased lung function is found to be present many years before the subjects are diagnosed as having diabetes mellitus (15).
In a retrospective analysis diabetics were found to have significantly lower mean FEV1 and FVC values than for the control group. Diabetes also had an effect on the age related changes in lung function (24).
respiratory parameters and glycemic status of diabetic patients. The reason for this reduced lung function is respiratory muscle weakness (7).
Muhammad Irfan et al observed that the diabetic patients had impaired lung function independent of smoking. There was a decrease in FVC, FEV1, and SVC as compared to their controls. They also reported that respiratory muscle endurance was impaired which was determined by MVV test (25).
Davis et al conducted a large community-based study in Western Australia in type II diabetic patients. They demonstrated that VC, FVC, FEV1 and PEF were decreased in type II diabetic patients. An increase of 1% in mean HbA1C was associated with a decrease of 4% in predicted FVC. They also suggested that the chronic complications of type II diabetes are reduced lung volumes and air flow limitation (26).
Sreeja et al reported that there was a significant decrease in FEV1 / FVC% and FEF25 – 75% in diabetic subjects as compared to controls (27).
Yel and associates observed in their cross- sectional study that middle – aged type II diabetics had significantly lower FEV1, FVC, FEV1 % predicted and FVC% predicted compared with non diabetics (28).
McKeever et al demonstrated that in adults without diabetes, but impaired glucose regulation as indicated by glucose tolerance testing, higher levels of glycosylated hemoglobin, plasma insulin and C peptide are associated with impaired lung function in a dose – response manner (30).
O.L.Klein et al conducted a retrospective study and observed that FEV1 and FVC were significantly reduced in patients with diabetes than those without diabetes (31).
Banu S et al, found that Mean Expiratory Pressure (MEP) was significantly reduced which was due to respiratory muscle weakness (32).
P.Lange et al in their longitudinal study in diabetic and non diabetic adult’s participants of the Copenhagen City Heart study found that FEV1 and FVC were significantly lower in diabetic subjects when compared with healthy individuals with an average reduction of nearly 8% of the predicted value (33).
LUNG FUNCTION AND DURATION OF DIABETES
There is a definite correlation between the duration of diabetes
As a result of these alterations, there are chances for the formation of microthrombi and ischemic tissue damage (34).
The duration of diabetes was a significant determinant of FEV1 and a trend was seen for the FVC. The underlying mechanism of reduced pulmonary function in diabetes was due to inflammation which leads to progressive decrease in lung function and the severity of which would increase with duration of diabetes (35).
Mori showed that DLCO% decreased significantly as the duration of DM increased and the reduction was greater in patients with diabetic microangiopathy and in type I diabetes mellitus (36).
In a cross sectional study the diabetic population were found to have abnormal pulmonary function, viz, mild reduction of lung elastic recoil and a reduction in pulmonary diffusing capacity because of a reduced pulmonary capillary blood volume which was correlated with duration of diabetes mellitus(37).
PATTERN OF LUNG DISEASE IN DIABETES
The most abundant protein in the human lung is collagen, which is important in defining lung structure and function. This collagen network confers strength to the structure and is dependent on cross-linkage between collagen and elastin. This is most important in conferring elasticity to the lung. However, increased collagen cross – link may increase lung stiffness.
The plausible mechanisms for restrictive respiratory defect are increased elastic recoil, decreased chest wall compliance and muscular weakness (40).
The markers of inflammation are Interlukein-1, Interlukein-6, and tumor necrosis factor. These are associated with insulin resistance and this has been demonstrated in recent epidemiologic studies.
In another study by Arnalich et al, found that the inflammatory markers are reduced with the treatment of diabetes, suggesting that diabetes may be a cause of systemic inflammation. This is due to the proinflammatory effects of advanced glycation end-products.
Walter, Beiser, Givelber, et al demonstrated relationship between glycemic state and reduced lung function. They also observed a slightly increased FEV1 / FVC ratio suggesting a restrictive pattern of respiratory impairment (10).
This was due to metabolic disorders and metabolic syndrome in a severity dependant manner (41).
Sanjeev Verma et al reported a significant reduction in mean FVC and mean FEV1 but no significant change was observed in FEV1 / FVC ratio, PEFR, FEF25 – 75%. They concluded that there was a restrictive type of respiratory function in diabetic patients (2).
Meo et al observed that there was a drop of FVC, FEV1, FEF25 – 75% and PEF parameters suggests that type II diabetes adversely affect the lung function. This impairment shows a restrictive pattern of airways disease and is associated with dose-effect response of period of exposure to disease (23).
Nandhini et al also reported that there was a predominant restrictive pattern of the disease in type II diabetes mellitus, with a significant reduction of FVC and normal FEV1 / FVC % (42).
The pattern of abnormal pulmonary function observed in Boulbou et al study, low TLC, DLco and preserved FEV1 / FVC % was suggestive of a restrictive type of lung disease. The possibility exists that the reduced TLC was due to the result of increased chest wall stiffness, but it seems that the alteration of lung connective tissue at a biochemical level was responsible for the development of abnormal lung mechanics (43).
abnormalities. It is possible that type II diabetic patient’s exhale less air from the lungs at a slower rate than non-diabetic individuals, so there was an increase in residual volume (44).
In a prospective study of middle-aged men and women without known lung disease, lower vital capacity predicted and the subsequent development of type II diabetes. The possible explanation are hypoxia induced insulin resistance, adverse fetal or early- life conditions through long-standing altered gene expression, inflammatory precursors and decreased muscle strength (45).
Chance and associates observed in their study that alveolar microvascular reserves were reduced in type II diabetes, reflecting restriction of lung volume, alveolar perfusion and capillary recruitment. This reduction correlates with glycemic control and is aggravated by obesity (46).
Wannamethee and Associates in a large prospective study observed that restrictive lung function is associated with the development of type II diabetes. This association was due to inflammatory pathways (47).
Role of breathing exercise:
Regular breathing exercises are important to improve the lung function in diabetics. The exercises to improve the respiratory muscle strength are
2) Breathing control techniques such as pursed lip breathing, diaphragmatic breathing improves ventilation, decreases air trapping, decreases work of breathing and improves breathing patterns.
MATERIALS
&
MATERIALS AND METHODS
40 healthy volunteers were randomly recruited from the general population residing around Thanjavur Medical College. 40 type II diabetic patients were selected from the diabetic outpatient department of age group 35 – 55yrs with duration of diabetes more than 2 yrs. This was a case-control type of study done in the period may 2011-2012.
The study group was divided into two groups based on the duration of diabetes as 2-5yrs and 6-10yrs.
Group I - 40 healthy controls.
Group II - type II diabetic patients having diabetes for 2-5 years. Group III - type II diabetic patients having diabetes for 6-10 years.
An informed written consent was obtained from all the participants prior to their participation in the study. The study protocol was approved by the Institutional ethical committee of Thanjavur Medical College.
Inclusion criteria:
Apparently healthy individuals with type II diabetic patients on oral hypoglycemic drugs and having diabetes for more than 2 years duration of age group 35 – 55years. Thorough clinical examination and history was obtained from the subjects in order to determine the health status of the individual.
Exclusion criteria:
• Smokers.
• Patients with history of cardiac/respiratory disease (hypertension, myocardial infarction, bronchial asthma, bronchitis, tuberculosis).
• History of recent surgery.
• History of recent respiratory tract infection. • History of occupational exposure.
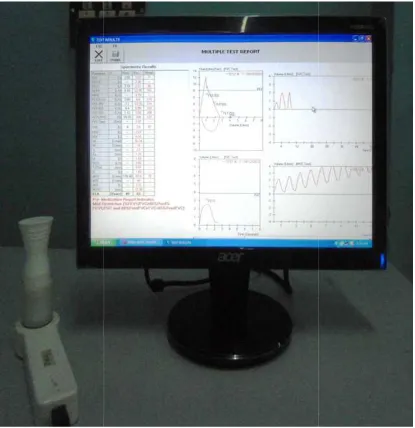
Pulmonary function tests were done using computerized spirometer which was standardized according to American Thoracic Society performance criteria [Spiro Excel – Digital Spirometer – Medicaid systems].
Blood samples were drawn for estimation of fasting blood sugar and glycated hemoglobin after 6 hours of fasting. The subject was asked to take breakfast and post-prandial blood sugar was also checked after 2 hours.
The pulmonary function data are represented in three columns. These columns show the predicted values, measured values obtained during testing and the percent of predicted values for each test. A common method of comparison is to compute a percentage of the predicted value.
PRECAUTIONS:
i. The subject must be comfortable and relaxed.
ii. The apparatus should be sterilized and cleaned properly. iii. The subject should sit with his spine erect and nostril closed. iv. The mouth piece is placed in the subject’s mouth in such a way
that the mouth piece remains fitted between the teeth and the lips. v. The subject should be demonstrated and trained about the different
maneuver.
vi. Minimum three recordings should be taken for each maneuver at a gap of two minutes each and the best of the three should be taken.
PROCEDURE:
Forced vital capacity:
inspiration to produce a complete image of forced breathing called a flow – volume loop.
Criteria for acceptability:
1. Maximal effort; No cough or glottis closure during the first second; no leaks or obstruction of mouth piece.
2. Good start- of- test ; extrapolated volume < 5% of FVC or 150ml 3. Duration-6 seconds of exhalation.
4. Three acceptable spirograms are obtained; two largest FVC values within 200ml and two largest FEV1 values within 200ml are taken.
Slow vital capacity:
The subject is instructed to inhale and exhale normally to record the tidal volume. Then the subject is asked to breathe in as much as possible after the normal expiration and exhale maximally to record inspiratory and expiratory volume.
Criteria for acceptability:
1. Two acceptable VC maneuvers should be obtained and volumes within 200ml
2. VC should be within 200ml of FVC value.
Maximum voluntary ventilation:
Criteria for acceptability:
1. Volume – time tracing shows continuous, rhythmic effort for at least 12 seconds.
2. End – expiratory lung volume is relatively constant.
3. Two acceptable maneuvers are obtained; MVV values are within 10%. 4.
MVV is approximately equal to 35×FEV1(17).
Statistical analysis:
Pulmonary function parameters were analyzed by using statistical software Microsoft excel and SPSS 18.0 for windows. The statistical analysis was done by the Student’s t test, which was used to find the significant difference of pulmonary function parameters between the healthy non- diabetic controls and type II diabetic cases.
RESULTS
Totally
80 subjects were participated in the study. Out of 80participants, 40 were type II diabetes forming the study group and the remaining 40 were normal subjects forming the control group. The study group was divided into 2 subgroups based on the duration of diabetes as 2-5 years and 6-10 years.
TABLE I
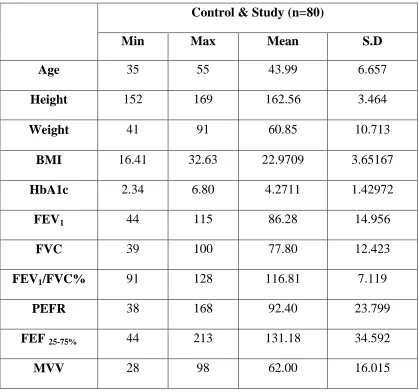
DESCRIPTIVE STATISTICS
Control & Study (n=80)
Min Max Mean S.D
Age 35 55 43.99 6.657
Height 152 169 162.56 3.464
Weight 41 91 60.85 10.713
BMI 16.41 32.63 22.9709 3.65167
HbA1c 2.34 6.80 4.2711 1.42972
FEV1 44 115 86.28 14.956
FVC 39 100 77.80 12.423
FEV1/FVC% 91 128 116.81 7.119
PEFR 38 168 92.40 23.799
FEF 25-75% 44 213 131.18 34.592
MVV 28 98 62.00 16.015
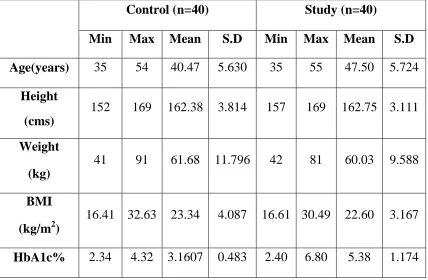
[image:65.595.107.526.149.541.2]TABLE II
Anthropometric parameters of subjects of Control and Diabetic groups
The Mean (±SD) of HbA1c of controls is 3.16 ± 0.482 and for the study group is 5.38 ± 1.174, shows that the controls and study group with good glycemic control are selected for the study.
Control (n=40) Study (n=40)
Min Max Mean S.D Min Max Mean S.D
Age(years) 35 54 40.47 5.630 35 55 47.50 5.724
Height
(cms)
152 169 162.38 3.814 157 169 162.75 3.111
Weight
(kg)
41 91 61.68 11.796 42 81 60.03 9.588
BMI
(kg/m2)
16.41 32.63 23.34 4.087 16.61 30.49 22.60 3.167
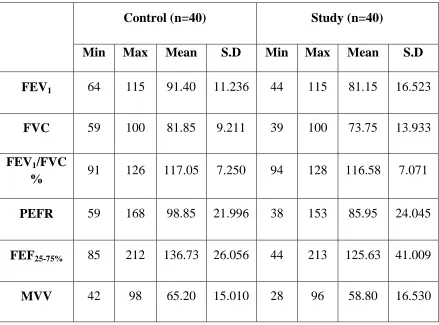
TABLE III
Pulmonary function parameters of subjects of control and diabetic groups
The mean (±SD) of the pulmonary function parameters of both study group and control group are shown in the table.
Control (n=40) Study (n=40)
Min Max Mean S.D Min Max Mean S.D
FEV1 64 115 91.40 11.236 44 115 81.15 16.523
FVC 59 100 81.85 9.211 39 100 73.75 13.933
FEV1/FVC
% 91 126 117.05 7.250 94 128 116.58 7.071
PEFR 59 168 98.85 21.996 38 153 85.95 24.045
FEF25-75% 85 212 136.73 26.056 44 213 125.63 41.009
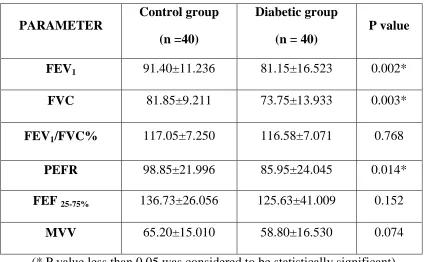
TABLE IV
Comparison of pulmonary function tests parameters between the controls
and type II diabetes
(* P value less than 0.05 was considered to be statistically significant) The mean (±SD) of FEV1 for the control group are 91.40±11.236 and for diabetic group are 81.15±16.523. It was found to be significantly reduced (P = 0.002).
The mean (±SD) of FVC for the control group is 81.85±9.211and for diabetic group is 73.75±13.933. The mean (±SD) of PEFR for the control group is 98.85±21.996 and for diabetic group is 85.95±24.045. The mean values of FVC and PEFR are found to be reduced in diabetic group when compared to controls and are statistically significant.
PARAMETER
Control group
(n =40)
Diabetic group
(n = 40)
P value
FEV1 91.40±11.236 81.15±16.523 0.002*
FVC 81.85±9.211 73.75±13.933 0.003*
FEV1/FVC% 117.05±7.250 116.58±7.071 0.768
PEFR 98.85±21.996 85.95±24.045 0.014*
FEF 25-75% 136.73±26.056 125.63±41.009 0.152
The mean (±SD) of FEV
and for diabetic group is 116.58±7.071. The mean (±SD) of FEF
control group is 136.73±26.056 and for diabetic group is 125.63±41.009. The mean (±SD) of MVV for the control group is 65.20±15.010 and for diabetic group is 58.80±16.530.
The mean values of
[image:69.595.136.507.397.742.2]diabetic group when compared with significant.
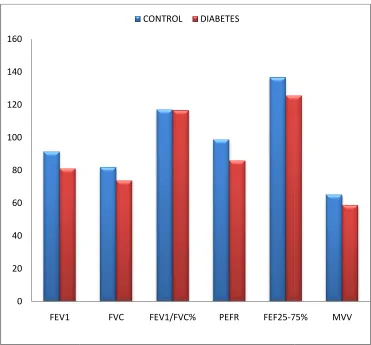
FIGURE 5: Comparison between the controls and type II diabetes
paramet 0 20 40 60 80 100 120 140 160 FEV1
The mean (±SD) of FEV1/FVC% for the control group is 117.05±7.250 and for diabetic group is 116.58±7.071. The mean (±SD) of FEF
control group is 136.73±26.056 and for diabetic group is 125.63±41.009. The mean (±SD) of MVV for the control group is 65.20±15.010 and for diabetic
roup is 58.80±16.530.
The mean values of FEV1/FVC%, FEF25-75% and MVV are reduced in diabetic group when compared with control group but not statistically
: Comparison between the controls and type II diabetes
parameters of pulmonary function tests
FVC FEV1/FVC% PEFR FEF25-75%
CONTROL DIABETES
control group is 117.05±7.250 and for diabetic group is 116.58±7.071. The mean (±SD) of FEF25-75% for the control group is 136.73±26.056 and for diabetic group is 125.63±41.009. The mean (±SD) of MVV for the control group is 65.20±15.010 and for diabetic
and MVV are reduced in but not statistically
: Comparison between the controls and type II diabetes – with
TABLE V
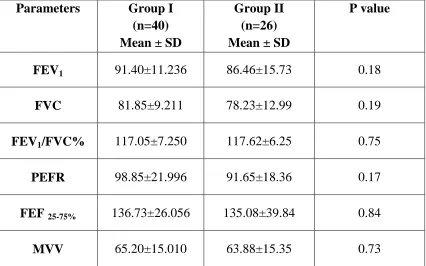
Comparison of pulmonary function parameter based on duration of
diabetes mellitus between 2-5 years.
Parameters Group I
(n=40) Mean ± SD
Group II (n=26) Mean ± SD
P value
FEV1 91.40±11.236 86.46±15.73 0.18
FVC 81.85±9.211 78.23±12.99 0.19
FEV1/FVC% 117.05±7.250 117.62±6.25 0.75
PEFR 98.85±21.996 91.65±18.36 0.17
FEF 25-75% 136.73±26.056 135.08±39.84 0.84
MVV 65.20±15.010 63.88±15.35 0.73
The mean ± SD of FEV1 of diabetics with duration of 2-5yrs was 86.46±15.73 and found to be reduced when compared with the controls, but not statistically significant (P = 0.18) .
The mean ± SD of FVC of diabetics in group II was 78.23±12.99. When compared with the control group, it was not significantly reduced.
Similarly the mean values of (135.08±39.84) and MVV (
[image:71.595.115.521.333.693.2]when compared with control group but not statistically significant.
FIGURE 6: Comparison of pulmonary function parameter based on
duration of diab
0 20 40 60 80 100 120 140 160
FEV1
Similarly the mean values of PEFR (91.65±18.36
) and MVV (63.88±15.35) of group were found to be reduced when compared with control group but not statistically significant.
: Comparison of pulmonary function parameter based on
duration of diabetes mellitus between 2-5 years.
FVC FEV1/FVC% PEFR FEF25-75%
CONTROL GROUP II
91.65±18.36), FEF 25- 75% ) of group were found to be reduced when compared with control group but not statistically significant.
: Comparison of pulmonary function parameter based on
5 years.
TABLE VI
Comparison of pulmonary function parameter based on duration of
diabetes mellitus between 6-10 years.
The mean (±SD) duration of disease for diabetic patients was 8.64 ± 1.23 years.
The mean (±SD) of FEV1, FVC and MVV of study group having diabetes for 6-10years showed a highly significant reduction (P = 0.001) when compared with the control group.
Parameters
Group I (n=40) Mean ± SD
Group III (n=14) Mean ± SD
P value
FEV1 91.40±11.236 71.28±12.29 < 0.001*
FVC 81.85±9.211 65.428±10.97 < 0.001*
FEV1/FVC % 117.05±7.250 114.64±7.80 0.30
PEFR 98.85±21.996 75.35±28.49 0.003*
FEF 25- 75% 136.73±26.056 108.07±35.54 0.003*
The mean (±SD) years was 114.64±7.80 0.30).
FIGURE 7: Comparison of pulmonary function parameter based on
duration of diabetes mellitus between 6
0 20 40 60 80 100 120 140 160
FEV1
(±SD) of FEV1/FVC % of group III having diabetes for 6 114.64±7.80 and it was found to be statistically insignificant
: Comparison of pulmonary function parameter based on
duration of diabetes mellitus between 6-10 years
FVC FEV1/FVC% PEFR FEF25-75%
control group III
of group III having diabetes for 6-10 and it was found to be statistically insignificant (P =
: Comparison of pulmonary function parameter based on
10 years.
TABLE VII
Comparison of pulmonary function parameter based on duration of
diabetes mellitus between 2-5years and 6-10 years.
The mean values of pulmonary function parameters of the diabetic group II and III are compared based on the duration.
The
mean (±SD) values of FEV1, FVC, PEFR, FEF 25- 75% and MVV of type II diabetics with duration 6-10 years was found to be reduced when compared with diabetics of 2-5 years duration and it was found to be statistically significant.Parameters
Group II
(n=16)
Mean ± SD
Group III
(n=14)
Mean ± SD
P value
FEV1 86.46±15.73 71.28±12.29 0.004*
FVC 78.23±12.99 65.428±10.97 0.004*
FEV1/FVC % 117.62±6.25 114.64±7.80 0.21
PEFR 91.65±18.36 75.35±28.49 0.04*
FEF 25- 75% 135.08±39.84 108.07±35.54 0.045*
The
mean (±SD) [image:75.595.113.525.258.627.2]and of group II was117.62±6.25 significant.
FIGURE 8: Comparison of pulmonary function parameter
0 20 40 60 80 100 120 140 160
FEV1
mean (±SD) values of FEV1/FVC % of group III was
117.62±6.25. It was found to be reduced but not statistically
: Comparison of pulmonary function parameter
duration of diabetes mellitus.
FVC FEV1/FVC% PEFR FEF25-75%
GROUPII GROUPIII
of group III was 114.64±7.80 . It was found to be reduced but not statistically
: Comparison of pulmonary function parameters based on
TABLE VIII
Correlation between duration of diabetes and the parameters of lung
function
The lung function parameters FEV1, FVC and MVV showed a significant negative correlation with the duration of diabetes whereas FEV1/FVC %, PEFR, FE