THE TAMILNADU
Dr. M.G.R. MEDICAL UNIVERSITY
CHENNAI
BLOOD LEAD LEVELS IN PRIMARY
HYPERTENSION
DISSERTATION SUBMITTED FOR M.D. DEGREE BRANCH 1
(GENERALMEDICINE)
CERTIFICATE
This is to certify that the dissertation entitled “BLOOD LEAD LEVELS IN PRIMARY HYPERTENSION” submitted by Dr. S. VIDYA, to the Faculty
of Medicine, The Tamilnadu Dr.M.G.R. Medical University, Chennai in partial fulfillment of the requirement for the award of M.D. Degree Branch I (General Medicine) is a bonafide research work carried out by her under our direct supervision and guidance.
Dr. Nalini Ganesh, MD., Prof. Dr. P. Thirumalaikolundusubramanian MD.,
Additional Professor Professor and Head Department of Medicine Department of Medicine Govt. Rajaji Hospital and Govt. Rajaji Hospital and Madurai Medical College Madurai Medical College
DECLARATION
I Dr.S.Vidya, solemnly declare that the dissertation work entitled
“BLOOD LEAD LEVELS IN PRIMARY HYPERTENSION” has been carried
out by me. It was not submitted to the award of any degree / diploma to any university either in part or in full form previously.
This is submitted to the The Tamilnadu Dr.M.G.R. Medical University, Chennai in partial fulfillment of the regulation for the award of M.D. Degree Branch I (General Medicine).
ACKNOWLEDGEMENT
I wish to express my sincere gratitude to my Chief
Dr. NALINI GANESH, M.D., Additional Professor of Medicine for having
helped me at every step in successfully completing this study.
I wish to express my sincere thanks to
Prof. P. THIRUMALAIKOLUNDUSUBRAMANIAN, M.D., Professor and
Head of the Department of Medicine for his sincere advice and co-operation for completing this study.
My heartful thanks go to Assistant Professors Dr.Sooriyakumar,M.D.,
Dr.Premkumar, M.D., Dr.Sivakumar, M.D., for their constant
encouragement, timely help & critical suggestions.
I am also very grateful to our Dean Dr.M.Vasantha,MD., for her kind permission to utilize the clinical material for this study.
I thank my coworker Mr.Vijay Baskar from School of Energy Sciences, Madurai Kamaraj University, Madurai, for his valuable help rendered.
I also thank Mr.Parthasarathy, Statistician, for helping me in statistical calculations.
TABLE OF CONTENTS
Sl. No. Titles Page
1. Introduction 1
2. Aims and Objectives 4
3. Review of Literature 5
4. Materials and Methods 33
5. Results 39
6. Discussion 51
7. Conclusion 56
8. Summary 57
9. Bibliography
10. Proforma
INTRODUCTION
Cardiovascular disease is an epidemic of modern society. Hypertension is one of the most common forms of cardiovascular disease the prevalence of which increases with age. It is one of the most important public health problems and if left untreated can lead to serious morbidity and mortality from cardiac, cerebrovascular and renal diseases.
Metals constitute a major category of toxins that pose a significant threat to health through occupational as well as environmental exposures. One indication of their importance relative to other potential hazards is their ranking by the U.S Agency for Toxic Substances and Diseases Registry, which lists all hazards present in toxic waste sites according to their prevalence and the severity of their toxicity. The first, second, third and sixth hazards on the list are heavy metals; lead, mercury, arsenic and cadmium respectively (Howard Hu et.al 2001.).
laboratory observations are consistent with the hypothesis that high lead levels may be important in the development of primary hypertension in humans. Bagchi et al (2005) has demonstrated that elevated lead levels was associated with an increase in systolic BP in rats.
The interest in blood lead levels as a potential risk factor for cardiovascular disease has ballooned in the last several years with numerous abstracts and research papers, multiple editorials, review articles being published regarding this issue.
While some animal studies have found a positive association between blood lead levels and hypertension some others have come to an opposite conclusion (Shelkovnikov et al 2001). Thus the role of blood lead levels as a risk factor for systemic hypertension remains controversial and further studies regarding the pathogenesis of lead induced hypertension are needed.
Hence an attempt has been made here to study the prevalence of elevated blood lead levels in patients with primary hypertension and its correlation with hypertensive target organ damage.
AIMS AND OBJECTIVES
2. To identify whether any association exists between age, sex and target organ damage and the presence of elevated blood lead levels.
3. To correlate the results with standard data available.
REVIEW OF LITERATURE
HYPERTENSION
problems and despite its widely recognized high prevalence and associated danger, it remains inadequately treated in majority of the patients. It is common, readily detectable, and usually easily treatable and if left untreated can lead to serious morbidity and mortality from cardiac, cerbrovascular, vascular and renal disease. Adequate hypertension control remains elusive because of the asymptomatic nature of the disease for the first 15-20 years even as it progressively damages the cardiovascular system (Kaplan, 1998). Although our understanding of the pathophysiology of hypertension has increased in 90% to 95% of cases, etiology is still mostly unknown.
Definition and Classification:
Blood pressure is distributed in a typical bell shaped curve within the overall population. As seen in the Multiple Risk Factor Intervention Trial (MRFIT), the long-term risks for cardiovascular mortality rise progressively over the entire range of blood pressure, with no threshold that clearly identifies the potential danger. Therefore the definition of hypertension is somewhat arbitrary and usually taken as that level of pressure associated with doubling of long term risks. As per JNC-7 report Hypertension is defined as systolic B.P ≥ 140mm Hg and or diastolic B.P ≥ 90mm Hg. The JNC classification is shown in table 1.
Table 1
Normal <120 and <80
Pre-Hypertension 120-139 Or 80-89
Hypertension Stage 1 Stage 2 140-159 >160 Or Or 90-99 >100 Prevalence:
The prevalence of hypertension depends on both the racial composition of the population studied and the criteria used to define the condition. In a white sub-urban population like that in the Framingham Study, almost one half have blood pressure greater than 140/90 mm Hg. In India as per study conducted by Gupta et al in 1977-78, the prevalence was 59.9 and 69.9 per 1000 in males and females respectively in urban population and 35.5 and 35.9 per 1000 in males and females respectively in rural population.
More than 90% of all hypertensives will have no recognizable cause.
The prevalence of various secondary causes of hypertension is shown in Table -2 (Rudnick et al)
[image:11.612.118.496.81.199.2]
Table -2
Diagnosis Percentage
Essential Hypertension 94%
[image:11.612.140.468.581.699.2]Reno-vascular disease 0.2%
Coarctation of aorta 0.2%
Primary aldosteronism 0.2%
Pheochromocytoma 0.2%
OCP-induced hypertension 0.2%
Natural history and Complications:
The pathological hallmark of uncontrolled hypertension is acceleration of atherosclerosis. The higher the BP, the more likely that various cardiovascular disease will develop prematurely. If untreated, 50% of hypertensive patients die of coronary artery disease or congestive cardiac failure, about 33% of stroke and 10-15% of renal failure. A meta-analysis of nine major prospective studies shows a direct continuous and apparently independent association of diastolic BP with both coronary artery disease and stroke (MacMohan et al, 1990). The various target organ damage due to hypertension is as follows.
[image:12.612.144.468.79.209.2]
Table 3
Target Organ Damage
Heart
Heart failure
Brain
Stroke or transient ischemic attack
Chronic kidney disease
Peripheral arterial disease
Retinopathy
Overall Cardiovascular Risk:
The degree of risk from hypertension can be categorized with reasonable accuracy by taking into account
1. The level of Blood Pressure
2. The presence of target organ damage.
3. The co-existence of other cardiovascular risk factors. (Jackson, et al 1993)
1. Hypertension 2. Cigarette smoking 3. Obesity
4. Physical inactivity 5. Dyslipidemia 6. Diabetes mellitus
7. Microalbuminuria or estimated GFR <60 ml /min 8. Age (>55 for men, >65 for women)
9. Family history of premature cardiovascular disease (<55 for men, <65 for women)
Mechanisms of Primary Hypertension:
No single or specific cause is known for most hypertension and the condition is referred to as primary in preference to essential. Blood Pressure is the product of cardiac output and peripheral vascular resistance (BP = CO × PVR) and increase in blood pressure develops in response to factors which affects these two forces. The development of the disease is slow and gradual.
Genetic Predisposition:
(Harrap,1994). Unquestionably environment plays some role and Harrap (1994) offers an interaction between genes and environment as a working model in which the average population pressure is determined by environment but the blood pressure rank within the distribution is decided by genes. Genetic abnormalities may be monogenic as in Liddle syndrome, glucocoriticoid remediable aldosteronism and apparent mineralocorticoid excess (Luft, 1998) or involves polymorphism of genes involving Renin Angiotension System (Staessen et al, 1999), Aldosterone system or adrenergic receptors.
Fetal Environment:
Low birth weight as a consequence of fetal under nutrition is followed by an increased incidence of high blood pressure later in life (Law and Shiell, 1996). Brenner and Cherton hypothesized that a decreased number of nephrons from the intrauterine growth retardation could very well serve as a permanent irreparable defect that eventuates in hypertension (Brenner and Cherton, 1996)
Renal Retention and Excess of Dietary Sodium:
• A decrease in the filtration surface by a congenital or acquired deficiency in nephron number or function (Brenner, 1992).
• A resetting of pressure-natriuresis relationship (Guyton, 1992)
• An acquired inhibition of the sodium pump (Noolfson et al, 1991).
• Nephron heterogenecity-presence of a subgroup of nephrons that is ischemic either from afferent arteriolar vasoconstriction or from an intrinsic narrowing of the lumen (Sealy et al,1998)
Vascular Hypertrophy:
A number of factors increase peripheral resistance by both functional contraction and vascular remodeling and hypertrophy. Multiple vasoactive substances act as pressure-growth promoters resulting in both vascular contraction and hypertrophy, but perpetuation of hypertension involves hypertrophy. Lever and Harrp postulated (Lever, Harrp1992) that primary hypertension has two mechanisms similar to secondary hypertension (1) a growth promoting process in children, (2) a self –perpetuating mechanism in adults.
A large number of circulatory hormones may be involved in the development of hypertension which causes hypertension by vascular hypertrophy, capillary rarefaction and impaired microvascular dilatation (Pries, 1999).
Sympathetic Nervous Hyperactivity:
Young hypertensives tend to have increased levels of circulating catecholamines, augmented sympathetic traffic in muscles, faster heart rate and heightened reactivity to α-adrenergic agonists (White et al, 1999). These changes raise BP by causing vasoconstriction, increased cardiac output and by altering normal renal pressure-volume relationship.
Renin-Angiostension System (RAS):
aldosterone secretion, which causes retention of sodium and water. Increase in blood pressure inhibits release of rennin from kidney by a feed back mechanism. Thus primary hypertension would be expected to be accompanied by low renin, but only 30% have low renin while 50% have normal levels and 20% have high values. (Brunner, et al. 1973).
Hyperinsulinemia /Insulin resistance:
An association between hypertension and hyper insulinemia has been established not only in obese but also in non obese hypertension (Liese et al, 1998). The hyperinsulinemia of hypertension arises as a consequence of resistance to the effects of insulin on peripheral glucose utilization. Insulin has multiple pressor effects (Cardillo et al, 1998) including activation of sympathetic activity, trophic action on vascular smooth muscle and increased renal sodium absorption. Normally the pressor effects are counteracted by insulin mediated increased synthesis of nitric oxide. In hypertension there is impairment in the insulin mediated increase in nitric oxide leading to rise in blood pressure.
Endothelial Dysfunction
nitric oxide mediated vasodilatory responses (Ruschitzka, et al, 1998).
Other Associated Conditions
LEAD
The very word plumbing comes from the Latin word for lead plumbum.Symptoms of plumbism or lead poisoning were apparent as early as 1st century BC. Worldwide, six sources appear to account for most lead exposure :
1. Gasoline additives 2. Foodcan soldering 3. Lead based paints 4. Ceramic glazes
5. Drinking water systems 6. Cosmetics and folk remedies
Source
Populations are exposed to lead chiefly via paints, cans, plumbing fixtures, and leaded gasoline. The intensity of these exposures, while decreased by regulatory actions, remains high in some segments of the population because of the deterioration of lead paint used in the past and the entrainment of lead from paint and vehicle exhaust into soil and house dust. Many other environmental sources of exposure exist, such as leafy vegetables grown in lead-contaminated soil, improperly glazed ceramics, lead crystal, and certain herbal folk remedies. Many industries, such as battery manufacturing, demolition, painting and paint removal and ceramics, continue to pose a significant risk of lead exposure to workers and surrounding communities.
New research on lead toxicity has been stimulated by advances in toxicology and epidemiology as well as by a shift of emphasis in toxicology away from binary outcomes(life/death:50% lethal dose) to grades of function, such as neuropsychological performance, indices of behavior, blood pressure, and kidney function.
requires the testing of workers who may be exposed to lead in the course of their jobs.
Metabolism
portion of bone, >25 years. Thus, blood lead levels may decline significantly while the body’s total burden of lead remains heavy.
The toxicity of lead is probably related to its affinity for cell membranes and mitochondria, as a result of which it interferes with mitochondrial oxidative phosphorylation and sodium, potassium, and calcium ATPases. Lead impairs the activity of calcium-dependent intracellular messengers and of brain protein kinase C. In addition, lead stimulates the formation of inclusion bodies that may translocate the metal into cell nuclei and alter gene expression.
Clinical toxicology
fashion at blood lead levels well below 1.4 μmol/L (30 μg/dl) and that no threshold for this effect is likely to exist above the lowest measurable blood lead level of 0.05 μmol/L . The impact is greatest when the exposure is of long duration and has been most apparent when it takes place around the age of 2 years; however, the impact of fetal lead exposure remains to be clarified, particularly in view of the observation that maternal bone lead stores can be mobilized to a significant degree during pregnancy, with consequent exposure of the fetus.
creatinine clearance, and decrements in cognitive performance that are too small to be detected as a lead effect in individual cases but nevertheless may contribute significantly to the causation of chronic disease.
An additional issue for both children and adults is whether lead that has accumulated in bone and lain dormant for years can pose a threat later in life, particularly at times of increased bone resorption such as pregnancy, lactation, and senile osteoporosis. Elevation of the bone lead level appears to be a risk factor for anemia, hypertension, cardiac conduction delays, and impairment of cognitive function. Hyperthyroidsm has been reported to cause lead toxicity in adults by mobilizing stores of bone lead acquired during childhood.
Genetic polymorphisms, such as variants of the gene that codes for aminolevulinic acid dehydratase(a critical enzyme in the production of heme) or the C282Y hemochromatosis gene,may confer differences in susceptibility to lead retention and toxicity; ~ 15% of Caucasians have a variant form of one of these genes. This issue is the focus of continued research.
In 1991, the Centers for Disease Control and Prevention designated 0.48
are more sensitive than blood levels as a predictor of hypertension, cognitive impairments, and reproductive toxicity in epidemiologic studies; however, measurement of bone lead levels has not been shown to be of clinical value and is not widely available.
Treatment
current research.
In developed countries lead poisoning is not prevalent; however in developing countries lead poisoning is extremely common, to such an extent that world wide lead toxicity and poisoning remains the most common of occupational poisonings. Developed countries like the US, UK and Germany have taken aggressive steps to combat lead poisoning. In developing countries however, actions have been slower and sporadic. Within the last decade, reports of lead poisoning in humans have poured in particularly from the developing countries faced with environmental and occupational lead exposure.
HYPERTENSION AND LEAD
presentation of lead toxicity (Annest J L et al, 1983). A study in the United States looked at the relationship between blood lead level and high blood pressure and found a direct relationship between blood lead levels and systolic and diastolic blood pressure for men and women, and that blood levels of lead were significantly higher in younger men and women with high blood pressures (Harlan W R 1985). Beevers et al (1980), in an interesting study found that blood lead levels correlate with hypertension in persons exposed to hard water and not in those exposed to soft water. They concluded that low grade exposure from water leads to increased blood lead levels and hypertension.
It is of importance to note that in all of these studies the blood pressure was correlated with slightly elevated lead levels which have been considered to be “safe” and are the result of low level cumulative exposure to lead. These studies indicate very clearly that blood lead levels were found to contribute independently to the elevation of systolic and diastolic hypertension. In some studies bone lead levels were used to measure chronic low level exposure to lead and were found to be elevated in hypertensives. (Cheng et al , 2001) (Stassen et al 1992).
hypertension has usually been directed towards excessive occupational exposure and effects of lead and kidney function, kidney compromise and in turn, effects on high blood pressure. In a study Lee (1996) found that each 10 fold increase in blood lead level was associated with a serum creatinine increase of 0.08mg/dL.
Tsaih et al 2004, says that longitudinal decline of renal function among middle aged and elderly individuals appears to depend on both long-term lead stores and circulating lead. Other studies also concentrate on lead induced nephrotoxicity and hypertension (Pirkle et al, 1985) (Hu H ,2000) (Batuman V, 1993).
There is more and more evidence that chronic low level toxicological exposure to lead has both direct and indirect effects on the blood vessel and its smooth muscle’s contractility and thereby affecting the blood pressure.
Some authors find no statistically significant difference in blood lead levels with respect to target organ damage like left ventricular hypertrophy (Tepper et al 2001)
Mechanism of lead induced hypertension
systems in inducing selective functional impairment. Cormignani etal (2000) have conducted a study in which rats were exposed for ten months to 60 ppm of lead (Pb acetate) in drinking water and the cardiovascular effects of chronic lead were assessed. At the end of treatment, mean lead levels were increased in lead exposed rats. The conclusions derived from their study were:
1. Lead increases plasma levels of noradrenaline and adrenaline 2. Lead increases monoamine oxidase activity in aorta and liver 3. Plasma level of nitric oxide decreases
4. Increases peripheral resistance, cardiac inotropism
5. Increases cAMP dependent availability of Ca ions for contractile mechanism in vascular and cardiac myocells
6. Also increases vascular alpha-2 and myocardial B1 adreno receptor reactivity
7. Also inhibits Kallikrein- Kinin and RAA systems
serum ACE activity in the early phase of lead exposure thus emphasizing the etiological role of ACE activity in lead induced hypertension.
Various similar studies have been conducted in humans to find out the effects of chronic low level lead exposure in the causation of hypertension. A study was conducted by Schwartz et al (2000) in former organolead manufacturing workers to determine the influence of blood lead, DMSA, (meso 2,3-dimercapto succinic acid) chelatable lead and tibial lead on systolic and diastolic blood pressure. They found that blood lead was a predictor of both systolic and diastolic blood pressure and hypertensive status in men less than 58 yrs.
Thus the pathogenesis of lead induced hypertension in multifactorial including such diverse mechanisms as
• Inactivation of endogenous nitric oxide. (Vaziri et al, 2004; Apostoli et al, 2004)
• Down regulation of soluble guanylate cyclase by reactive oxygen species leading to functional deficiency of nitric oxide.
• Heightened sympathetic activity and plasma noradrealine.
• Decreased vascular and increased renal beta adreno receptor density (Chang H R, 2005)
• Increased kininase I and kininase II activites .
• Lead induced inhibition of vascular smooth muscle Na K ATPase causing increased cellular Na+ ,Ca2+
• Possible increase in endothelin and TXA2 generation
• Increase in vasoconstrictive prostaglandins and decrease in vasodilatory prostaglandins.
From the review the following conclusions were arrived at :
The available scientifically reviewed data described above shows that exposure to low levels of lead on a repetitive basis in some population and in some patients can be associated with high blood pressure. These issues of high blood pressure and neurobehavioral charges in relation to lead exposure are commonly missed, not looked for in patients who present with low level toxicological exposure to lead. There is little controversy regarding the issue that lead levels is clinically significant and relevant although its role as an independent risk factor in the causation of hypertension may be controversial.
treating patients.
MATERIALS AND METHODS
Setting : Government Rajaji Hospital and Madurai Medical College, Madurai
Collaborating : School of Energy Sciences
Department : Department of Environment
Madurai Kamaraj University, Madurai
Study Design : Case control study
Period of Study : August 2004 to August 2005 Sample Size : 60 Subjects
Ethical committee : The present project was approved by the approval ethical committee
Inclusion criteria:
Cases:
1. Newly diagnosed drug naïve hypertensive patients attending Out patient(O.P) clinic .
Controls:
Other patients of the same age group attending the O.P clinic.
Exclusion criteria:
1. Individuals less than 30 and more than 50years 2. Patients with renal failure and diabetes mellitus 3. Pregnant women.
4. Patients with secondary hypertension
5. Patients who were already on antihypertensive therapy 6. Postmenopausal women
7. Patients exposed to certain occupations, industries where lead concentration is high (e-g) painters, plumbers etc.
Controls
Subject whose ages were between 30 yrs and 50 yrs and had normal blood pressure.
Consent
The study group thus identified by the above criteria (inclusion and exclusion criteria) were first briefed about the nature of the study. Willing participants were taken up after getting a written informed consent from them.
Thus a total of 30 cases who satisfied the inclusion and exclusion criteria above were taken up for the study. 30 age and sex matched subjects were kept as controls.
Conflict of interest
There was no conflict of interest
Financial support
Nil
Limitations
1. Only drug naïve newly diagnosed hypertensive patients were included in the study. Patients who were already on antihypertensive drugs were not studied.
2. Due to technical, financial and ethical constraints, blood lead levels of only 30 cases and 30 controls could be measured.
method to measure bone lead involves in-vivo K-X-ray fluorescence which is expensive and time consuming. It is not practical for studies and hence was not done.
4. Due to literary constraints, original copy of all the articles could not be obtained. Only abstracts of those articles were obtained.
5. Cigarette smoking and urbanization as confounding factors were not eliminated.
6. It is only a cross sectional study. Long term follow up was not done.
7. Vancouver’s method of Bibliography was not followed. Instead Harvard method was followed.
Methods:
Selected socio-demographic, clinical and laboratory data were elicited from the patients and controls and recorded in a proforma (enclosed in Annexure –annexure I)
I. Socio –demographic data
II. Clinical data
Systolic and diastolic blood pressure Clinical examination
III. Laboratory data
Blood urea : Estimation done manually using Diacetyl Monoxime (DAM) technique.
Serum Creatinine : Estimation done using COBAS autoanalyser
Blood lead levels : Measured using atomic absorption Spectro Photometry
IV. Statistical Analysis
Data was entered in Microsoft excel spread sheet and analyzed statistically using standard statistical software (Epidemiological information package 2002). Student ‘t’ values was applied for significance. Significance was considered if the ‘p’ value was below 0.01.
DEFINITIONS USED IN THE PRESENT STUDY
Essential Hypertension
blood pressure 140 mmHg and above and or diastolic blood pressure 90mm Hg above.
In newly detected cases it was the mean of 3 relaxed, seated right arm readings. The diagnosis that the hypertension is essential and not secondary was made on the overall clinical impression only. Laboratory investigations to rule out secondary causes was not done in each case.
Diabetes mellitus
• Already a known case of diabetes mellitus on treatment • Fasting plasma glucose ≥126 mg/dl
• Two hour plasma glucose ≥200mg/dl
• Symptoms of diabetes plus random blood glucose >200 mg/dl
Left ventricular hypertrophy
Based on electrocardiographic findings satisfying either Sokolow-Lyon criteria or Cornell Voltiye criteria (Sokolow, Lyon,1949) (Casale, et.al,1987).
Hypertensive retinopathy
Based on Keith- Wagener-Barker classification of fundoscopic changes.
RESULTS
Table – 1
Age distribution of cases and controls
Cases Controls
Age group No % No %
30-40 5 16.6 7 23.3
40-50 25 83.4 23 76.7
Total 30 100 30 100
Mean age 45.9 43
SD 5.73 4.24
p value = 0.0325
This table compares the mean age of cases and controls. There is no statistically significant difference in the ages of cases of controls. Hence the study is matched for age.
Table – 2
Sex distribution of cases and controls
Cases Controls
Sex No % No %
Male 19 63.3 18 60
[image:42.612.118.497.596.699.2]Total 30 100 30 100
This table compares the sex distribution in cases and controls. There is no significant difference in the distribution with respect to sex.
Table – 3
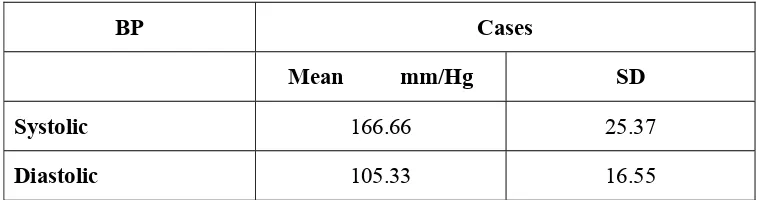
Blood Pressure Distribution among cases
BP Cases
Mean mm/Hg SD
Systolic 166.66 25.37
[image:43.612.99.478.602.702.2]The mean and standard deviation for systolic blood pressure among cases were 166.66 and 25.37 respectively. Similarly for diastolic blood pressure the mean and S.D among cases were 105.33 and 16.55 respectively.
[image:44.612.99.481.556.683.2]
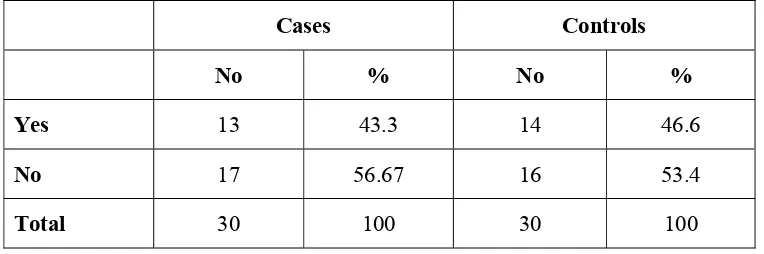
Table – 4
Distribution of cases and controls in relation to smoking
Cases Controls
No % No %
Yes 13 43.3 14 46.6
No 17 56.67 16 53.4
In the study population the distribution of smoking is not significantly different among cases of controls.
Table – 5
Distribution of cases and controls with respect to
Target Organ Damage (TOD)
TOD Cases
No Percentage
LVH Yes 12 40
No 18 60
No 28 93.7
HPR Yes 6 20
No 24 80
The details of prevalence of target organ damage TOD among cases [left ventricular hypertrophy (LVH), Ischemic heart disease (IHD) and hypertensive retinopathy HTR] are given.
Analysis of cases with respect to target organ damage revealed the presence of various target organ damage in the form of
Left ventricular hypertrophy LVH (n=12 ; 40%) Ischemic heart disease IHD (n=2 ; 6.3%)
And hypertensive retinopathy (n=6; 20%)
Table – 6
Distribution of cases and controls with respect to
biochemical parameters
Cases Controls Blood
parameters Mean SD Mean SD P
Bl.sugar 103.8 21.9 86.2 ± 6.20 0.000101
Urea 27.36 4.48 24.93 ± 2.40 0.0126
There is a statistically significant difference in cases and control with respect to blood sugar and urea. This may be due to high comorbidity of impaired glucose tolerance in hypertensives. But with respect to creatinine which is more sensitive marker for renal function and also could be a confounding factor in hypertension, there is no statistically significant difference between cases and controls. Hence, there is no much difference with respect to renal function between cases to controls.
Table – 7
Distribution of cases and controls in relation to blood lead levels
Cases Controls
Mean SD Mean SD p value
Bl.Pb levels
µg/dl 25.34 ± 7.59 7.36 ± 3.62 0.0000001
The mean blood level is 25.34 µg/dl (SD 7.59) in cases and 7.36 µg/dl (SD 3.62) in controls. This table clearly shows that blood lead level is significantly higher in hypertensive patients.
Table – 8
Distribution of blood lead levels ≥10 µg /dl in cases and controls
Cases Controls
No % Mean SD No % Mean SD
Bl.Pb levels≥10
µg/dl 30 100 25.34 ±7.59 11 36.7 11.4 ±1.22
As a blood lead level of 10μg/dL is defined as the level of concern by many authorities, (Hu et al, 2001) the distribution of blood lead level ≥10μg/dL was sought.
All cases had blood lead level ≥ 10μg/dL while 11 (36.7%) controls had blood lead level ≥10μg/dL. All these controls were found to be smokers. Hence this explains increased blood lead levels in them. Using students ‘t’ test p was found to be < 0.01.
[image:49.612.101.479.493.687.2]Hence the prevalence of high blood lead level above the level of concern is statistically high in cases than in controls.
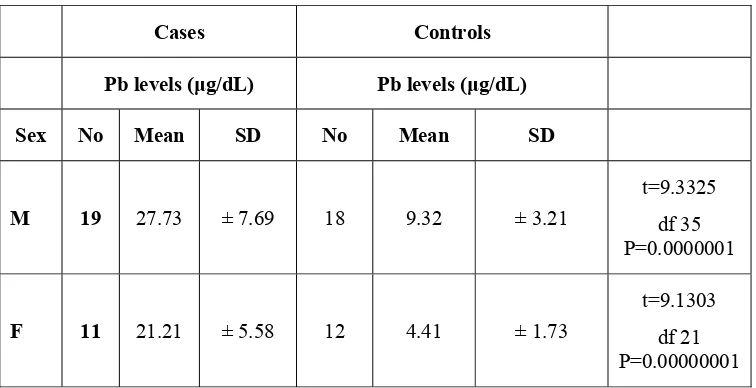
Table – 9
Mean Pb levels in relation to sex
Cases Controls
Pb levels (μg/dL) Pb levels (μg/dL)
Sex No Mean SD No Mean SD
M 19 27.73 ± 7.69 18 9.32 ± 3.21
t=9.3325 df 35 P=0.0000001
F 11 21.21 ± 5.58 12 4.41 ± 1.73
t=2.5775 df 28 P=0.01 t=5.234 df 28 P=0.0000144
From the table it can be seen that in both cases and controls there is statistically significant difference in blood lead levels between males and females.
This could be due to the effect of smoking on blood lead levels.
[image:50.612.102.480.78.145.2]But compared with controls in either sex the cases have statistically significant high values in blood lead levels.
Table – 10
Smoking and Blood lead levels
Blood lead level in μg/dL
Cases Controls
Smoking No Mean SD No Mean SD
Yes 13 30.55 7.68 14 10.7 1.75
t=8.7840 df 35 P=0.000001
No 17 21.36 4.62 16 4.36 1.49
P=0.001 P0.0000001
This table clearly shows that there is statistically significant difference in blood lead levels among smokers and non smokers.
[image:51.612.101.481.530.712.2]In cases (p = 0.01) as well as in controls (p < 0.001) smoking is associated with high blood lead levels.
Table – 11
Blood lead levels with respect to target organ damage TOD
The mean blood lead levels and standard deviation for cases with and without target organ damage is given below.
TOD No Mean
(μg/dL)
SD P
LVH Yes 12 29.69 ± 7.80 0.014
[df 28 t =2.61]
No 18 22.45 ± 6.06
IHD Yes 2 27.35 ± 3.74 0.5962
t =0.53]
No 28 25.20 ± 7.81
Retinopathy Yes 6 31.61 ± 9.53 0.0898
[df 28 t =1.757]
No 24 23.77 ± 6.33
With regards to target organ damage, though there is some increase in blood lead levels in those with target organ damage compared to those without, the difference is not statistically significant.
DISCUSSION
Hypertension, the most common form of cardiovascular diseases, is one of the most important risk factors for significant morbidity and mortality in human race. Though the cause of essential hypertension is elusive, lead is associated with hypertension.
A number of studies have found that increased blood lead levels strongly correlate with increased systolic as well as diastolic blood pressure (Brautbar et al, 1995; Telisman et al, 2004; Sirivarasai et al, 2004).
Tepper et al,( 2001) also found increased blood lead levels in hypertensive patients compared to normotensives.
Sirivarasai (2004) in a study of 212 men found that an increase in blood pressure was significantly predictive of increasing blood lead (p<0.001)
Similar to those studies, in our study, the mean lead value was 25.34 µg/dl ±7.59 among cases and 7.36 µg/dl ± 3.62 among controls. Thus there is statistically significant increase in blood lead levels in hypertensives compared to normotensives in our study.
Some studies found a correlation between blood lead levels and hypertension only in selected populations.
Vupputuri et al (2003) found high blood level only in hypertensive black men.
In our study due to technical constraints, the effect of lead present in drinking water on blood lead levels could not be studied.
In some studies blood lead levels do not correlate with hypertension. Cheng et al (2001) and Telisman et al (2004) found no correlation between blood lead levels and hypertension .But they have found strong correlation between bone lead level (which measures chronic low grade exposure ) and hypertension .But those studies were done in developed countries. Exposure to lead and hence blood lead level vary greatly between countries depending upon the environment.
The mean blood lead value was 25.34 µg/dl for cases and 7.36 µg/dl for controls in our study. When we compare this with other studies this is higher. In Vupputuri et al (2003) study the mean blood lead value was 5.4 ± 0.2 for men and 3.4 ± 0.1 for women.. Schwartz et al (2000) also found increased blood pressure in patients with blood lead level as low as 5 µg/dl.
The percentage of persons above blood lead level 10 µg/dl in cases is100% where as in controls it is 36.7%. All those controls were smokers. Though absolutely no blood lead level is safe, many authorities have defined a level of 10 µg/dl as a value of concern (Hu 2001).Hence it can be said that hypertensive patients have blood lead level above the level of concern.
In our study, there is also a significant sex difference in blood lead levels . From table 9 it is seen that in both cases and controls, males have high blood lead values than controls. This is similar to the studies of Vupputuri et al( 2003 )(Men 5.4±0.2 women 3.4±0.1 p<0.001). The difference could be due to many factors. Men are more exposed to smoke, industrial pollution, automobile exhaust etc., than women. The values are still higher in developing countries due to men exposed to higher level of environmental lead.
With reference to target organ damage, in our study, there was a slight increase in blood level among those with target organ damage compared with those who do not. The difference , however, is not statistically significant. Tepper et al (2001) has similar findings in his study. There was no convincing evidence of association between lead and other blood pressure related outcomes in his study, though there was an effect of blood lead on blood pressure.
Blood pressure is clearly increased by high blood lead levels in our study. Blood lead level is increased by chronic low grade exposure and the prohypertensive effect of lead occurs at blood lead levels which are very much below those that are associated with clinically significant symptoms like neurological behavioral manifestations.Hence the need to identify patients exposed to sub threshold values becomes important. This is much more important in developing countries with high environmental exposure and less rigid pollution control measures. Identifying & intervening hypertensives with high lead levels at an early stage may halt the progress of a debilitating illness.
Measurement of lead exposure can be difficult as more accurate methods like measuring bone-lead levels are not available freely. More studies in this area and more prospective studies with respect to outcome measures are the need of the hour.
1. Blood lead level was significantly elevated in persons with hypertension (Mean 25.34±7.59 μg/dL) than normotensive controls (Mean 7.36±3.62
μg/dL).
2. Blood lead level was ≥ 10 μg/dL in all the cases(100%).In controls it was 36.7%. Blood lead level of 10μg/dL is defined as the value of concern by many.
3. There is a statistically significant difference between males & females with respect to blood lead values in both cases and controls.
Cases : Males → 27.73 ± 7.69 μg/dL ; Females → 21.21 ± 5.58 μg/dL Controls : Males → 9.32 ± 3.21 μg/dL ; Females → 4.41 ± 1.73 μg/dL
4. There is a statistically significant difference between smokers and non-smokers with respect to blood lead levels in both cases as well as controls.
Cases: Smokers → 30.55 ± 7.68 μg/dL ; Non Smokers → 21.36 ± 4.62 μg/dL
Controls: Smokers → 10.7 ± 1.75 μg/dL ; Non Smokers → 4.36 ± 1.49 μg/dL
5. Blood lead levels were not significantly elevated in patients with target organ damage compared to those without.
Blood lead level strongly correlates with hypertension. The present study was aimed to study the blood lead level in patients with primary hypertension and to find out its association with sex, smoking status and target organ damage. With rigid criteria 30 patients were selected and evaluated on social, clinical and laboratory aspects after institutional ethical clearance with an informed consent. The data were entered in computer and analyzed statistically.
The controls were matched for age and sex compared to cases. There were 19 males and 11 females in the case group and 18 and 12 respectively in control group. The mean systolic BP was 166.66 mmHg and 105.33mmHg diastolic.
The percentage of those with target organ damage were 40%, 6.3% and 20% respectively for LVH, IHD and retinopathy. There is no correlation between increased blood level between those with and without target organ damage.
Animal & human studies have found correlation between blood lead levels and hypertension. In view of the increased industrialization and poor environmental surveillance, it is prudent to explore blood lead levels in hypertensives especially those with chronic low grade exposure.
BIBLIOGRAPY
1. Annest JL, Pirkle JL, Makue et al. Chronological trend in blood lead levels between 1976 and 1980. New England Journal of Medicine 1983; 308: 1373-1377.
La medicinae de larvo 2004; 2 :124-32.PMID(15218744)Abstract.
3. Bagchi D, Peuss HG . Effects of acute and chronic exposure of lead on blood pressure and bone mineral density in rats. Journal of inorganic biochemistry 2005; 99(5) :1155-64.PMID (15833339)-Abstract
4. Batuman V .Lead nephrology, Gout and hypertension American Journal of Medical Sciences 1993; 305: 241-247.
5. Beevers DG, Cruickshank JK, Yeoman WB et al .Blood lead and cadmium in human hypertension. Journal of environmental pathology & toxicology 1980 ; 4 : 251-60.
6. Beevers DG, Erskine E, Robertson M et al . Blood lead and hypertension. Lancet 1976; 2 :1-3.
7. Bost L, Primatesta P, Dong W et al . Blood lead and blood pressure : evidence from the Health survey for England 1995 . Journal of Human hypertension 1999 ;13(2) :123-8.
8. Brautbar N . Low level environmental exposure, lead poisoning effects, neurobehavioral changes, hypertension . Proceedings of Royal society of medicine 1995;9:295-300.
9. Brenner BM, Chertow G M . Congenital oligonephropathy : An inborn cause of adult hypertension and progressive renal injury?. Current opinion in Nephrology & Hypertension 1993; 2:691
surface area, blood pressure and chronic renal disease. Journal of Cardiovascular Pharmacology. 1992; 19 (Suppl-1).
11.Cardillo C, Killocoyne CM, Nambi S etal . Vasodilator response to systemic but not to total hyperinsulnemia in the human forearm. Hypertension 1998;32:740.
12.Carmignani M, Volpe AR ,Boscolo P, etal . Catecholamine and nitric oxide systems as targets of chronic lead exposure in inducing selective functional impairment. Life Science 2000 ; 15: 68(4) :401-15.PMID(11205890).Abstract.
13.Chang HR, Tsao DA, Yu HS etal . The change of beta-adrenergic system after cessation of lead exposure . Toxicology 2005 ;1 207(1): 73-80.
14.Cheng Y, Schwart J, Sparrow D etal – Bone lead and blood lead levels in relation to baseline blood pressure and the prospective development of hypertension : The normative aging study .American Journal of Epidemiology 2001 ; 15-153(2) :164-71.PMID(11159162)-Abstract.
16.Guyton A C . Kidneys and fluids in pressure regulation : small volume but large pressure change. Hypertension 1992 :(Suppl.) 2. 17.Harlan WR, Landis JR, Schnaouder RL, et al. Blood lead and
blood pressure : relationship in the adolescent and adult WS population. JAMA 1985 ;253 :530-534.
18.Harrap SB. Hypertension: genes versus environment. Lancet 1994;344:169.
19.Howard Hu. Heavy metal poisoning Harrison’s Principles of Internal medicine 15th ed. 2001 :2591-92.
20.Hu H : Exposure to metals : Primary care 2000; 27 :983-996. 21.Jackson R, Barham P, Bills J etal: Management of raised blood
pressure in New Zealand : A discussion document .BritishMedicalJournal 1993; 307:107
22.JNC 7 .The seventh report of the Joint National Committee on Prevention, Detection, Evaluation and Treatment of high blood pressure U.S. NIH Publication No.03-5233; 2003.
23.Kaplan NM . Primary hypertension : Pathogenesis in Clinical hypertension. Baltimore, Williams and Wilkins 1998, pp.41-101.
literature . Journal of Hypertension 1996; 14:935.
25.Lee TH .Lead exposure : a risk factor for hypertension and renal disease . Journal Watch 1996 ;5: 7-9 .
26.Lever AF, Harrap SB . Essential Hypertension : A disorder of growth with origins in childhood?. Journal of Hypertension 1992;10:101.
27.Luft FC . Molecular genetics of human hypertension. Journal of Hypertension 1998; 16:1871.
28.Mac Mohan S, Peto R, Cutler J, et al . Blood pressure, stroke and coronary artery disease : Prolonged difference in blood pressure : Prospective observational studies corrected for regression dilution bias. Lancet 1990; 335:765
29.Pirkle Jl, Schwartz J, Landis etal . The relationship between blood levels, and blood pressure and its cardiovascular risk implications. American Journal of Epidemiology 1985; 121:246-258.
30.Pries AR, Secomb TW, Gachtgens P . Structural autoregulation of terminal vascular beds : Vascular adaptation and development of hypertension . Hypertension 1999;33:153
family practice. Canadian Medical Association Journal 1977;3:493.
32.Ruschitzka F, Corti R Noll G, Luschar TF . A Rationale for treatment for endothelial dysfunction in hypertension. Journal of Hypertension 1999;17(suppl-1) 25.
33.Sealey J.E, Blurenfeld JD, Bell et al .On the renal basis for hypertension Journal of Hypertension 1988; 6:763
34.Sharifi AM, Aarabi R, Akbarcoo N, et al . Investigation of circulatory and tissue ACE activity during development of lead induced hypertension. Toxicology letter 2004; 2 153(2) :233-8. 35.Shelkovnikov SA, Gonick HC . Influence of lead on rat thoracic
aorta contraction and relaxation .American Journal of Hypertension 2001; 14: 873-8.
36.Shwartz BS, Stewart WF – Different associations of blood lead ,meso 2,3- dimercapto succinic acid (DMSA) -chelatable lead and tibial lead levels with blood pressure in 543 former organo lead manufacturing workers. Archieves of environment and health 2000; 55(2) : 85-92.
Pacific Journal of Public Health 2004 ;16(2):
133-7.PMID(15624792)
38.Sokolow H, Lyon T . The ventricular complex in left ventricular hypertrophy as obtained by unipolar precordial and limb leads. American Heart Journal 1949; 37:161.
39.Staesson JA, Kuznetsova T, Wang J et al . M2357 Angiotensin gene polymorphism and cardiovascular renal risks. Journal of Hypertension 1999;17:9
40.Staesson JA, Lawerys RR, Buchet JP . Impairment of renal function with increasing blood lead concentration in the general population; the Cadmibel study group. New England Journal of Medicine 1992;327: 151-156.
41.Telisman S, Pizent A, Jurasovic et al. Lead effect on blood pressure in moderately lead exposed male workers. American Journal of industrial medicine 2004; 45(5):446-54.PMID(15095427)-Abstract.
43.Tsaih SW, Korrick S, Schwartz J et al . Lead diabetes, hypertension and renal function : the normative aging study . Environmental health perspective 2004 ;112(11) : 1178-82.PMID(15289163)
44.Vaziri ND Sica DA . Lead induced hypertension role of oxidative stress Current hypertension Repertoire 2004; 6(4): 314-20. 45.Vupputuri, Jiang HO, Paul Muntner et al. Blood lead level is
associated with elevated blood pressure in Black men. Hypertension 2003; 41:463-468
46.White M, Pourney A, Mikes E, Leenen FH. Effects of age and hypertension and cardiac responses to the α1 agonist phenylephrine in humans. American of Journal Hypertension 1999;12:151.
PROFORMA
Name : Age: Sex: Occupation:
Presenting Complaints : Duration: Chest Pain
Breathlessness Palpitation Giddiness Headache Smoking
Anemia Cyanosis Pedal edema JVP
PR BP Fundus
Systemic Examination
CVS : Apical impulse position Character
Thrill / Murmur S1S2
A2 intensity
RS P/A CNS
INVESTIGATIONS
Blood Sugar ECG
Urea
Serum Creatinine