SERUM URIC ACID LEVEL IN TYPE 2
DIABETES MELLITUS
Dissertation submitted
in partial fulfillment for the Degree of
DOCTOR OF MEDICINE
BRANCH I - M.D., (General Medicine)
SEPTEMBER 2006
DEPARTMENT OF MEDICINE
MADURAI MEDICAL COLLEGE
THE TAMILNADU DR.M.G.R. MEDICAL UNIVERSITY
CERTIFICATE
This is to certify that this dissertation titled “SERUM URIC ACID
LEVEL IN TYPE 2 DIABETES MELLITUS” submitted by DR.S.SENTHUR
RAJA PANDIAN to the Tamil Nadu Dr.M.G.R. Medical University, Chennai is in partial fulfilment of the requirement for the award of M.D. Degree Branch I
(General Medicine) and is a bonafide research work carried out by him under
direct supervision and guidance.
DR. D.D. VENKATRAMAN, M.D., DR.NALINI GANESH.M.D.,
Additional Professor, Professor and Head,
Department of Medicine, Department of Medicine, Govt. Rajaji Hospital, Govt. Rajaji Hospital, Madurai Medical College, Madurai Medical College,
Madurai. Madurai.
DECLARATION
I DR. S. SENTHUR RAJA PANDIAN declare that I carried out this work on “SERUM URIC ACID LEVEL IN TYPE 2 DIABETES MELLITUS” at
Department of General Medicine, Government Rajaji Hospital during the
period of January 2005 – February 2006. I also declare that this bonafide work
or a part of this work was not submitted by me or any others for any award,
degree, diploma to any university, board either in India or abroad.
This is submitted to the Tamilnadu Dr.M.G.R. Medical University,
Chennai in partial fulfillment of the rules and regulation for the M.D. Degree
examination in General Medicine.
Govt. Rajaji Hospiptal, DR.S.SENTHUR RAJA PANDIAN Madurai.
ACKNOWLEDGEMENT
At the outset I wish to thank our THE DEAN for permitting me to carry
this study in our hospital.
I am extremely thankful to the Professor and Head of the Department of
Medicine Dr.NALINI GANESH M.D., for her able guidance and advice in
every aspect of the study.
I sincerely thank Prof. Dr. Thirumalai Kolundu Subramanian. M.D.,
for his moral support encouragement and valuable guidance to this study.
I wish to express my respect and sincere gratitude to my beloved teacher
Prof. Dr.D.D. VENKATRAMAN. M.D., for his valuable guidance.
My heartful thanks goes also to my unit Assistant Professors
Dr.M.Natarajan M.D., and Dr.P.K.Ganesh Babu M.D., for their
encouragement and support in completing this study.
I thank my co-post graduates for helping me in this study.
Last but not the least I sincerely thank all those patients who participated
CONTENTS
SL.NO TITLE PAGE NO.
1. TITLE PAGE i 2. CERTIFICATE ii
3. DECLARATION iii
4. ACKNOWLEDGEMENTS iv 5. CONTENT v
6. ABBREVIATIONS vi
7. INTRODUCTION 1 8. AIMS AND OBJECTIVES 3
9. REVIEW OF LITERATURE 4 10. MATERIALS AND METHODS 36 11. DEFINITIONS USED IN THIS STUDY 40
12. RESULTS 42 13. DISCUSSION 58 14. CONCLUSION 63
15. RECOMMENDATIONS / SUGGESTIONS 64 16. SUMMARY 65
ANNEXURE
I. BIBLIOGRAPHY
II. MASTER CHART
III. PROFORMA
ABBREVIATIONS
IDDM - Insulin Dependent Diabetes Mellitus
NIDDM - Non Insulin Dependent Diabetes Mellitus
CAD - Coronary Artery Disease
JNC - Joint National Committee
IHD - Ischemic Heart Disease
G.D.M - Gestational Diabetes Mellitus
SUA - Serum Uric Acid
HT - Hypertension
BMI - Body Mass Index
WHR - Waist Hip Ratio
DOD - Duration of Diabetes
B.S - Blood sugar
P.G - Plasma Glucose
MI - Myocardial Infarction
I - Ischemia
S.D - Standard Deviation
IFG - Impaired Fasting Glucose
IGT - Impaired Glucose Tolerance
INTRODUCTION
Cardiovascular disease is an epidemic of modern society. Type 2
diabetes mellitus is an epidemic in India for the past few decades. Diabetes
mellitus is the most important risk factor associated with two to four fold
increased incidence of coronary artery disease.
Nearly 120 years have elapsed since uric acid was first described as a
potential risk factor in the development of cardiovascular disease1.
Hyperuricemia is one of the component of syndrome – X2. Serum uric
acid is a potential cardiovascular disease risk factor has ballooned in the last
several years with numerous abstracts and research papers, multiple editorials,
and review articles.
The four major risk factors for CAD viz., hypercholesterolemia,
hypertension, diabetes mellitus, and cigarette smoking which were present in
Framingham’s cohort are difficult to explain among Indians with CAD. CAD in
Indians is present even with low cholesterol level. Obesity, systemic
hypertension, hypercholesterolemia is associated with NIDDM, as a result of
Much but not all epidemiological research identifies hyperuricemia is a
independent risk factor for the development of cardiovascular disease and renal
disease, particularly patients with hypertension or congestive heart failure and
in women3.
Some have found a significant and specific independent association
between uric acid level and cardiovascular mortality and morbidity, while
others have come to an opposite conclusion. Thus despite abundant
epidemiological evidence, the role of increased serum uric acid and
cardiovascular risk is controversial.
Here an attempt has been made to study the level of serum uric acid in
type 2 diabetes mellitus and the correlation between elevated serum uric acid
level and the component of metabolic syndrome like obesity, hypertension,
dyslipidemia.
AIMS AND OBJECTIVES
1. To identify the level of uric acid in patients with type 2 diabetes mellitus.
2. To identify whether any association exist between age, sex,
anthropometric measurements (BMI, WHR), hypertension, dyslipidemia
REVIEW OF LITERATURE
Diabetes mellitus – Type 2
The previously used terminology is non insulin dependent diabetes
mellitus (NIDDM). Type 2 diabetes mellitus begins in the middle age or after
40 years. It is not uncommon to come across the development of diabetes in
third decade itself in our country.
Diagnosis
The national diabetes data group (1979) and World Health Organization
(1985) have issued diagnostic criteria for diabetes mellitus4.
1. Symptoms of diabetes and random blood sugar concentration
≥ 200mg/dl.
2. Fasting plasma glucose ≥126mg/dl.
3. 2 hr plasma glucose (postprandial) ≥200mg/dl during an oral glucose
tolerance test.
4. IGT - Impaired Glucose Tolerance is present when fasting level is ≤126
and 2. hr value in the range of 140-200mg/dl.
5. IFG – Impaired Fasting Glucose when the fasting level is >110 and
Table 1: Diagnostic Criteria for diabetes mellitus
Category Fasting p.g 2 hr p.g.
Normal <110mg/dl <140mg/dl
Diabetes ≥126mg/dl ≥200mg/dl
IFG 110-125mg/dl -
IGT - 140-199mg/dl
Importance of IFG and IGT
There is no clear consensus (with current evidence) on whether IFG and
IGT should be classified as disease, but they clearly represent risk factors and
risk markers for diabetes and CVD, respectively. Both IGT and IFG are
similarly associated with increased risk of diabetes, but IGT is more strongly
associated with CVD outcomes. Risks are higher when IFG and IGT coexists.
Lifestyle interventions are highly effective in delaying or presenting the onset
of diabetes in people with IGT and may reduce CVD and total mortality.
Epidemiology
The worldwide prevalence of diabetes mellitus has risen dramatically
over the past two decades. Although the prevalence of both type 1 diabetes
mellitus, and type 2 diabetes mellitus is expected to rise more rapidly in the
prevalence of diabetes mellitus was estimated to be 0.19% in people <20 years
old, 8.6% in people >20 years old. In individuals >65 years the prevalence of
diabetes mellitus was 20.1%. The prevalence is similar in men and women
throughout most age ranges but is slightly greater is men >60 years. The
prevalence of type 2 diabetes mellitus and its harbinger IGT, is highest in
Pacific island, intermediate in our country and United States and relatively low
in Russia and China. This variability is likely due to genetic, behavioural, and
environmental factors.
On analysis of the trend in the epidemiology of diabetes, Mccarty and
Zimmet (1994) have estimated, by projection, the change of prevalence of
diabetes around the globe by 2010 (Table 2).
Type of Diabetes
1994 2000 2010
GLOBAL IDDM NIDDM Total 11.50 98.90 110.40 18.10 157.30 175.40 23.70 215.60 239.30 INDIA IDDM NIDDM Total 1.80 15.70 17.30 3.31 28.99 32.30 4.70 42.20 46.90 CHINA IDDM NIDDM Total 0.57 7.20 7.77 1.40 18.40 19.80 2.26 29.59 31.85 USA IDDM NIDDM Total 1.48 12.30 13.78 1.67 13.90 15.57 1.86 15.57 17.43 JAPAN IDDM NIDDM Total 0.39 5.18 5.57 0.40 5.30 5.70 0.41 5.40 5.81
*Ref: Maccarty and Zimmet (1994)
This table showing High prevalence of Diabetes in India and contributes
5.08% of Diabetes world wide. Japan has relatively Low incidence of Diabetes.
Pathogenesis of type 2 diabetes mellitus
Insulin resistance and insulin secretion are central to the development of
type 2 diabetes mellitus.
Beta cell dysfunction is the major genetic component contributing to the
development of type 2 diabetes mellitus5. The beta cell mass is mildly reduced
especially when obesity is taken in to account. Type 2 diabetes mellitus is a
genetically programmed failure of the beta cell to compensate for insulin
resistance6.
2. Insulin resistance
The variability is insulin response was first documented by Himsworth.
Who subsequently used glucose insulin sensitivity test to assess individual
sensitivity to insulin7. Over three decades later, Reaven and coworkers (1966)
introduced a new method for estimation of insulin mediated glucose uptake by
peripheral tissues. Further Reaven aroused widespread interest on insulin
resistance and disorders associated with it through his banting oration of 1987.
3. Genetic factors
Charack, and Susrutha, the ancient Indian physicians who first described
Madhu Meha (diabetes) had stipulated that the disorder was genetically
determined and hence incurable.
Results from cross sectional and longitudinal studies of families mono
and dizygotic twins, offspring of diabetic parents both or either sibs and other
first degree relatives of diabetic probands strongly indicate the genetic basis of
diabetes8.
Although both impaired beta cell secretion and insulin resistance are
basically inherited, acquired factors play an important role in the unmasking of
type 2 diabetes mellitus. They are
Beta cell cytotoxic chemical or viruses
Autoimmunity
Ageing, obesity
TNF α, leptin Physical inactivity
Diet
Risk factors for type 2 diabetes mellitus (ADA, 2004)9:
Family history of diabetes
Obesity BMI >25kg/m2
Physical inactivity
Previously identified IFG and IGT
History of GDM
Systemic hypertension (Bp: ≥140/90mmHg)
HDL level ≤35mg/dl, TG level ≥250mg/dl
Poly cystic ovarian disease or acanthosis nigricans
History of vascular disease
(Source: Adopted form American Diabetes Association (ADA) : 2004)
Diabetes mellitus
Acute complications Chronic complications
1. Diabetic Microvascular macrovascular
ketoacidosis complications complications
2. Nonketotic 1. Retinopathy 1. Coronary
hyperosmolar coma artery disease
3. Hypoglycemia 2. Neuropathy 2. Peripheral 4. Lactic acidosis 3. Nephropathy vascular
disease 3. Cerebro vascular disease Others
1. Gastrointestinal –gastroparesis, diarrhea 2. Genitourinary – uropathy / sexual dysfunction 3. Dermatological – acanthosis nigricans.
4. Infections 5. Cataract 6. Glaucoma
Other names
Metabolic syndrome
Syndrome X
Reaven syndrome
History
In 1973, patients with anginapectoris with angiographically normal
coronary arteries were recognized receiving the label of syndrome X and
patients with this syndrome were also reported to have hyperinsulinemia.
In 1988, Reaven postulated the link between insulin resistance, obesity,
systemic hypertension and dyslipidemia (high TG, Low HDL) and
cardiovascular disease.
Again in 1993, Reaven gave an expanded definition of syndrome X.
In 1989 Kaplan also discussed deadly quartet associated with insulin
resistance – central obesity, hypertension, impaired glucose tolerance, and
hypertriglyceridemia.
In 1991, Defronzo and Ferraninni discussed the multifaceted nature of
insulin resistance syndrome. Subsequent addition to the syndrome were small
dense LDL, increased proinsulin, microalbuminuria and hyperuricemia10.
In 1995, Godsland and Steavenson raised the question: Is insulin
In 1995, Yudkin collaborated with Barker’s group to study the
relationship between low birth weight and glucose and insulin metabolism in 4
year old urban Indian children, and they told importance to be given to events
in later life too for the genesis of insulin resistance syndrome. The development
of cardiovascular risk is an ongoing process and prevention is possible through
life style modification12.
In 1996, Steinberg established that obesity / insulin resistance is
associated with endothelial dysfunction13.
In 1997, Marita showed insulin receptor defect in the erythrocytes of
obese Asian Indian women with acanthosis nigricans and exhibiting impaired
glucose tolerance14.
In 1998, Misra has discussed the current perspective of insulin resistance
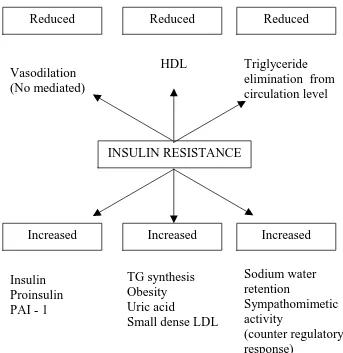
Table 3: Effects Of Insulin Resistance*
*Ref. Godsland IF, Stevenson JC [1995]
Criteria
INSULIN RESISTANCE
Increased Increased Increased
Insulin Proinsulin PAI - 1
TG synthesis Obesity Uric acid
Small dense LDL
Sodium water retention
Sympathomimetic activity
(counter regulatory response)
Reduced Reduced Reduced
Vasodilation (No mediated)
HDL Triglyceride
According to ATP III guidelines metabolic syndrome is defined by the
presence of three of the following:
Table 4: Criteria for metabolic syndrome4:
No Risk factors Defining level
1 Abdominal obesity: waist circumference
>102cm in men >88 cm in women
2 Triglyceride ≥150mg/dL
3 HDL cholesterol
<40mg/dL in men <50mg/dL in women
4 Blood pressure ≥130/85mmHg
5 Fasting plasma glucose ≥110mg/dL
In addition, following components are also included or expanded in
metabolic syndrome:
Raised apo B
HYPERURICEMIA
Increased small dense LDL particles
Microalbuminuria
Increased plasminogen activator inhibitor (PAI – 1)
Poly cystic ovarian syndrome
Increased fibrinogen
Two different types of insulin resistance have been described in adults.
1. Type A: which affects young women and it is characterised by severe
hyperinsulinemia, obesity, and features of hyperandrogenism. It is due to
genetic defect in insulin receptor number and function16.
2. Type B: which affects middle aged women and it is characterised by
severe hyperinsulinemia, features of hyperandrogenism, and
autoimmune disorders. It is due to antibodies against insulin receptors17.
OBESITY
Obesity is an increasing problem in the developed and developing
countries. Obesity is a state of excess adipose tissue mass. The distribution of
adipose tissue in different anatomic depots also has substantial implications for
morbidity specifically intra abdominal and abdominal subcutaneous fat have
more significance than subcutaneous fat present in the buttocks and lower
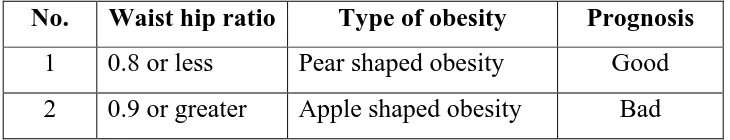
extremities. This distinction is most easily made by determining the waist hip
ratio, with a ratio >0.9 in women and >1.0 in men being abnormal.
No. Waist hip ratio Type of obesity Prognosis
1 0.8 or less Pear shaped obesity Good 2 0.9 or greater Apple shaped obesity Bad
Measures to assess obesity
Body mass index (BMI)
Skin fold thickness
Densitometry
CT or MRI
Electrical impedance
The most widely used method to assess obesity is body mass index, it
calculated by using formula.
[image:22.612.128.493.86.156.2]BMI = weight (kg)/height2 (m)
Table 6: Classification of Body Status on BMI
Classification BMI Risk of co morbidity
Underweight <18.50 Low
Normal 18.50-24.99 Average
Overweight >25.00
Preobese 25.00-29.99 Increased
Obese class I 30.00-34.99 Moderate
Obese class II 35.00-39.99 Severe
Body mass index for the midpoint of all heights and frames among both
men and women range from 19 to 26 kg/m2, at a similar body mass index,
women have more body fat than men. Based on unequivocal data of substantial
morbidity, a body mass index of 30 is most commonly used as a threshold for
obesity in both men and women. Large scale epidemiological studies suggest,
that all cause, metabolic, cancer, and cardiovascular morbidity begin to rise
when body mass index are ≥25, suggesting that the cut off for obesity should be
lowered. A body mass index between 25 to 30 should be viewed as medically
significant and worthy of therapeutic intervention, especially in the presence of
[image:23.612.118.502.414.678.2]other risk factors such as hypertension, glucose intolerance.
Table 7: Relative risk of health problems associated with obesity Greatly
Increased risk
Moderately
increased risk Low risk Insulin resistance CAD Ca breast, colon
endometrium Type 2 diabetes
mellitus
Hypertension Polycystic ovarian syndrome
Gall stones dyslipidemia
Osteoarthritis (knee) Impaired fertility
Breathlessness Hyperuricemia (gout) Low back ache
Sleep apnea Faetal defects with
Overall cardiovascular risk
The degree of risk from diabetes can be categorized with reasonable
accuracy by taking into account.
1. The level of blood sugar and the presence of insulin resistance.
2. The presence of micro and macrovascular complications of diabetes.
3. The coexistence of other cardiovascular risk factors
The major cardiovascular risk factors indicated in JNC – 7 report are18:
• Hypertension
• Smoking
• Obesity
• Physical inactivity
• Diabetes mellitus
• Dyslipidemia
• Microalbuminuria or estimated GFR <60ml/mt
• Age>55 for men >65 for women
• Family history of premature cardiovascular disease <55 for
men, <65 for women
Metabolic syndrome (or)
URIC ACID
Uric acid is the final breakdown product of the PURINE degradation in
humans. Mammals other than primates oxidize uric acid further to allantoin. It
is a weak acid with Pka of 5.75 and 10.3.
Purines
Nucleic acids (DNA, RNA) which are required for the storage and
expression of genetic information is made of polynucleotide chain. Nucleotides
are the building blocks of nucleic acid. These nucleotides are composed of
purine or a pyramidine base, a pentose monosaccharide and one, two or three
phosphate groups.
Purines are heterocytic nitrogen contain bases whose ring contain both
carbon and other elements (heteroatoms). The various purine bases are:
Adenine, Gaunine, Hypoxanthine and Xanthine.
Addition of a pentose sugar to a purine base produces a nucleoside. The
sugar may be ribose or 2-dioxy ribose. Nucleotides are mono, di or tri
phosphate esters of nucleotides.
Synthesis of purines
Humans can synthesize purines from amphibolic intermediates. Purines
Denovo synthesis
Dietary nucleic acids
Cellular nucleic acid
Denovo purine synthesis
The atoms of purine ring are contributed by compounds including amino
acids (aspartic acid, glycine and glutamine), Co2 and derivatives of
tetrahydrofolate. The purine ring is constructed by 11 step process that results
in the formation of inosine mono phosphate (IMP). IMP can be converted to
either adenosine monophosphae (AMP) or guanine mono phosphate (GMP).
The first step involves synthesis of phosphoribosyl pyrophosphate (PRPP).
Next step involves synthesis of phosphoribosyl amine from PRPP and
glutamine and is catalysed by the enzyme amido phosphoribosyl transferase.
This is the rate limiting step in purine synthesis.
Degradation of purines – production of uric acid
The end product of purine catabolism in humans is uric acid. In
mammals other than higher primates uricase enzyme converts uric acid to a
URIC ACID SYNTHESIS FROM PURINES
Uric acid is produced only in liver and small intestine because only these
two tissues contain the enzyme Xanthine oxidase.
AMP GMP
Adenosine Guanosine
Inosine
Purine nucleoside Phosphorylase
Gaunine Hypoxanthine
Xanthine oxidase
Xanthine
Xanthine oxidase
URIC ACID
Salvage pathway for purines
All the purines are not degraded to uric acid. Purines that result from
normal turn over of cellular nucleic acids can be reconverted to nucleotides and
used by the body. Two enzymes Adenine phosphoribosyl transferase (APRT)
and Hypoxanthine gaunine phosphoribosyl transferase (HGPRT) are involved.
Deficiency of HGPRT causes Lesch – Nyhan syndrome.
Uric acid metabolism
The amount of urate in the body is the net result of the amount produced
and amount excreted. The sources for uric acid are denovo synthesis of purines,
purines from cellular nucleic acid, and purines from dietary nucleic acid.
The total dynamic urate metabolic pool in the body is about 1200mg
expressed as uric acid of which denovo synthesis contributes about 300-600mg
and dietary purines contributes about 600-700mg. Each day about 2/3 of the
uric acid are excreted in the urine and 1/3 is destroyed by bacterial uricolysis in
THE TOTAL BODY URATE POOL
Urate anion is freely filtered at the renal glomerulus and kidney handles
urate by following
1. Glomerular filtration of 100% of the filtered load
2. Proximal tubular absorption – of 99% of filtered load.
3. Tubular secretion of about 50% of filtered load.
4. Post secretary reabsorption of about 40% of filtered load.
The net clearance of uric acid is around 10% of the filtered load and is in
the range of 6 to 11 ml / min / 1.73m2. Denova synthesis
Denovo synthesis Nucleic acid
Nucleotides
Nucleosides
Bases
Urate Tophi
Urine Intestine Diet
Plasma urate levels
As mentioned urates, the ionized forms of uric acid, predominate in
plasma extracellular fluid and synovial fluid with approximately 98% existing
as monosodium urate at pH 7.4. Mono sodium urate is easily dialysed from
plasma. Binding of urate to plasma proteins has little physiological significance.
Plasma is saturated with monosodium urate at a concentration of 415
µmol/L (6.8 mg/dl) at 37°C. At higher concentrations, plasma is therefore supersaturated, creating the potential for urate crystal precipitation. However,
precipitation sometimes does not occur even at concentrations as high as 4800
µmol/L (80mg/dl), perhaps because of the presence of solubilizing substances in plasma.
Plasma urate levels rises at puberty with female values being lower than
in men until menopause after when it gradually rises to male value. It decreases
during pregnancy. Hyperuricemia is a characteristic and often an early feature
of pre-eclampsia.
Extrinsic factors, particularly diet, plumbism, the prevalence of high
ethanol intake in the community and diseases like malaria, thalassemia can
affect plasma urate distribution in different populations. Epidemiological
studies show significant variations in plasma urate concentrations between
different ethnic groups. For example, Polynesians have higher values than
polygenic aspects in the control of serum uric acid. Other epidemiological
studies emphasize the importance of environmental factors of purine, protein
and alcohol intake. For example Gress and Zollner (1991) showed that the
cumulated frequency of plasma urate rose from 6.2mg/dL to about 9.0mg/dL
between 1962-1971 in association with improved nutritional state of Bovarian
population.
The frequency distribution of plasma urate values based on
asymptomatic population is only approximately Gaussian, with an excess of
higher values due to inclusion of some asymptomatic hyperuricaemic subjects.
Ignoring the slight asymmetry of the frequency distribution and defining
normality as the mean value ±2SD above the mean, normal upper limit of
7.0mg/dL (420µmol/dL) for mean and 6.0mg/dL (360µmol/L) for women is widely adopted.
Hyperuricemia
Hyperuricemia can result from increased production or decreased
excretion of uric acid or from a combination of the two processes. When
sustained hyperuricemia exists, plasma and extracellular fluids are super
saturated with respect to urate and total body urate is increased.
Physiochemically, hyperuricemia is the concentration of the urate in the
blood that exceeds the solutions limits of monosodium urate in plasma, 415
mean plus 2 standard deviations of values determined from a randomly selected
healthy population. Hyperuricemia is present between 2.0 and 13.2% of
ambulatory adults and some what more frequently in hospitalized.
Classification of hyperuricemia
Reduced renal excretion1. An inherited defect in renal handling of urate.
2. Renal glomerular disease
3. Renal tubular dysfunction
a. Tubulo interstitial nephritis
b. Competition for tubute excreting mechanism (Lactic acidosis and
keto acidosis)
c. Drugs (Diuretics, Pyrazinamide, Ethambutol etc)
4. Other conditions in which renal tubular dysfunction has been proposed
a. Hypertension b. Sickle cell anemia
c. Myxedema d. Lead nephropathy
Increased uric acid production
1. Dietary sources
2. Hypoxanthine phosphoribosyl transferase deficiency
3. Increased phosphoribosyl pyrophosphate activity
4. Glycogen storage disorders
6. Myeloproliferative diseases
7. Chronic hemolytic anaemias
8. Extensive psoriasis
9. Gauchers disease
The following abnormalities are commonly associated with but not
casually related to Hyperuricemia:
i. Obesity
ii. Dyslipidemia (usually type 4 with increased VLDL and normal
cholesterol)
iii. Hypertension
iv. Insulin resistance
v. Ischemic heart disease
CAUSES OF HYPERURICEMIA IN TYPE 2
DIABETES MELLITUS
1. DIETARY HABITS:
An increase is serum urate level may occur is type 2 DM in various
situations like purine rich diet such as non vegetarian diets-liver, anchovies,
kidney, sardines, sweat breads and yeasts.
2. EXERCISE:
Exercise acutely increase serum urate levels by excessive degradation of
skeletal muscle ATP.
3. ALCOHOL:
Alcohol increases serum urate level by accumulation of organic acids
(betahydroxy butyrate, acetoacetate, lactate) that compete with the urate for
tubular secretion and accelerated breakdown of ATP by liver is increased. (Beer
contains high uric acid)
4. OBESITY:
Various mechanisms play role in increase in serum urate by obesity.
Like anabolic effects of tissues because of insulin resistance, increase in denovo
5. DEHYDRATION:
Dehydration can impair uric acid excretion by decreased filtration and
secretion and sometimes with acidosis by competition of H+ ions for excretions.
Starvation again causes accumulation of organic acids that compete for the
excretion of urate for tubular secretion.
SYSTEMIC HYPERTENSION:
There are various studies regarding association of systemic hypertension
with the elevated uric acid level. Probable mechanism suggested is impaired
excretion of urate because of intrinsic renal defect in hypertension19,20.
LACTIC ACIDOSIS AND DIABETIC KETO ACIDOSIS:
Dehydration and pre renal azotemia both can impair filtration and
secretion of urate leading to retention and also these may casue diminished
reabsortion of the uric acid. Again in the setting of acidosis H+ ions compete
with uric acid leading to enhanced reabsortion and retention.
HYPER GLYCEMIA:
Both uric acid and glucose levels are positively related to body mass
index. The association of uric acid in relation to glucose reflects the
biochemical interaction between serum glucose metabolism and purine
RENAL INSUFFICIENCY:
Decreased urate filtration contributes to the hyperuricemia of renal
insufficiency. But the correlation between Bun, serum Creatinine and serum
uric acid concentration per unit of GFR increases progressively with renal
insufficiency. The tubular secretory capacity tends to be preserved, the tubular
reabsorbtive capacity is decreased and extrarenal clearance of uric acid
increases as the renal damage becomes more severe.
DRUGS:
They mainly act by decreasing the uric acid excretion by competitive
inhibition of uric acid excretion. Salicytates and nictotinic acid directly compete
with the urate for tubular secretion.
Diuretics, L-dopa, Pyrazinamide, Ethambutol, Cyclosporine decreases
the secretion of urate in the tubules.
URIC ACID AND INSULIN RESISTANCE
Nearly 120 years have elapsed since uric acid was first described as a
potential factor in the development of cardiovascular disease1.
The actual mechanism of hyperuricemia found in many diabetic patient
Quiniones (1995) observed that hyperuricemia is a frequent finding in
insulin resistant states. He found that insulin induces changes in fractional uric
acid and sodium excretion co related with one another and physiological
hyperinsulinemia acutely reduces urinary uric acid and sodium excretion in
coupled patients. They also observed that in insulin resistant individuals
compensatory hyperinsulinemia imposes a chronic antinatriuretic and anti
uricosuric pressure on the kidney.
Moriwaki (1995) studied the effects of glucose infusion on the renal
clearances of uric acid, xanthine and oxypurinol and found that the effect was
not related to osmotic diuresis, but induced by glycosuria / and / or
hyperglycemia.
Muscelli and Coworkers (1996) observed that effect of insulin or urinary
excretion in normal subjects and found that hyperinsulinemia caused a
significant decrease in the urinary excretion of uric acid.
Tkac I studied 91 type 2 DM patients, 57 patients with myocardial
infraction were compared with control group of 34 diabetics without clinical or
electrocardiographic sings of IHD. Higher mean serum uric acid level in
infarction group was associated with increasing age and serum creatinine levels.
It was associated with elevated TGL, BMI and hypertension.21.
Woo study results found positive association between serum uric acid
glucose 2 hour insulin, TGL, apolipoprotein B in men. Similar but fewer
associations were seen in women with additional positive associations with age.
The study suggests that serum uric acid may be a marker for the presence of an
adverse cardiovascular risk profile22.
Wannamethee concluded in their study that serum uric acid is not a truly
independent risk factor for coronary art disease. Increased serum uric acid
appears to be an integral part of the cluster of risk factors associated with the
insulin resistance syndrome that include central obesity, increased TG level,
and serum cholesterol level23.
Pearl study concluded high molar equivalent serum antioxidant capacity
(MESA) between diabetics and non diabetics showed uric acid as a free radical
scavenger is NIDDM24.
They are certain clinical clustering groups with increased cardiovascular
risk, which have associated hyperuricemia. They are
1. African American patient group
2. Patients group with excessive alcohol consumption.
3. Hypertensive patient groups
4. Non diabetic patient groups with accelerated arteriosclerosis.
5. Congestive heart failure patients groups with ischaemic cardiomyopathy.
6. Metabolic syndrome patients group.
8. Patients group taking diuretics
Each of the clustering group has metabolic mechanisms that may help to
explain which serum uric acid may be elevated.
MECHANISM:
Type 2 Diabetes mellitus is strongly associated with hyperuricemia.
Potential mechanism involved in the association of hyperuricemia and
type 2 Diabetes mellitus include the following:
1. Altered renal sodium handling causes decreases renal blood flow and
diminishes uric acid excretion
2. Decreased GFR stimulating urate absorption
3. Microvascular disease resulting is local tissue ischemia
4. Ischemia associated with increased lactate production.
5. Ischemic induces increased xanthine oxidase production.
Other factors which may contribute are alcohol abuse Lead intoxication,
Mechanism of Hyperuricemia in Hyperinsulinemia
Hyperinsulinemia
↓
Altered renal
Sodium handling
↓
↑ Arterial pressure
↓ renal blood flow
↓ Uric acid excretion
↓
Hyperuricemia
(Adapted from ward, Lancet 1998)
Increased serum uric acid has been found to predict the development of
renal insufficiency in individuals with normal function20.
In type 2 Diabetes mellitus hyperuricemia seems to be associated with
metabolic syndrome and with early onset or increased progression to overt
nephropathy, whereas hyperuricemia was associated with hyper filtration and a
later onset or decreased progression to overt nephropathy25.
Hyperuricemia has been associated with increasing Body mass index
(BMI). The role of leptin is possibly being a regulator of serum uric acid level
From the review the following conclusion was arrived:
Determining the truth in medical science is a difficult business.
Serum uric acid may or may not be an independent risk factor because its
linkage to other risk factors is so strong. However there is not much correlation
regarding its role as a marker or risk factor that is clinically significant and
relevant.
Hyperuricemia should alert the clinician to an overall increased risk of
cardiovascular disease. Elevations of uric acid > 4 mg/dl should be considered a
“Red flag” in those patients at risk for cardiovascular diseases and should alert
the clinician to strive and utilize a global risk reduction programme to reduce
MATERIALS AND METHODS
Setting : Government Rajaji Hospital and Madurai Medical College, Madurai
Collaborative Department : Department of Biochemistry, Madurai Medical College, Madurai
Study Design : Descriptive analytical study
Period of study : January 2005 to February 2006
Sample size : 70 cases
Ethical committee approval : The present project was approved by the Ethical committee
Inclusion criteria
1. Patients with type 2 diabetes mellitus (patients were taken
irrespective of their glycemic control and their duration of diabetes)
2. Patients who were above 40 years were included
3. Both sexes were included
Exclusion criteria
1. Patients with renal failure
2. Pregnancy and lactating mothers.
3. Patients who were on long term diuretics and steroid.
5. Patients who were on anti metabolite and chemotherapy drugs
6. Patients who had hepatic and metabolic disorders.
7. Patients who had PVD / CVA / Pulmonary tuberculosis.
8. Renal transplant patients.
Controls
Subjects who were above 40 years and had normal blood sugar and who
met the above exclusion criteria.
Consent
The study group thus identified by the above criteria (inclusion and
exclusion) were first instructed about the nature of study. Willing participants
were taken up after getting a written informed consent from them.
Materials
Thus a total of 70 cases who satisfied the inclusion and exclusion criteria
above were taken up for subsequent study. 30 age and sex matched subjects
were kept as control.
Conflict of interest
There was no conflict of interest.
Financial support
Limitations
1. Because of limited resources GTT, Hb A1c, leptin level, C peptide assay,
plasma insulin assay could not be tested.
2. Xray chest was not performed in every case due to technical limitation.
3. Only serum uric acid levels were analysed, urinary excretion and urate
clearance was not done.
Methods
Selected socio-demographic, clinical, laboratory data were elicited from
the patients and controls and recorded in proforma.
1. Socio demographic data
Age
Sex
2. Clinical data
Body weight
Height
BMI, waist hip ratio (WHR)
Systolic diastolic blood pressure
Cardiovascular risk factors
3. Laboratory data
Blood urea estimation was done manually by using diacetyl
monoxime method (DAM).
Serum creatinine estimation was done by using COBAS auto
analyzer.
Serum uric acid was done by using semi auto analyzer.
Principle
Uric acid is converted by uricase to allantoin and hydrogen peroxide in
the presence of peroxidase (POD) oxidiz`es the chromogen to a red coloured
compound which is read at 500mm.
Uricase
Uric acid +2H2O+O2 Allantoin +Co2+H2O2
DHBS POD
2H2O2+4aminophyrine + Red quinolone +
H2O+Hcl (DHBS 3, 5 – Dichloro – 2 hydroxy benzene sulphonic acid)
Statistical analysis
Data was entered in Microsoft excel spread sheet and analysed
statistically using standard statistical software. Student ‘t’ values was applied
DEFINITIONS USED IN THE PRESENT STUDY
1. Diabetes mellitus
Criteria for the diagnosis diabetes mellitus (modified form of American
Diabetes Association, 2004)4.
1. Symptoms of diabetes + (R) blood glucose ≥200mg/dL
2. Fasting plasma glucose ≥126mg/dL
3. Two hour plasma glucose (postprandial) ≥200mg/dL during an oral
glucose tolerance test
2. Hyperuricemia
Hyperuricemia is defined as serum uric acid level ≥8mg/dL in males and
≥6mg/dL in females4.
3. Body mass index
It is estimated by using the following formula: weight (kg)/ height2 (m)
4. Obesity
Obesity is usually defined as body mass index >30, body mass index
between 25 to 30 is known as overweight. Body mass index between 25 to 30
should be viewed as medically significant, especially in the presence of other
risk factors like hypertension, diabetes. Large scale epidemiological studies
suggest that cardiovascular morbidity begins to rise when body mass index ≥
Waist hip ratio
The waist is measured by taking a circumference that gives the narrowest
measurement between the ribcage and the iliac crest. The hip measurement is
taken by measuring at a level that gives the maximal measurement of hip over
the buttocks. It is a simple, and convenient measurement that is unrelated to
height, correlates closely with body mass index and waist hip ratio is an
approximate index of intra abdominal fat mass and total body fat.
Waist hip ratio >0.9 in women and >1.0 in men being abnormal.
Conversion of blood glucose to plasma glucose:
John Neale (1999) described the conversion of blood glucose to plasma
glucose by using this formula:
Plasma glucose = whole blood glucose × 1.12
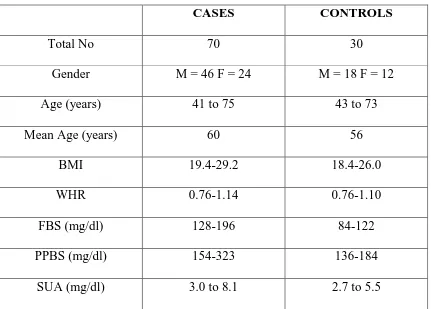
The total number of subjects included in this study was 100. Among
those 100 subjects, 70 were cases (type 2 Diabetes mellitus) and 30 were
[image:48.612.96.527.246.555.2]controls (Non Diabetic).
Table 8: Introduction
CASES CONTROLS
Total No 70 30
Gender M = 46 F = 24 M = 18 F = 12
Age (years) 41 to 75 43 to 73
Mean Age (years) 60 56
BMI 19.4-29.2 18.4-26.0
WHR 0.76-1.14 0.76-1.10
FBS (mg/dl) 128-196 84-122
PPBS (mg/dl) 154-323 136-184
SUA (mg/dl) 3.0 to 8.1 2.7 to 5.5
The age of the subjects in the study group ranged from 41 to 75 years.
The mean and standard deviation for age of the cases and controls were 60.1+
8.82 and 56.27 + 7.84 respectively, there was no significant difference among
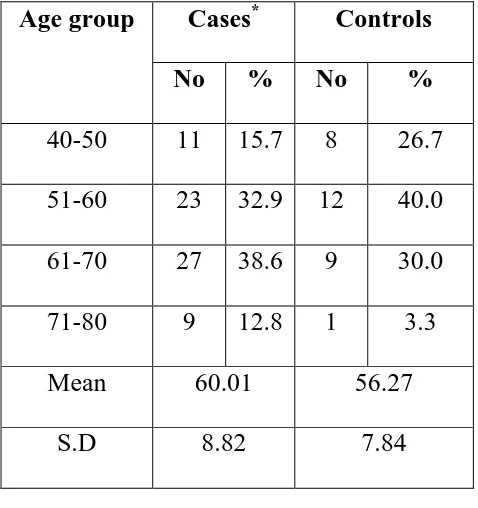
the cases and controls with reference to the age. The distribution of cases and
[image:49.612.191.430.307.561.2]controls in relation to age is provided in table 9 given below:
Table 9: Cases and controls in relation to age
Cases* Controls Age group
No % No %
40-50 11 15.7 8 26.7
51-60 23 32.9 12 40.0
61-70 27 38.6 9 30.0
71-80 9 12.8 1 3.3
Mean 60.01 56.27
S.D 8.82 7.84
*
p= 0.0529 (not significant)
Among 70 cases studied, there were 46 males and 24 females. Among
30controls there were 18 males and 12 females. The details are given in
[image:50.612.197.422.230.402.2]table 10 provided below:
TABLE: 10 Cases and Controls in relation to gender CASES* CONTROLS
Sex No % No %
Male 46 65.7 18 60
Female 24 34.3 12 40
Total 70 100 30 100
*
p = 0.7503 (not significant)
The sex composition of the study group and control group does not differ
significantly.
Among 70 cases and 30 controls screened for BMI, non were obese. The
mean and standard deviation for BMI of the cases and controls were 24.1 + 2.98
and 21.6 + 2.3 respectively. The details are shown in table 11 given below:
[image:51.612.196.423.219.447.2]
Table: 11 Cases and control with respect to BMI
CASES* CONTROLS
BMI No % No %
<25 38 52.9 26 66.7
>25 32 47.1 4 33.33
Total 70 100 30 100
Mean 24.1 21.6
S.D 2.98 2.3
*
p = 0.0002 (significant)
The BMI of the study group was significantly higher than that of the
Blood sugar distribution among cases:
The details of fasting and post prandial blood sugar distribution among
the cases are shown in the table 12 given below:
Table: 12 (F) BS and (PP) BS among cases
Bl sugar Mean S.D
(F) BS 144.28 38.21
(pp) BS 212.01 42.13
The Mean and Standard deviation for fasting blood sugar was 144.28 +
38.21 similarly for post prandial blood sugar was 212.01 ± 42.13 among diabetics. Thus showing that their diabetic status was under poor control.
Analysis of cases and controls in relation to selected cardiovascular risk
factors are provided in Table 13 given below.
Table 13: Selected Cardiovascular risk factors
CASES CONTROLS Risk factor
No % No %
Family history Yes* No 17 53 24.3 75.7 5 25 16.7 83.3 *
p VALUE 0.5622 ( Not Significant ) Smoking among
males Yes** No 18 28 40 60 5 13 27.8 72.2 **
p VALUE 0.5746( Not Significant ) Hypertension
Yes *** No 15 55 21.4 78.6 4 26 13.3 86.7 ***
p VALUE 0.5044 ( Not Significant )
There was no significant difference between cases and controls in
Distribution of cases and controls in relation to serum uric acid Level
(SUA):
Serum uric acid in the study population and control varied from 3.0 to
8.1 and 2.7 to 5.5 mg/dl respectively. The mean and standard deviation of uric
acid among cases was 5.08 + 1.42 while in control it was 3.55 + 0.62
respectively.
The details are shown in the table 14 given below:
Table 14: Serum Uric Acid level in diabetics and controls
Cases Controls Mean S.D Mean S.D
Serum uric
acid* 5.08 1.42 3.55 0.62
*
p value : 0.0001 (significant)
The serum uric acid level of diabetics was very much elevated compare
Analysis of Hyperuricemia in cases and controls
Hyperuricemia is defined as SUA level ≥8mg/dL in males and ≥6mg/dL in females. 7 cases had hyperuricemia while none in controls. The results are
displayed in table 15 given below:
Table 15:
Hyperuricemia in cases and controls
Cases Controls
Hyperuricemia No % Mean S.D No % Mean S.D
+* 7 10 7.54 0.5 0 - - -
- 63 90 4.81 1.21 30 100 3.55 0.62
*p value = 0.0001 (significant)
This table clearly shows that the prevalence of hyperuricemia more in
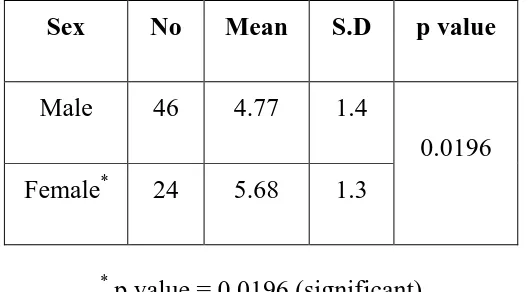
Analysis of Gender distribution with serum uric acid among the cases
The mean value of serum uric acid was 4.77±1.4 in males and 5.68±1.3
[image:56.612.179.443.298.444.2]in females and details are given table 16 below.
Table 16: Serum uric acid values in relation to gender among cases
Sex No Mean S.D p value
Male 46 4.77 1.4
Female* 24 5.68 1.3
0.0196
*
p value = 0.0196 (significant)
In the study group mean uric acid values were higher in females than
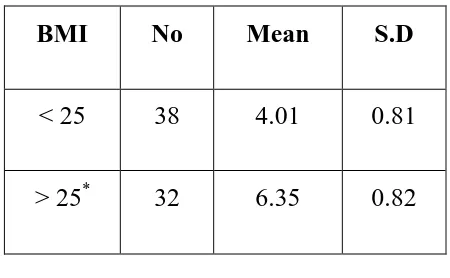
Serum uric acid value in relation to BMI in cases
The mean value of serum uric acid was 6.35±0.82 in those with
BMI>25, it was significantly higher when compared to those having BMI<25.
The mean value of serum uric acid in BMI < 25 was 4.01±0.81.
[image:57.612.197.422.385.524.2]The details are shown in table 17 given below:
Table 17: Uric acid with regard to BMI among cases
BMI No Mean S.D
< 25 38 4.01 0.81
> 25* 32 6.35 0.82
*
p value = 0.0001 (significant)
Serum uric acid value in relation to waist hip ratio (WHR)
Uric acid level increases with increasing WHR. The WHR abnormality
was considered in 36 cases based on, WHR as 1.0 and above for men, 0.90 and
above for women and correlated with uric acid level, it was significant. The
[image:58.612.168.455.378.514.2]details are shown in table 18 given below.
Table 18: Waist hip ratio and Hyperuricemia
WHR abnormality No Mean S.D
Yes * 36 6.12 0.72
No 34 3.97 0.43
*
Smoking and serum uric acid among the cases (only in males)
The mean value of serum uric acid level was slightly higher among
smokers 4.80±1.12 when compared to non smokers 4.56±1.06, but the
difference was not significant statistically. This is shown in table 19 given
[image:59.612.193.427.370.507.2]below:
Table 19: Uric acid values in relation to smoking (only in males)
Smoking No Mean S.D
Yes* 18 4.80 1.12
No 28 4.56 1.06
Serum uric acid values in hypertensive patients
The mean serum uric acid level in the hypertensive group (6.15±0.92)
was significant more than non hypertensive group (5.15±1.40) in the cases and
[image:60.612.206.414.339.488.2]the results are shown in the table 20 given below:
Table 20: Serum uric acid values in relation to hypertension
HT No Mean S.D
Yes* 15 6.15 0.92
No 55 4.79 1.4
*
Serum uric acid level in relation to lipid profile abnormality
The mean serum uric acid level in patients with lipid profile abnormality
was 6.49±0.85, while it was 4.52±1.20 in patients without lipid profile
abnormality, and it was highly significant. The results are shown in table 21
[image:61.612.151.471.369.540.2]given below.
Table 21: Serum uric acid value in relation to lipid profile abnormality: Lipid profile
abnormality
No Mean S.D
Yes* 20 6.49 0.85
No 50 4.52 1.2
Table 22: CAD and Hyperuricemia
Type of CAD No of Patients
Total no of hyperuricemia
Sex %
Ischemia 10 2 IM + IF 20 %
Infarction 5 3 0 M + 3F 60%
This table was showing number of patients with ischemia – 10
Of these only 2 had hyperuricemia with equal sex distribution (1:1)
Number of patients with infarction was 5
Of these only 3 had hyperuricemia, all are female patients (0:3)
Percentage of hyperuricemia in infarction is higher than in ischemia, and
female patients were more involved in CAD than males in relation to
Serum uric acid value in relation to duration of diabetes
Mean value of serum uric acid level was higher in longer duration (8-12
years) of diabetes 6.34±0.84, when compared to shorter duration (2-4years) of
diabetes 3.88±0.93.
This is shown in table 23 given below:
Table 23: Duration of Diabetes and Hyperuricemia
DOD No Mean S.D
2-4 yrs 13 3.88 0.93
4-8 years 34 4.69 1.27
8-12 years* 23 6.34 0.84
*p value = 0.001 Significant
Uric acid level increases with increasing duration of diabetes and it was
statistically significant.
Diabetes is the most common risk factor for cardiovascular disease, and
it is present in nearly 25% adults and increases in prevalence with age.
Hyperuricemia is one of the component of metabolic syndrome2. “In the
absence of gout the presence of hyperuricemia in patients with type 2 diabetes
mellitus is an important marker as well as an added risk factor for
atherosclerosis”.
In this study the relation between serum uric acid level and diabetes was
examined. Uric acid is a marker for CAD in combination with other risk factors
among diabetics.
Though uric acid level and age was independent, it is possible that
duration of the illness may have an impact on uric acid levels.
In the present study females have higher uric acid level when compared
to males. The mean uric acid value in males 4.71±1.4 while in females it was
5.68±1.3, and the difference was statistically significant in this study. The
possible reasons for such difference may be attributable to increased BMI and
increased WHR among women.
In the present study serum uric acid correlated well with body mass
index (BMI). The mean uric acid in those subjects with BMI>25 were higher
than those with BMI < 25 (6.35±0.82 Vs 4.01±0.81) and the difference was
Rathman (1997) assessed the various components of insulin resistance
syndrome in young black and white adults. They concluded body mass index
showed strongest positive correlation with the uric acid among insulin
resistance components29.
Waist hip ratio is an important measure of obesity, especially central
obesity. Intra abdominal fat has significant implication for morbidity than
subcutaneous fat present in buttocks and extremities.
Abdominal obesity is a component of metabolic syndrome2. Abdominal
obesity >102cm in men and >88cm in women is abnormal. In this study patient
with higher waist hip ratio has higher uric acid level when compared with low
waist hip ratio.
The mean uric acid value in patients with waist hip ratio abnormality and
patients without waist hip ratio abnormality was 6.12±0.72 and 3.97±0.43
respectively and the difference was statistically significant.
Strong epidemiologic data have linked serum uric acid to hypertension in
humans19 and experimental animal data suggests hyperuricemia causes
hypertension30,31. The Olivetti heart study had shown a independent positive
association between serum uric acid and development of hypertension32.
When the level of serum uric acid in hypertensive patients was compared
in the present study. The present observation on uric acid among diabetic
hypertensives is in consistent with other studies.
Elevated triglycerides which is the most important risk factor in
acceleration of atherosclerosis21. There is a significant relationship between
serum uric acid and dyslipidemia33. In the present study dyslipidemia was
noticed as a risk factor in those with CAD, Who had significantly elevated
serum uric acid levels.
“Uric acid stabilizes the platelet aggregation and enhances thrombotic
tendency”, thus suggested hyperuricemia as a strong predictor of myocardial
infarction and stroke and all causes of mortality.
Patients with poor metabolic control and longer duration of diabetes
were more susceptible to develop various complications including
hyperuricemia as observed in the present study. Our study also shows that
higher level of serum uric acid was seen in patients with longer duration of
diabetes when compared with shorter duration of diabetes. This difference was
statistically significant.
Uric acid >4mg/dL should be considered as a “Red flag” in those
patients at risk for cardiovascular disease. In this study 74.3% of diabetic
patients have serum uric acid level >4mg/dL, while only 23.3% of the control
have serum uric acid >4mg/dL. In these patients the clinician should strive to
atherogenic process. The details in relation to this study is shown in the table 25
[image:67.612.95.528.188.346.2]given below:
Table 24: Cases and controls in relation to uric acid Cases Controls Serum Uric
Acid No. Percentage No. Percentage
<4mg 18 25.7 23 76.7
>4mg 52 74.3 7 23.3
p value = 0.0001 significant
The association of serum uric acid with cardiovascular disease has been
appreciated for nearly half a century1. However, it role as a cardiovascular risk
factor remains controversial. The Framingham heart study concluded that uric
acid does not have a causal role in the development of coronary artery disease
and death from cardiovascular disease. In an epidemiologic follow up study an
association between serum uric acid and cardiovascular disease was shown. The
recent PIUMA study also concluded that raised serum uric acid is a powerful
risk marker for subsequent cardiovascular disease and all cause mortality34.
Of the 70 cases of type 2 diabetes mellitus serum uric acid was elevated
in 7 patients which accounts for 10% of cases. Canon showed a prevalence of
hyperuricemia in 25% of longstanding uncontrolled diabetes. But in this study
A large Body of evidence links uric acid with metabolic syndrome of
insulin resistance, obesity, hypertension, and dyslipidemia. In this study
relationship between obesity, hypertension, dyslipidemia and hyperuricemia
CONCLUSION
Uric acid was significantly elevated in diabetic population.
The serum uric acid level was independent of age and smoking status
in males.
Significant correlation was noticed between serum uric acid and BMI
as well as WHR.
Significant elevation of uric acid level was observed more among
females.
Elevated uric acid levels were significantly noticed among those with
hypertension, dyslipidemia, coronary artery disease and chronicity of
the diabetes.
Uric acid level above 4mg/dl in diabetic population (considered as a
“Red flag” sign) was a marker or risk factor for CAD, which was
RECOMMENDATIONS / SUGGESTIONS
Routine annual estimation of uric acid among diabetics from the
identification of diabetes will help the clinician to find out the changing trends
of uric acid level which is likely to be influenced by control of blood sugar and
development of hypertension, such cases should be carefully monitored for
CAD as well as other vascular episodes.
Since uric acid is a confounding factor and multiple factors are involved
for elevated uric acid. A meticulous control of blood sugar, hypertension,
dyslipidemia among diabetics will bring down elevated uric acid level in
diabetics.
Let us have a moto of
“Asses diabetics for risk factors,
Assist to control them and
Arrest the development of complications”
SUMMARY
Diabetes mellitus is strongly associated with hyperuricemia. The role of
uric acid is a independent risk factor for cardiovascular disease is a matter of
controversy. The present study was proposed to asses the uric acid status in
patients with diabetes mellitus and to find out its association with age, gender,
BMI, WHR, smoking and CAD. With rigid criteria, patients were selected
carefully and evaluated on social, clinical, and laboratory aspects after getting
institutional, ethical clearance and informed consent. 30 healthy age, sex
matched individuals were kept as control. There were 46 males and 24 Females
in the study group and 18 males and 12 females in the control group. The mean
and standard deviation of age among the patient group was 60.01± 8.82 and 56.27 ± 7.84 in control group. There was no significant difference among cases and controls in relation to age.
In study group, BMI below 25 seen in 32 cases (45.7%) BMI above 25
seen in 38 cases (54.3%) which was significantly more than controls. BMI had
significantly correlated with hyperuricemia. Similarly WHR was greater among
women than men in diabetics, which also correlated with elevated serum uric
acid significantly.
Elevated serum uric acid level was noticed more among those who had
and they were significant. Patients with longer duration of diabetes also had
elevated uric acid level.
The factors contribute to hyperuricemia in diabetes are
1. Hyperinsulinemia acutely reduces urinary uric acid and sodium
excretion.
2. Hyperinsulinemia imposes a chronic antinatriuretic and antiuricosuric
pressure on the kidney.
3. Microvascular disease in diabetes mellitus causes local tissue ischemia,
and decreased renal blood flow. Ischemia with associated lactate
production that blocks urate secretion in proximal tubules. Increased uric
acid synthesis due to increased purine metabolism, ischemia induced
increased xanthine oxidase production, insulin resistance, and diuretic
use.
Meticulous control of blood sugar, hypertension, dyslipidemia, body
weight and abdominal girth, form an essential component of diabetes which
will bring down uric acid level, a less discussed issue among diabetic
population.
In view that it is worth to explore uric acid levels atleast in patients with
family history of diabetes and in obese diabetic patients to detect early
BIBLIOGRAPHY
1. Gerteler MM, GAM S.M. Lerine SA: Serum Uric Acid in relation to age
and physique in health and CAD. An intern med 1951; 34: 1421-1431.
2. Reaven GM. Role of insulin resistance in human disease diabetes 1993;
37:1595-1607.
3. Alderman MH, Cohen H, Madhasen S, Kirilinghn S: Serum uric acid
and cardiovascular events in successfully treated hypertensive patients,
Hypertension 1999; 34: 144-150.
4. Harrison’s principles of internal medicine 16th edition: 2005; Vol 2;
2152-2153:A-6.
5. Gerich JE. Addressing the insulin secretion defect. A logical first line
approach metabolism 2000; 49 (Suppl 2) : 12-16.
6. Pulansky Ks, Sturis J. BellGI. Non insulin dependent diabetes mellitus: a
genetically programmed failure of the beta cell to compensate for insulin
resistance N. Engl. J. Med. 1996: 334-771-783.
7. Himmsworth H. Diabetes mellitus – a differentiation into insulin
sensitive and insulin insensitive types lancet 1936; I:127-130.
8. Ramachandran A et al, Decreased insulin sensitivity in off springs whose