TH
HAE
DECO
HE TAM
DE
T
EMATO
OMPENS
D
MIL NAD
With par
for
M.D
PARTM
TIRUNE
T
OLOGIC
SATED
Dissertat
DU Dr.M
CHE
rtial fulfi
r the awa
D. GENE
BR
MENT O
ELVELI
TIRUNE
TAM
AP
CAL ABN
CHRON
tion sub
M.G.R. M
ENNAI
fillment o
ard of th
ERAL M
RANCH
OF INTE
I MEDIC
ELVELI
MIL NA
INDIA
PRIL 20
NORMA
NIC LIV
mitted to
MEDICA
– 32
CERTIFICATE
This is to certify that this dissertation entitled “HAEMATOLOGICAL
ABNORMALITIES IN DECOMPENSATED CHRONIC LIVER
DISEASE” is a bonafide original work of Dr FAEEZ MOHAMAD
ALIin partial fulfillment of the requirement for M.D. (Branch-I) General
Medicine Examination of the Tamil Nadu Dr.M.G.R Medical University,
Chennai, to be held in April 2013.
PROFESSOR Dr. R.GEETHARANI M.D.
UNIT CHIEF M 1
HEAD OF THE DEPARTMENT
INTERNAL MEDICINE
TIRUNELVELI MEDICAL COLLEGE& HOSPITAL
TIRUNELVELI – 627 011
Dr. M. MANOHARAN MS
THE DEAN
DECLARATION
I solemnly declare that this dissertation entitled “HAEMATOLOGICAL
ABNORMALITIES IN DECOMPENSATED CHRONIC LIVER
DISEASE” is a bonafide record of work done by me in the Department
of General Medicine at Tirunelveli Medical College Hospital from 2010
to 2013 under the guidance and supervision of PROF. DR. R.
GEETHRANI M.D. This dissertation is submitted to Tamil Nadu
Dr.M.G.R. Medical University in partial fulfillment of the University
regulations for the award of M.D. (BRANCH – I) General Medicine
degree examination to be held in April 2013.
PLACE:
Dr FAEEZ MOHAMAD ALI
ACKNOWLEDGEMENT
This dissertation would not have been possible without the
guidance and the help of several individuals who in one way or another
contributed and extended their valuable assistance in the preparation and
completion of this study.
First and foremost I express my sincere thanks and heartfelt
gratitude to my Chief Dr R Geetharani M.D. for her patience, constant
support and guidance that served as a shining light throughout this trying
period.
I sincerely thank Dr M Manoharan for giving me permission to
conduct this study.
I would also like to thank my unit assistant professors Dr
Mohammed Rafi MD, Dr Rathnakumar MD & Dr Jawahar MD for
guiding me at each step of the way & their steadfast encouragement for
completing this dissertation.
My sincere thanks to the Assistant professors of medical
biochemistryand a private laboratory for providing the necessary
investigations without which this study would have been absolutely
impossible.
No words of gratitude will be enough to thank my parents & my
wife for their never-ending unconditional support and encouragement at
each step of the way.
Last but not the least, the almighty Lord, for answering my prayers,
giving me the strength to tread on and showing me the light when things
ABBREVIATIONS
CLD : Chronic liver disease
DCLD : Decompensated Chronic liver disease
PT – INR : Prothrombin time – International Normalized Ratio APTT : Activated partial thromboplastin time
Hb : Haemoglobin
MCV : Mean Corpuscular Volume MCH : Mean Corpuscular Haemoglobin
MCHC : Mean Corpuscular Haemoglobin Concentration PCV : Packed Cell Volume
TC : Total Count
DC : Differential Count
DIC : Disseminated Intravascular Coagulation RBC : Red Blood Cell
WBC : White Blood Cell
Fe : Iron
CONTENTS
S.NO TITLE PAGE
NO
1.
INTRODUCTION 1
2.
AIM OF THE STUDY
2
3.
REVIEW OF LITERATURE
3 to 43
4.
DESIGN OF THE STUDY
44 to 50
5. OBSERVATION
&
DATA
ANALYSIS
51 to 70
6.
DISCUSSION
71 to 84
7.
CONCLUSIONS
85 to 87
8.
BIBLIOGRAPHY
88 to 94
PROFORMA
MASTER CHART
INTRODUCTION
“Is life worth living? It all depends on the liver “ quoted the well known American philosopher William James (1842 – 1910)
The liver is the largest organ in the body1 and one of the most complex functioning organs with a wide array of functions.
It plays a major role in carbohydrate, protein, lipid metabolism; inactivation of various toxins, metabolism of drugs, hormones, synthesis of plasma proteins & maintenance of immunity (Kupffer cells).
Right from being a primary site of haematopoiesis in fetal life to maintenance of hematological parameters in postnatal life; the liver has an extremely important role in maintenance of blood homeostasis.
It acts as a storage depot for Iron, Folic acid & Vitamin B12, secretes clotting factors and inhibitors. Hence it’s not surprising to see a wide range of hematological abnormalities in liver diseases.
In chronic liver disease the presence of jaundice, liver cell failure, portal hypertension and hypersplenism, reduced red cell half- life all influence peripheral blood picture2. Both Liver cell failure & cholestasis can derange the coagulation
system. Dietary deficiencies, bleeding, alcoholism and abnormalities in hepatic synthesis of proteins used for blood formation or coagulation add to the problem liver disease3.
AIM OF THE STUDY
1. To assess the hematological abnormalities in decompensated chronic liver disease
2. To detect RBC abnormalities in patients with decompensated chronic liver disease
3. To determine severity, morphology & most common type of anemia in chronic liver disease.
4. To perform iron studies and to determine the most common type of anemia. To correlate ferritin and transferrin levels with the severity of liver disease. 5. To determine folic acid levels in cirrhosis
6. To determine Vitamin B12 levels and correlate with the severity of liver disease
7. Quantitatively assess WBC abnormalities
8. To detect platelet abnormalities in decompensated chronic liver disease
REVIEW OF LITERATURE
The liver is the largest organ in the body comprising 1/50th of the total adult body weight4. The median liver weight is 1,800 g in men and 1,400 g in women5. It is
[image:12.595.225.376.276.417.2]relatively larger in infants being about 1/18th of the total body weight. Sheltered by the ribs in the right upper quadrant, it consists of two anatomical lobes – right and left, the right lobe being about 6 times larger than the left.
Figure 1: ANATOMICAL LOBES OF LIVER
Figure 2: COUINAUDS SEGMENTS OF LIVER
The right anterior sector contains segments V & VIII, the right posterior sector VI & VII. The left lateral sector contains segments II & III, the left medial sector being segment IV. Segment I the equivalent of the caudate lobe does not derive blood directly from the major portal branches or drain by any of the 3 major hepatic veins. This functional classification allows interpretation of radiological data and is of importance to the surgeon planning a liver resection.
MICROANATOMY OF THE LIVER
trac and oxy in z
Figu
Rappap ct. The acinu
The var third quali ygen and nu zone 3 (periv
ure 4: RAPPA
port11 envisa us occupies rious zones ity with reg utrient rich b
venular) are
[image:14.595.216.385.127.268.2]APORT COM
Figure 3:
aged a serie adjacent se 1, 2, 3 rep gard to oxy blood wher e more pron
MPLEX ACIN
: HEPATIC L
es of functio ectors of nei present area ygen and nu
eas zone 3 ne to anoxic
NUS
LOBULE
onal acini e ighboring h s supplied w utrient conte
receives th injury.
Figure
each centere hexagonal fi
with blood ent. Zone 1 e least. Hen
5: BLOOD S
ZONES
ed on the po ields.
of first, sec 1 received m
nce hepatoc
SUPPLY &
ortal
FUNCTIONS OF THE LIVER
Impressed by the molding against adjacent organs, William Osler quipped that the liver was present only for packing purposes12!
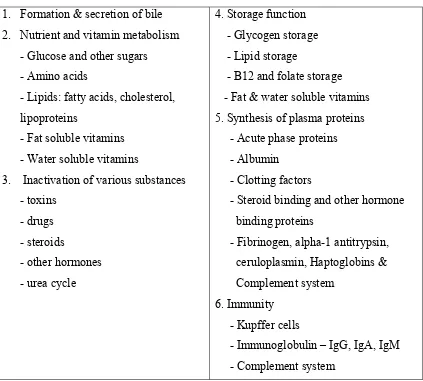
[image:15.595.88.511.257.638.2]Quite the contrary, the liver being the largest organ in the body is also the most versatile and functionally heterogeneous organ with a wide array of functions absolutely essential for life.
Table 1: FUNCTIONS OF LIVER13
1. Formation & secretion of bile 2. Nutrient and vitamin metabolism
- Glucose and other sugars - Amino acids
- Lipids: fatty acids, cholesterol, lipoproteins
- Fat soluble vitamins - Water soluble vitamins
3. Inactivation of various substances - toxins
- drugs - steroids
- other hormones - urea cycle
4. Storage function - Glycogen storage - Lipid storage
- B12 and folate storage - Fat & water soluble vitamins 5. Synthesis of plasma proteins - Acute phase proteins - Albumin
- Clotting factors
- Steroid binding and other hormone binding proteins
- Fibrinogen, alpha-1 antitrypsin, ceruloplasmin, Haptoglobins & Complement system
6. Immunity - Kupffer cells
CIRRHOSIS
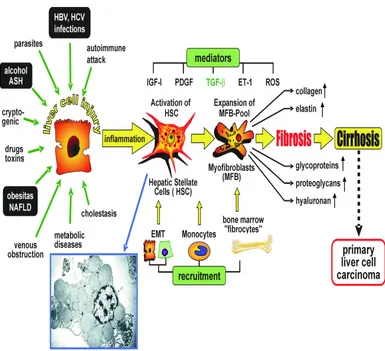
Cirrhosis is the end result of the fibrogenesis that occurs with chronic liver injury/disease. It is defined anatomically as a diffuse process with fibrosis and nodule formation, characterized by 3 main morphological features14 - Bridging fibrous septa connecting portal tracts with one another and with the terminal hepatic veins.
- Parenchymal nodules representing regenerating nodules of hepatocytes - Disruption of liver architecture
In clinical terms cirrhosis may be described as being decompensated or compensated15
Compensated Cirrhosis:
Many patients are found to have abnormal liver tests during routine medical or preoperative examinations; the liver test abnormalities being relatively minor. On physical examination the detection of an unexpected hepatomegaly or splenomegaly may trigger further investigations.
Decompensated Cirrhosis:
Decompensation means cirrhosis complicated by one or more of the following features: jaundice, ascites, hepatic encephalopathy or bleeding varices. Ascites is usually the first sign. Hepatorenal syndrome, hyponatremia and spontaneous bacterial peritonitis are also features of Decompensation but in these patients ascites invariably occurs first.
CHRONIC LIVER DISEASE
Liver disease lasting for more than 6 months is called chronic liver disease manifesting pathologically as cirrhosis.
AETIOLOGY-CIRRHOSIS Table 2: Causes of cirrhosis17
• Alcoholic cirrhosis
• Post necrotic / post infective HCV, HBV, HBV & HDV
• Non alcoholic steatohepatitis
• Autoimmune hepatitis
• Biliary tract diseases – primary biliary cirrhosis, secondary biliary cirrhosis,
primary sclerosing cholangitis etc.
• Metabolic disorders: - Wilsons disease - Hemochromatosis
- Alpha 1 Anti Trypsin deficiency - Glycogen storage diseases - Cystic fibrosis
- Galacatosemia
- Hereditary fructose intolerance - Hereditary tyrosinemia
- Ornithine transcarboymylase deficiency
• Cardiac cirrhosis
• Chronic Budd Chiari syndrome
• Veno-occlusive disease
• Sarcoidosis
[image:17.595.86.512.188.630.2]PATHOGENESIS
[image:18.595.106.491.318.669.2]The hepatic stellate cell is the principal cell involved in fibrogenesis18. Normally they lie within the space of Disse and are vitamin A storing cells. With sustained injury due to any cause, under the influence of various cytokines it transforms into a myofibroblast like cell which lays down type I & III collagen in the space of Disse and periportal areas. Continued injury leads to perpetual deposition of collagen and fibrosis accompanied by regeneration of hepatocytes in the form of regenerative nodules surrounded by fibrous scars resulting in cirrhosis.
CLINICAL EFFECTS OF CIRRHOSIS
[image:19.595.107.495.201.743.2]The Clinical manifestations of chronic liver disease are due to portal hypertension and liver cell failure20.
Table 3: STIGMATA OF CHRONIC LIVER DISEASE22
FACE
-Frontal balding -Pallor
-Jaundice
-Parotid enlargement -Madarosis
-Xanthelasma
-Telangiectasia / paper money skin -Cirrhotic facies
-Signs of vitamin deficiencies -Fetor hepaticus
HANDS
-Palmar erythema
-Flapping tremor -Leuconychia -Clubbing
-Dupytrens contractures
SKIN -Bruising
-Spider nevi -Scanty body hair -Pigmentation
NUTRITION -Glossitis
-Angular stomatitis -Bitot spots
-Muscle wasting -Anemia
ENDOCRINE
-Gynecomastia in men
-Breast atrophy in women -Testicular atrophy -Impotence
FEATURES OF PORTAL HYPERTENSION
-Splenomegaly -Ascites
ROLE OF THE LIVER IN HAEMATOPOIESIS
In prenatal life, the liver acts as a primary site of haematopoiesis along with the spleen. Peak hepatic haematopoiesis occurs at about the 4 to 5th month of gestation, declines thereafter and stops by the 8 to 9th month when the bone marrow takes over. In postnatal life, it continues to play a key role in supporting haematopoiesis23. In certain pathological states (myeloproliferative disorders, Thalassemia) the liver rekindles its role as a primary haematopioetic organ24.
Though 85 to 90 % of the Erythropoietin is secreted from the peritubular interstitial cells of the kidney, the remaining 10 to 15 % is secreted from the liver25. It acts as a storage depot for folic acid and vitamin B1226, which is necessary for RBC and WBC maturation. By secreting Transcobalamine II27, it helps in transporting B12 from the site of absorption and storage to haematopioetic cells in the marrow. The liver plays an important role in Iron metabolism. Transferrin is an iron transporting protein secreted by the liver28, which transports Iron from the site of absorption to the bone marrow for haemoglobin and RBC synthesis.
It regulates iron absorption by secreting Hepcidin; a molecule that down regulates Ferroportin and reduces Iron absorption; Anemia, hypoxia and low iron stores reduces Hepcidin production and thus enhances iron absorption29.
The liver is a primary reticuloendothelial organ containing plenty of Kupffer cells, which are an intrinsic part of the innate immune system and one of the most important Antigen presenting cells.
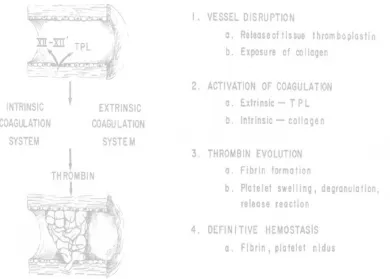
fluid The the inte coag test casc Normal d state &pe e pathologic
When a formation o eraction bet gulation me
and bleedin cade and th
N
l haemostas rmits the fo cal counterp
Figu
a small vess of a tempora
tween the echanism33. ng time. It i hose receivin
NORMAL
sis is a tigh ormation of part of haem
ure 8: The No
sel is damag ary hemosta vessel wal . This phas is normal in ng anticoag
L HAEM
htly regulat a haemosta mostasis is th
ormal haemo
ged, a casca atic plug tha ll and plat
e of haemo n patients w gulant thera
MOSTASIS
ed process atic clot at th
hrombosis.
ostatic sequen
ade of event at defends a telets and ostasis is m with abnorma
apy. The ble
S
that mainta he site of va
nce32
ts is initiate against bloo not primar measured wi alities of the eeding time
ains blood ascular inju
ed that resul od loss. The rily the blo ith a tourni e blood clot e is abnorma
in a ury31.
pati vess refle end vasc
ients with q sel wall. After in ex neuroge othelin. • Endothe causing factor. collagen • Platelet to flat secretor to form The fo cular dama quantitative nitial injury enic mecha elial injury g platelet ad
It has been n, they unde t activation
plates wit ry granules. m the tempor
ormation of age may b
e or qualitat
y there is tra anisms & s
y exposes dhesion bo n establishe ergo transfo
[image:23.595.129.465.461.663.2]results in d th markedl . Within mi rary primary
Figure 9: Pr
f the initia be visualiz tive defects ansient arte supplement highly thr th directly ed by Hovig ormation35. dramatic sha
ly increased inutes the se y haemostat
rimary haemo
al temporar ed as a c
s in platele
eriolar vaso ted by secr
rombogenic and indire g, that whe
ape change d surface ecreted prod
tic plug36.
ostatic plug37
ry haemost chain of e
ets or abnor
constriction retion of f
subendoth ctly via Vo en platelets (from smal area) and ducts recrui 7 tatic plug vents invo rmalities of
n34 mediated
factors such
helial colla on Willi Br
are expose
ll rounded d the release it more plate
vaso resu proc aggr of t tran
oconstrictio ulting in rel cess continu
regate of p the tempora nsformation
on, collage lease of ade ues until the
latelets. Th ary haemost
is brought
[image:24.595.106.496.256.535.2]n exposure enosine diph e vessel lum e second ph tatic plug in about by ac
Figure 10: S
e, reaction hosphate an men is comp hase of hae nto a more ctivation of
Secondary ha
ns between nd further a pletely occlu emostasis in
permanent the blood-c
aemostasis39:
n platelets dherence of uded by a lo nvolves the t or definiti clotting casc
and colla f platelets. oose, revers transforma ive plug38. cade.
The coagulation cascade is essentially a multiplying series of enzymatic conversions40 involving a cascade of clotting factors culminating in the formation of a definite fibrin clot. All clotting factors are synthesized in the liver except Von Willi Brand factor & Factor VIII. The vitamin K dependent factors41 are II, VII, IX, X; these factors undergo Gamma carboxylation of glutamic acid residues to form the active molecules in the liver.
There are 2 major pathways by which prothrombin is converted to thrombin, the intrinsic and the extrinsic pathways42.
The intrinsic pathway is initiated by the activation of the Hageman factor, or
factor XII.
Wettable surface, such as glass, powdered diatoms; micelles of long chain fatty acids and collagen fibers are capable of activating the Hageman factor.
Once factor XII is activated it initiates a series of reactions in which the varying blood-clotting factors are sequentially converted from their precursor form to their active or enzymatic form.
Thus, activated factor XII activates factor XI, or plasma thromboplastin antecedent, which in turn activates factor IX, or the Christmas factor, which in turn activates factor VIII, or the antihemophilic factor. Activated factor VIII then activates factor X, known as the Stuart factor.
Activated factor X in the presence of coagulation factor V and platelet lipids converts prothrombin to thrombin.
Under the influence of factor XIII, this loose polymer is transformed by the formation of covalent cross-links into a dense, irreversible aggregate that is called the definitive hemostatic plug.
The extrinsic pathway is another mechanism by which prothrombin may be
activated.
Many tissues like endothelium lined blood-vessel walls, lung and brain, contain a lipid-protein complex directly capable of activating factor X in the presence another cofactor called factor VII.
mea part (Int
fibr bind
The fun asured by s tial thrombo
ernational n The PT inogen. Tis ds calcium
nctional act standardized oplastin tim normalized T assay asse
[image:27.595.110.494.111.490.2]sue factor & and preven
Figure 11
tivity of th d assays44 – me, the extri
ratio). esses the ex & phospholi nts spontane
: Coagulation
he two arm – The intrin
nsic pathwa
xtrinsic path ipids are ad eous clottin
n cascade43
s of the co nsic pathwa ay by the P
hway name dded to citra ng), after wh
oagulation c ay measure Prothrombin
ely factors I ated plasma hich exogen
cascade can ed by Activ n time with
II, V, VII, X (sodium ci nous calcium
n be vated
INR
added to the mixture to initiate clotting; the time needed for a fibrin clot to form is measured.
The Activated partial thromboplastin time assess the function of the Intrinsic pathway namely factors XII, XI, IX, VIII, X, V, II & fibrinogen. In this assay, clotting is initiated by the addition of wetting surfaces like ground glass, which then activates Hageman’s factor, phospholipids and calcium& the time taken for a fibrin clot to form is noted.
Once activated, the coagulation cascade is restricted to the site of vascular damage, to prevent excessive run away clotting in the vascular compartment;
3 categories of endogenous anticoagulants45prevent clotting.
• Anti Thrombin III inhibits activity of thrombin and other serine proteases – IXa, Xa, XIa and XIIa. Anti thrombin III is activated by heparin like molecules and hence the action of heparin as an anticoagulant.
• Protein C & S – Vitamin K dependent endogenous anticoagulants that act in a complex that proteolytically inactivated Factor Va & VIIIa.
• TFPI – Tissue factor pathway inhibitor inactivates tissue factor – VII complexes.
Figure 12: Fibrinolysis:47
Thus we see that the liver plays an essential role in all stages of haemostasis.
• Through the synthesis of Thrombopoietin, it stimulates platelet synthesis whose main function is the formation of the primary haemostatic plug.
• All clotting factors except VWF & VIII are synthesized in the liver. Activation of the clotting factors through a waterfall cascade leads to the formation of the definitive haemostatic plug.
• Liver is the site of Vitamin K storage, which is needed for the posttranslational gamma carboxylation glutamic acid residues of coagulation factors II, VII, IX & X. Vitamin K is also required for the synthesis of endogenous anticoagulants – protein C & S.I
• Inhibitors of coagulation, that is endogenous anticoagulants are also synthesized in the liver – Antithrombin III, Protein C & S.
IRON METABOLISM
An average persons diet48 contains about 10 to 20 mg of iron, most in the form haeme contained in animal products, while remainder being inorganic iron in vegetables. About 20 % of the haeme iron is absorbable in contrast to 1 to 2 % ofnon- haeme iron.The total body iron content can be divided into functional and storage compartments.
Table 4: IRON DISTRIBUTION IN ADULTS 49: COURTESY ROBBINS PATHOLOGY
About 80% of the functional iron is found in haemoglobin, myoglobin and iron containing enzymes such as catalase & cytochromes.
The storage pool represented by haemosiderin and ferritin contains about 15 to 20% of total body iron, females in the reproductive age having less due to menstrual blood loss. Iron in the body is recycled extensively between the functional and storage pools.
POOL MEN WOMEN
TOTAL 3450 mg 2450 mg
FUNCTIONAL POOL
HAEMOGLOBIN
MYOGLOBIN
ENZYMES
2100mg
300mg
50mg
1750mg
250mg
50mg
STORAGE POOL
FERRITIN, HEMOSIDERIN
Tra satu wom eryt haem whi bind the Iron is
nsferrin51, w
urated with men. The m throid prec
moglobin52 ich mediate
Fig
Free iro ding iron in
Ferritin
liver, reticu
s transport which is sy iron yieldin major functio cursors in . Erythroid
iron import
gure 14: Iron
on is highl n the storage
n54is a ubiqu
uloendotheli
ed in plas ynthesized in ng an avera on of plasm the bone precursors t through re
n movemen
y toxic and e pool to fer
uitous prote ial system,
sma by a n the liver. age of abou ma transferri
e marrow s possess h eceptor-med
nt from abso
d needs to rritin or haem ein-iron com
and skeleta
an iron-bin Normally a ut 120ug/dL in is to deli
that requ igh affinity diated endoc
orption to R
be sequest mosiderin. mplex that is al muscles. I
nding glyco about 1/3rd
L in men an ver iron to uire iron y receptors
cytosis.
RBC synthes
tered. This
s found at h In the liver,
stor is fo whe ferr stor in th limi epit synt leve
red within th ound mainly Hepatoc ereas macro
Ferritin itin) is store res.
Iron Ba he proxima ited to the thelial cells;
Iron ab thesized an els. Hepcid
he hepatocy y in macrop
cyte iron is ophage iron n is stored
ed in the ly
alance is ma l duodenum 1 to 2 mg ; in women
F
sorption is nd released din inhibits
ytes; in othe phages.
s derived fr is derived f in the cy sosomes. S
aintained lar m. There is n
[image:33.595.142.448.378.638.2]lost each menstrual l
Figure 15: A
regulated b from the li iron trans
er tissues su
rom plasma from breakd ytoplasm w erum ferriti
rgely by reg no regulate
day throug loss contrib
bsorption of
by Hepcidin
iver in resp sfer from
uch as the s
a transferrin down of sen whereas hae in levels cor
gulating the d pathway f gh the shed
utes a large
dietary iron5
n57, a small
onse to inc the enteroc
spleen and b
n containin nescent RBC emosiderin
rrelate well
e absorption for iron exc ding of mu e fraction.
56
circulating creases in in
cyte to pla
bone marro
g ingested Cs55.
(aggregate l with body
n of dietary cretion whic ucosal and
g peptide th ntrahepatic asma by d
regulating Ferriportin. Hence when iron stores are adequate the liver produces more hepcidin and when iron stores are inadequate it decreases hepcidin. By inhibiting ferriportin, hepcidin not only reduces iron uptake from enterocytes but also suppresses iron uptake from macrophages, which are an important source of the iron that is used by RBC precursors to make haemoglobin. Hepcidin production is stimulated by IL-6; hence during long standing inflammation iron utilization is decreased explaining the basis of anemia of chronic disease.
Interpretation of various parameters of iron metabolism should always be done against the clinical background of the patient.
[image:34.595.93.507.436.626.2]Hepatic parenchymal cells contain appreciable amounts of ferritin, and it is known that liver disease can affect the serum ferritin levels regardless of any change in iron stores.
B12 METABOLISM
Vitamin B12 is a complex organometallic compound known as cobalamine59. Under normal circumstances humans are totally dependent on dietary vitamin B 12. Plants & vegetables contain little cobalamine; humans are dependent on animal sources for B12.
The daily requirement is 1 to 3 ug per day. Body stores are 2 to 3 mg, sufficient for 3 to 4 years if supplies are completely cut off60.
• Vitamin B12 is freed from binding proteins in food through the action of pepsin in the stomach and binds to salivary proteins called haptocorrins or R Binders.
• In the duodenum, bound vitamin B12 is released by the action by the action of pancreatic proteases. It then associates with Intrinsic factor.
• This complex is transported to the ileum where it is endocytosed by ileal enterocytes through cubulin receptors.
• With ileal cells, vitamin B12 associates with a major carrier protein Transcobalamine II (synthesized by the liver)61 and is secreted into plasma. Transcobalamine II delivers vitamin B12 to the liver and other cells of the body, including rapidly proliferating cells in the bone marrow and gastrointestinal tract.
B12 than it does in vegans, in whom reabsorption of biliary cobalamine is intact.
Cobalamine exists in a number of different chemical forms. All have a cobalt atom at the centre of a corrin ring. In nature, the vitamin is mainly in the 2-deoxyadensoyl form, located chiefly in the mitochondria. It is the cofactor for the enzyme Methyl Malonyl CoA mutase. The other major natural cobalamine is methylcobalamine, the form in human plasma and in cell cytoplasm. It is the cofactor for methionine synthase.
FOLATE METABOLISM
Folic acid (also known as folate, vitamin M, pteroyl-L-glutamic acid, and pteroylmonoglutamic acid)63 is forms of the water-soluble vitamin B9. Folic acid
is itself not biologically active, but its biological importance is due to tetrahydrofolate and other derivatives after its conversion to dihydrofolic acid in the liver.
Vitamin B9 (folic acid and folate) is essential to numerous bodily functions.
The human body needs folate to synthesize DNA, repair DNA, and methylate DNA as well as to act as a cofactor in certain biological reactions. It is especially important in aiding rapid cell division and growth, such as in infancy and pregnancy. Children and adults both require folic acid to produce healthy red blood cells and prevent anemia.
Folates act as coenzymes in the transfer of single carbon units –
HAEMATOLOGICAL ABNORMALITIES IN CHRONIC LIVER
DISEASE
Liver disease causes a large number of changes in the blood than does disease in any other organ, except the bone marrow. It serves as a primary hematopoietic organ in utero and in adult life resumes its post of haematopoiesis in certain pathological states.
BLOOD VOLUME
Plasma volume65 is increased in patients with cirrhosis, especially with long standing moderate to severe ascites. The hypervolemia may partially, and sometimes totally account for a low peripheral haemoglobin or erythrocyte level. Total circulating haemoglobin is reduced in only about half of the patients.
ANEMIA IN CHRONIC LIVER DISEASE
Anemia occurs in up to 75% of patients with CLD66. The type, severity of anemia often varies depending on the duration & severity of cirrhosis, presence of complications and possibly the underlying aetiology in many cases. Majority of the cases are either a normochromic normocytic or macrocytic anemia; if associated with haemorrhage then it may be macrocytic.
Multiple mechanisms67 operate in producing anemia –
• Haemodilution – the plasma volume is frequently increased in patients with cirrhosis, especially with longstanding ascites; this may partly and or even fully account for the low haemoglobin in cirrhosis.
coagulopathy often enhances the bleeding tendency further contributing to blood loss.
• Nutritional factors play a major role in anemia, patients often being folate deficient. Alcoholics show more nutritional deficiencies than compared to other groups.
• Portal hypertension, splenic sequestration of RBC as a part of hypersplenism.
• The bone marrow response to anemia is reduced as part of chronic disease & increased levels of inflammatory cytokines.
• Other rare causes include aplastic anemia that has been described in Non-A to E hepatitis.
• Sideroblastic anemia that may occur in alcoholics and in hemochromatosis.
• Reduced red cell survival due to multiple mechanisms
Figure 18: Alcohol and anemia
Iron overload is found to be higher among those who consume more than two alcoholic drinks per day compared to those who don’t drink. Cases of sideroblastic anemia complicating alcoholic liver disease have been reported. Alcoholics tend to be more deficient in folate due to the antifolate actions of alcohol.
RBC SURVIVAL & HAEMOLYTIC ANEMIA68
Increased red cell destruction is almost constant in chronic liver disease and liver cell failure. Subiyah and Al-Hindawi using radiolabelled red cells were able to show decreased red cell survival that co-related well with splenomegaly and portal hypertension. The mechanisms are multifactorial -
hemolytic anemia is seen chronic hepatitis, primary biliary cirrhosis & primary sclerosing cholangitis.
A rare syndrome of haemolysis with hyperlipidemia and acanthocytes has been described in patients with chronic alcoholic liver disease (Zieves syndrome). Instability of Pyruvate Kinase enzyme in alcoholic chronic liver disease contributes to haemolysis.
Table 6: ANEMIA IN DCLD69
ANEMIA IN CHRONIC LIVER DISEASE
Anemia of chronic disease
Folate deficiency
Iron deficiency (blood loss)
Aplastic anaemia (viral hepatitis, rare)
Sideroblastic (alcohol)
Hypersplenism
Microangiopathy/disseminated intravascular coagulation
(DIC) (Rare)
LIVER DISEASE & HEMATINIC METABOLISM
IRON METABOLISM
Iron status is largely influenced by the severity of chronic liver disease, complications like upper GI bleed and the use of alcohol.
In uncomplicated cirrhosis the usual pattern is a low normal serum iron levels with normal Total iron binding capacity. TIBC is a function of the amount Transferrin available in he blood. Transferrin is a Beta Globulin synthesized by the liver and hence in advanced liver disease where synthetic capacity is reduced, transferrin levels & hence TIBC is reduced.
Hepatic inflammation and necrosis tends to increase Ferritin levels both due to loss of storage capacity as well as an acute phase response. Large amounts of pro- inflammatory cytokines are produced, especially IL-6 that up regulates Hepcidin levels in the intestine and other cells. Hepcidin down regulates Ferroportin and reduced iron absorption from the intestines, hence producing a combination of high serum Ferritin levels coupled with low serum Iron and low normal Transferrin levels. This exemplifies the anemia of chronic disease, the most common type of anemia in chronic liver disease.
expression and the levels of soluble transferrin receptor increase. This can be used to distinguish storage iron depletion in the presence of acute phase response or liver disease when a raised level indicates iron deficiency.
Alcoholic liver disease (ALD) is associated with iron overload71. The exact mechanism is not known but 2 theories have been proposed – alcohol induces expression of transferrin receptor 1 in intestinal cells thereby enhancing iron absorption and also down-regulates hepcidin thereby up-regulating ferriportin and enhancing iron absorption.
VITAMIN B12 & FOLATE METABOLISM72
The liver stores folic acid & converts it to its active storage form tetrahydrofolate. Chronic liver disease is usually accompanied by folate deficiency especially alcoholic liver disease. This is largely due to dietary deficiency. Serum folate levels are almost always low.
The liver stores about 2 to 4 mg of Vitamin B12. Hepatic levels are reduced in liver disease. When hepatocytes become necrotic the vitamin is released into the blood and high serum B12 levels are recorded.
CHANGES IN RED CELL SHAPE
Wide variety of changes in the red cell shape73 may be seen.
1. MACROCYTES
Macrocytosis is commonly seen chronic liver disease per se & especially pronounced in alcoholic liver disease. The increase in MCV is due to: - there is loading of the RBC membrane with cholesterol & lecithin due to the inhibition of Lecithin Cholesterol Acyl Transferase by the accumulating bile acids. - Deficiency of folic acid & abnormalities of B12 metabolism
- Reticulocytosis associated with haemolysis and haemorrhage - Intrinsic abnormalities of bone marrow function
2. MICROCYTIC HYPOCHROMIC CELLS
Red cells are often microcytic hypochromic due to chronic gastrointestinal bleeding, leading to iron deficiency. In portal hypertension, anaemia follows gastro-esophageal bleeding and is enhanced by thrombocytopenia & disturbed blood coagulation. These patients also have increased incidence of acid peptic disease & ulcer bleed that contributes to bleeding.
3. NORMOCYTIC CELLS
This is a combination of macrocytosis of chronic blood loss and the macrocytosis inherent with chronic liver disease.
4. TARGET CELLS
5. SPUR CELLS / ACANTHOCYTES
They are cells with unusual thorny projections. Usually associated with far advanced liver disease especially alcoholic liver disease. Their appearance is a bad prognostic sign.
Bone marrow of chronic hepatocellular failure is hyperplastic and normoblastic. In spite of this, erythrocyte volume is depressed and the marrow therefore does not seem able to compensate completely for the anaemia (Relative
[image:46.595.99.499.334.672.2]Bone Marrow Failure)
Table 7: ABNORMALITIES OF RBC SHAPE IN CLD74: COURTESY OXFORD TEXTBOOK OF HEPATOLOGY
ABNORMALITY PRIMARY LIVER
DISEASE
DISEASE IN OTHER SYSTEMS
MACROCYTES MANY LIVER DISEASES
MEGALOBLASTIC ANEMIA HYPOTHYROIDISM CYTOTOXIC DRUGS
TARGET CELLS MANY LIVER DISEASES
THALASSAEMIA HYPOSPLENISM
OTHER
HAEMAGLOBINOPATHIES
SPHEROCYTES ZIEVES SYNDROME
HEREDITARY SPHEROCYTOSIS
AUTOIMMUNE HEMOLYSIS
BURNS
ACANTHOCYTES SEVERE CHRONIC LIVER DISEASE ABETALIPOPROTENEMIA
SCHISTOCYTES HEPATORENAL SYNDROME
DIC, TTP, HUS, HITT SYNDROME, MALIGNANT HYPERTENSION
STOMATOCYTES ALCOHOLIC CIRRHOSIS
WBC CHANGES IN CHRONIC LIVER DISEASE
WBC abnormalities in chronic liver disease may be due to underlying disease or complications like infection. Leucocytosis can occur in response to infection, haemorrhage, alcoholic hepatitis, cholangitis, hepatic abscess and malignancy.
Leucopenia is usually in the order of 1.5 – 3.0 * 109 cells with predominant depression of polymorphs. It may be due to hypersplenism, toxic effects of alcohol on the marrow or even ineffective haematopoiesis accompanying folate deficiency. Very little is known about the role of granulocyte colony-stimulating factor (G-CSF) or granulocyte macrophage colony-stimulating factor (GM-CSF) in leucopenia associated with cirrhosis75. Gurakar et al have shown that GM-CSF treatment for seven days in patients with cirrhosis and leucopenia resulted in an increase in the WBC count. Moreover, they showed no increase in the fraction of trapped leukocytes in the spleen.
Neutrophil function is also affected. A study by Altin et al demonstrated abnormal Neutrophil adhesion and chemotaxis in patients with decompensated chronic liver disease. There are low levels of serum complement C3.
PLATELET ABNORMALITIES IN CHRONIC LIVER DISEASE
Abnormalities in platelet count and function are common in patients with all forms of liver disease.
PLATELET COUNT
The thrombocytopenia of chronic liver disease76 (60 to 90 * 109) is very common due to multiple factors.
- Splenic sequestration
- Low levels of Thrombopoietin
- Reduced half-life possibly related to auto-antibodies - Hypersplenism
- Folate deficiency
- Alcohol induced bone marrow suppression - Low grade DIC
PLATELET FUNCTION
There is growing evidence of impaired platelet function in chronic liver disease. In particular aggregation77 is impaired in patients with advanced cirrhosis. This may be due to -
- There is reduced availability of arachidonic acid for the synthesis for prostaglandins and also a reduction in platelet ATP and 5 HT.
- Cross incubation studies suggest the possibility of a circulating factor that inhibits platelet aggregation
- HDL isolated from patients with cirrhosis inhibited ADP induced platelet aggregation.
- Even though VWB factor levels were relatively high in patients with cirrhosis, platelet-binding domains were defective contributing to defective adhesion.
- High levels of platelet immunoglobulin’s were detected particularly in primary biliary cirrhosis, alcoholic cirrhosis and chronic active hepatitis.
The measurement of bleeding time assess the contribution of platelet number and function to primary haemostasis but does not have a close relationship to bleeding time, contrary to that found in patients with bone marrow diseases like leukaemia.
HAEMOSTASIS IN CHRONIC LIVER DISEASE
The liver plays a central role in haemostasis and thrombosis. Liver parenchymal cells are the site of synthesis of most coagulation factors, the physiologic inhibitors of coagulation- protein C, protein S, and Antithrombin, and essential components of the fibrinolytic system- plasminogen, Alpha2-antiplasmin,
and thrombin activatable fibrinolysis inhibitor (TAFI)78.
Table 8: Effects of liver disease on haemostasis79
HAEMOSTASIS IN LIVER DISEASE
1. Reduced synthesis of clotting factors -Hepatic dysfunction per se
- Vitamin K deficiency
2. Reduced synthesis of endogenous anticoagulants
3. Production of abnormal dysfunctional proteins
4. Enhanced Fibrinolytic activity
- Reduced clearance of activators of Fibrinolysis - Reduced production of inhibitors of fibrinolysis
5. Reduced Hepatic clearance of activated clotting factors
6. Disseminated Intravascular Coagulation
7. Platelet abnormalities
REDUCED SYNTHESIS OF CLOTTING FACTORS
The liver is the site of synthesis of most procoagulant proteins. As a result,
decreased levels of coagulation factors V, VII, IX, X, and XI and prothrombin are
commonly observed in patients with liver failure.80 In contrast, factor VIII levels are
increased which may be related to the elevated level of its carrier protein VWF and to
decreased clearance of factor VIII from the circulation by the liver low-density
lipoprotein-related receptor.81 Factor VIII is synthesized primarily in hepatic
defects in clotting factors can arise as a consequence of hepatic failure. Because of
vitamin K deficiency or decreased production of gamma glutamic carboxylase, a
proportion of circulating vitamin K dependent coagulation factors II, VII, IX, and X
may be deficient in -carboxylated glutamic acid residues giving rise to impaired
function of these factors.
REDUCED SYNTHESIS OF ENDOGENOUS ANTICOAGULANTS
Levels of anticoagulant protein C, protein S, anti-thrombin, heparin cofactor
II, and Alpha2-macroglobulin are decreased in patients with liver disease. Because
tissue factor pathway inhibitor (TFPI) is mainly synthesized by endothelial cells,
normal levels of this protein are present in patients with hepatic failure.
PRODUCTION OF DYSFUNCTIONAL PROTEINS DYSFIBRINOGENEMIA
Fibrinogen levels are in the normal range in patients with chronic liver disease, but may be decreased in patients with decompensated cirrhosis. The dysfibrinogen is characterized by an increased content of sialic acid,82 possibly caused
by enhanced levels of glycosyltransferases in hepatocytes. Hypersialization of
fibrinogen impairs its polymerization but does not affect the interaction of fibrinogen
with platelets.
Dysfibrinogenemia accounts for the prolonged thrombin time in patients with
chronic liver disease. This should be suspected when aPTT is prolonged with normal
fibrinogen levels and fibrinogen degradation products within the normal range.
Von Willi Brand Factor
may ameliorate the hemostatic defect caused by thrombocytopenia and platelet function defects.83 In patients with liver disease the regulation of VWF multimer size and activity can be impaired because of reduced synthesis of VWF-cleaving protease ADAMTS13 (a disintegrin-like and metalloprotease with thrombospondin type 1 repeats) by stellate cells in the liver.18 However, a reduced multimer size of VWF was found in patients with liver disease, suggesting that other proteases, such as plasmin, elastase, and granzyme B, contribute to VWF proteolysis.
ENHANCED FIBRINOLYTIC ACTIVITY
There is evidence for enhanced fibrinolytic activity in patients with liver disease. Hepatocytes synthesize plasmin inhibitors such as Alpha2 anti-plasmin as
well as tissue plasminogen activator inhibitor (PAI).
In patients with cirrhosis PAI is reduced even without features of clotting activation. The clearance of Tissue plasminogen activator by the hepatocytes is decreased. The resultant increase in the ratio of plasminogen activator to its inhibitor is thought to lead to enhanced fibrinolysis.Ascitic fluid contains plasminogen activators as well as fibrin degradation products indicating active intraperitoneal coagulation. This accounts for the increased bleeding tendency following LeVeen shunt.
DISSEMINATED INTRAVASCULAR COAGULATION
CONCEPT OF REBALANCED HAEMOSTATIC SYSTEM
Because both procoagulant and anticoagulant proteins decline in patients with liver diseases, it appears that the hemostatic system is rebalanced. This may explain why most patients with liver disease usually do not exhibit severe bleeding manifestations during invasive procedures, and why patients are not protected against thrombosis.This balance is quite delicate and vulnerable to be tipped toward bleeding or thrombosis depending on the particular trigger that is inflicted.
IMPAIRED HAEMOSTASIS CHANGES THAT PROMOTE
HAEMOSTASIS
Thrombocytopenia Elevated levels of VWF
Platelet function defects Decreased levels of ADAMTS-13 Low levels of factors II, V, VII, IX, X,
and XI
Elevated levels of factor VIII
Vitamin K deficiency Decreased levels of protein C, protein S, antithrombin, alpha2-macroglobulin, and heparin cofactor II
Dysfibrinogenemia
Elevated t-PA levels Low levels of plasminogen Low levels of 2-antiplasmin, factor XIII,
[image:53.595.87.506.260.588.2]and TAFI
DESIGN OF THE STUDY
MATERIALS AND METHODS
To assess the hematological abnormalities in decompensated chronic liver disease, a cross sectional analytical study was conducted in Tirunelveli Medical College hospital from June 2011 to September 2012.
50 patients admitted to the General Medical and Intensive Medical care unit with clinical features suggestive of decompensated chronic liver disease were taken up for the study.
Patients suffering from acute liver cell failure, known GI malignancy or known primary hepatocellular carcinoma, primary coagulation disorders , liver cell failure due to infective causes, from end stage medical diseases like COPD, Coronary artery disease, cardiac failure, CKD were excluded from the study.
All patients taken up for the study were evaluated in detail. Oral consent was obtained for clinical examination and lab investigations. Written consent was obtained for procedures such paracentesis, Upper GI endoscopy and viral marker studies. Following points were noted in history
• Fatigue and weight loss
• Anorexia and flatulent dyspepsia
• Abdominal pain
• Jaundice, itching, colour of urine and feces
• Swelling of legs and abdomen
• Haemorrhage – haemetemsis, malaena, nose, gums, skin
• Urine output
• Past history : jaundice, hepatitis, drugs ingested, blood transfusions, diabetes, hypertension, tuberculosis, coronary artery disease, trauma, surgeries, needle prick injuries
• Personal history – Alcoholism, smoking, high risk behaviour
• Family history – liver disease, autoimmune disease A detailed clinical examination was done in all cases
• Nutrition, fever, fetor hepaticus, jaundice, pigmentation, purpura, clubbing, white nails, vascular spiders, palmar erythema, gynecomastia, testicular atrophy, distribution of body hair, parotid enlargement , dupytrens contractures, vital signs.
• Abdomen – ascites, abdominal wall veins, liver , spleen , bruits
• Neurological changes – mental functions, flapping tremor and constructional apraxia
Patients were submitted to a number of blood investigations; samples obtained were personally handed over to the lab and results were obtained in person. Blood samples were anticoagulated when needed with EDTA.
Clinical findings are supported by USG evidence of cirrhosis, which can detect 95 % of cirrhosis (Schalm Sw. The diagnosis of cirrhosis J.Hepatol 1997; 27:1118)
After establishing the diagnosis, patients were evaluated for hematological abnormalities. All investigations were done at the clinical pathology lab at Tirunelveli Medical college hospital except Iron studies, folate, B12 and fibrinogen levels which were done at an outside lab due to unavailability at the medical college laboratory.
RBC abnormalities
1. RBC Count – RBC count are done in Neubauers chamber using Hayems fluid or autoanalyser.
Normal value – 4.5 to 6 million per mm3
2. Hemoglobin estimation - done by Sahlis method, based on conversion of hemoglobin to acid hematin or auto analyzer.
Normal value – Male – 14 to 18 gm %, females – 12 to 16 g % 3. Packed cell volume (PCV): It is done in autoanalyser or using
microhematocrit capillary method.
Normal value : Male 42 to 52%. Female: 37 to 47 % 4. MCV, MCHC, MCH:
- are estimated by autoanalyser MCV - 80 to 97 fl
5. Peripheral smear for blood picture
Using stains, blood picture is examined with a standard lab microscope. Low power field examination:
Quality of film
Number, distribution and staining of WBCs RBCs examination
High power field examination:
Assess RBC – Size, Shape,Hemoglobin concentration Oil immersion examination:
Assess atypical cells and inclusion bodies 6. Reticulocyte count:
Stain - 1% brilliant cresyl blue Normal - 0.2-2%
To assess WBC abnormality:
1. Total WBC count: Done by QBC method or using Neubauer's chamber with Turke's fluid
Normal 3,800-9,000 cells per mm3
2. Differential count: Assessed by QBC method or direct staining and visualizing with lab microscope.
To Assess hemostasis
1. Platelet count : estimated by autoanalyser, if found to be low, collaborated with peripheral smear; if discrepancy between platelet count and peripheral smear then a manual count was done manually by Rees‐Eecker method i.e with staining with brilliant cresyl blue dye.
3. Activated partial thromboplastin time: Normal 24-34 sec. 4. Fibrinogen levels
Reference range – 150 to 400 mg/dL Iron Studies (chemiluminescent method)
• Serum iron (50 to 170ug/dL)
• Ferritin levels (10 to 291 ng/ml)
• Iron binding capacity (250 to 450 ug/dL)
• Transferrin (176 to 280 ug/dL)
• Transferrin saturation (20 to 50%)
Folate levels (> 5.38 ng/ml) (chemiluminescent method) B12 levels (118 to 800 pg/ml) (chemiluminescent method)
Upper GI endoscopy
INCLUSION CRITERIA
1. All patients with liver disease whose symptoms and signs persists for more than 6 months
2. Alcoholic cirrhosis, post-necrotic cirrhosis, metabolic causes of liver diseases were taken up for the study
EXCLUSION CRITERIA
1. Patients with underlying malignancy or known primary hepatocellular carcinoma were excluded
2. Patients with primary coagulation disorder or primary abnormalities of haemostatic function were excluded.
3. Acute hepatic failure was excluded
4.Patients with preexisting anemia due to other causes were excluded.
deco from 50 dep (14% was wer
This a ompensated m June 2011
patients w artment we %).
The age s 48 yrs. 70% re younger t
Ag 20 to 30 to 40 to 50 to >6
OBSER
analytical d chronic li1 to Septem
with decom ere taken fo
T
e range was % of the pat than 30 year ge o 30 o 40 o 50 o 60 60
RVATIO
study to iver disease mber 2012. [image:60.595.108.491.192.399.2]mpensated c or the study
Table 10: AGE
s from 24 to tients were rs. FEMALES 14%
SAM
Males 2 4 16 17 4ON & DA
assess the e was condu
chronic live y; this inclu
E DISTRIBUTI
o 70.The av between 40
MALES 86%
PLE
SIZE
Fema 0 3 2 0 2
ATA ANA
e haemato ucted at Tier disease uded 43 ma
ION OF CASE
verage age o 0 and 60 yea
E
=
50
ales 0 2 0 2
ALYSIS
ological ab runelveli Madmitted t ales (86%)
ES
of the patie ars of age.
Total 2 7 18 17 6
S
bnormalities Medical Colto the med and 7 fem
nts in the st Only 2 pati
aeti them (<30 AU Ae Alc He He Au He Wi Un 52% of ology of ch m had clin
0yrs) one p
HEPA UTOIMMUNE HAEMACHR TOSIS, WILSON DISEASE, UND
A
etiology of c coholic live epatitis B epatitis C utoimmune emochroma ilsons disea ndetermined
f the patien hronic liver
ical and ra patient had h
[image:61.595.91.504.71.365.2]HEPATIT ATITIS C, 1 , 3 ROMA 1 S 1 DETERMINED , 12
ETIOLO
cirrhosis er disease atosis ase dTable 11: AET
nts had alc disease cou adiological
hemochrom
TIS B, 6 D
OGY
OF
C
TIOLOGY OF
coholic cirrh uld not be d
features of matosis & th
AL DIS
CHRONI
Male 26 5 1 1 1 0 9 F CIRRHOSIShosis all of determined
f cirrhosis. he etiology w
COHOLIC LIVER SEASE, 26
C
LIVER
Fem 0 1 0 2 0 1 3 S
f whom we in 24 % of
Of the 2 was unknow
R
DISEAS
ALCOHOLIC HEPATITIS B HEPATITIS C AUTOIMMU HAEMACHR WILSONS DI UNDETERM male ere males. cases but a young pati wn in the ot
6 patients had Hepatitis B and 1 had Hepatitis C; all these 7 patients had cirrhosis. Autoimmune hepatitis and cirrhosis were present in 2 females and 1 male patient.
PAST HISTORY OF JAUNDICE
Of the 50 patients with DCLD only 14 patients gave past history of jaundice. Serology proved that 4 patients had hepatitis B and 1 had hepatitis C. One female patient had recurrent history of jaundice and was diagnosed as a case of Wilsons disease.
SERUM PROTEINS
Since one of the major functions of the liver is to synthesize proteins, the total proteins and albumin to globulin ratio was assessed in this study.
Table 12: TOTAL PROTEIN LEVELS
Among 50 patients only 16 % of patients had a total protein level between 6 to 7 g/dL. The rest 84 % had a total protein less than 6 g/dL; majority (60%) falling between 5 to 6 g/dL. 4 patients had a total protein below 4 g/dL. These 4 patients had severe liver disease with an average CPS score of 13; hence reflecting the poor synthetic function of the liver.
Total protein (A + G) Number of Patients %
< 4 4 8
4 to 5 8 16
5 to 6 30 60
6 to 7 8 16
chro than 0.6 with aver CPS refle f Table 13 The Al onic liver d n 0.5 with a with an av h an averag
rage CPS sc S score of 8
This cle ected by a h
Number o Average C Number of patients 3:
ALBUMIN-lbumin to G disease. As
an average C verage CPS
ge CPS of core of 9.2, .3 & only 1 early shows higher Child 0 of patients CPS Score 1 3 0 5 10 15 20 25 30 -GLOBULIN R Globulin ra evident from CPS of 13.6
of 13.5, 8 10.3, 26 pa 10 patients patient had s that lower d Pugh Scor
< 0.5 0.51 to 0.6 3 2 13.6 13.5 3 2 13.6 13.5 Album
A/G
R
RATION AND
atio was rev m the abov 6, 2 patients
patients ha atients had s had an A/ d an A/G ra r the A/G r re. (P value
0.61 to 0.7 0.71 to 0.8 8 26 10.3 9.2 8 26 10.3 9.2
min Globulin
Ratio
&
D AVERAGE C
versed in a ve chart, 3 p s had an A/ ad an A/G r an A/G rat G ratio of 0 atio of .93 w ratio more s
– 0.03 )
0.81 to 0.9 0.9 to 10 1 8.3 7 10 1 8.3 7
n Ratio
&
CPS
CHILD PUGH
all patients patients had /G ratio in b ratio in betw
tio of 0.71 0.81 to 0.9 w with a CPS s
severe the l
91 1 7 Num Aver H SCORE as expecte d A/G ratio
type
Hb less
f
Patients e of anemia
90% of level above s than 6 g/dL
Males Females Total 0 2 4 6 8 10 12 14 16 18 20 Number of patients
s were analy was charac
T
f the patient e 12 g/dL. A
L. All these
< 6 5 2 7 5 2 7
H
ANAL
yzed for the cterized with
Table 14: HAE
ts were ane About 14 %
patients ha 6.1 to 8 11 0 11 11 0 11 Haem
Haemoglo
LYSIS OF
e presence o h help of pe
EMAGLOBIN LE
emic with o % of patients
ad upper GI
8.1 to 10 11 2 13 11 2 13
moglobin (g/
obin
leve
F RBC
or absence o eripheral sm
EVELS IN DCL
only 10% of s had severe
bleed. 10.1 to 12 12 2 14 12 2 14 /dL)
els
in
DCL
of anemia; & mear and iro
LD
f patients h e anemia w
> 12 4 1 5 4 1 5
LD
& if presen on studies.
having a nor with an Hb v
Males Females Total 0 2 4 6 8 10 12 Number of patients Males Females Total 0 2 4 6 8 10 12 14 16 18 Number of patients <2.5 7 s 2 9 7 < 25 14 s 2 16 14 2 16 Table 15:
Table 16: H
2.5 to 3 3 11 0 11 11 10
RBC COU
RBC
C
25 to 30 9 0 9 9 0 9
Haem
RBC COUNT HAEMATOCR .1 to 3.5 3.6 to 10 4 0 2 10 6 0 4UNT in Millio
COUNT
IN
30 to 35 10 2 12 10 2 12
PCV in %
atocrit
in
T IN DCLD
IT IN DCLD
o 4 4 to 4.5 4 2 6 4 on/cumm
N
DCLD
35 to 40 6 3 9 6 3 9
n
DCLD
[image:65.595.104.497.90.402.2]othe with did DCL
The Hb er, however h Hb less th
not. This LD and was
Figure
b, RBC coun r 16 patients han 6g/dL) can probab s evident at
e 19; Individu
nt and haem s had a haem
of which 9 bly be acco all levels o
ual comparis
matocrit for matocrit bel had an upp ounted for of Hb compa
son of Hb, PC
each indivi low 25% (c per GI bleed
the haemo ared to haem
CV & RBC co
idual patien ompared to d whereas t dilution tha matocrit.
ount in each p
nt parallels e o only 7 pati
the remainin at accompa
patient
com - M 11.2 - El - 60 vari imp incl Compar
From t mpared to fe Males had m
2 Vs CPS of even males 0 % of the ious mecha paired folate In this s luded 11 ma
Average H Average P RBC count Average C
rison of the
Table 1
the above d emales. This more severe f females – had an upp males Vs 0 anisms like e absorption
study 13 pa ales and 2 fe
Hb g/dL PCV % t Mill/cumm CPS 0 5 10 15 20 25 30 35
COMPA
e Hb, RBC C
7: Hb, PCV, RB
data males s can be exp
liver diseas 8.1) per GI bleed
0 females w direct tox n and malnu atients had a females. The MALES 8.9 29.5 3.26 11.2 8.9 29.5 3.26 11
ARISON
I
Count and P
BC COUNT IN
had a wor plained by th se compared
d compared were alcoho xicity on th utrition etc.
a history or e source of b
FEMA 9. 31 4.0 8. 9.1 31.4 4 1.2
IN
MALES
PCV of mal MALES AND F
rse Hb, RB he followin d to female
to only two olics, which he bone ma
r presented bleed was c
ALES .1 1.4 01 .1 4 4.01 8.1
S
&
FEMA
es and fema FEMALES
BC count & ng facts
s (average C
o females h contribute arrow, dire with Upper confirmed to
ALES
Average Hb Average PC RBC count M Average CPales were do
& PCV pro
CPS of mal
es to anemia ect liver inj
r GI bleed. o be varicea
[image:67.595.94.487.117.471.2]upp blee of p amo T haem blee dete keep
[image:68.595.94.505.227.577.2]per GI endos ed and they portal hyper ong patient
Table 18: COM
As expe matocrit in ed. (P value ermined and
ping in min
Average H Average R Average P
scopy in all had a nega rtension). T with and wi
MPARISON O
ected, this d n DCLD pa
e Hb, RBC d compared nd the presen
Hb g/dL RBC count m/ PCV
HB,
l 13. The re ative stool o The average
ithout uppe
OF Hb & PCV
data shows atients with , PCV - <0 d among al nce or absen
UP G BL 6 /cumm 2 2 6.5 2 0 5 10 15 20 25 30 35
RBC
cou
est 37 patien ccult blood
Hb, RBC C r GI bleed.
IN PATIENTS
a statically h upper GI 0.05)The av lcoholic an nce of uppe
PER GI EED N BLE 6.5 9. 2.4 3. 1.6 31 9.8 2.4 3. 21.6
nt
&
PCV
nts did not d test (thoug Count and h
S WITH & WI
significant bleed com verage Hb, nd non-alcoh
er GI Bleed
O EED .8 .7 1.5 .7 31.5
V
in
UGI
B
A A A
give a histo gh 35 patien
haematocrit
ITHOUT UPP
lower Hb, mpared to p
RBC Coun holic etiolo in each gro
Bleed
Average Hb g/ Average RBC c Average PCV
ory of uppe nts had evide
t was comp
PER GI BLEED
27.4 1 1 2 2 3 3 Al N
Table 19: AV AL
As expe 4, 3.07), are
6.2 20.6 0 5 10 15 20 25 30 35 Alcoholic Blee lcoholic Liver Non-alcoholic disease
VERAGE Hb, P LCOHOLIC LI
ected the av e lower com
8.8 6
30
2.1
c with ed withoAlco
AL
r disease
W
c liver
W
PCV, RBC CO IVER DISEAS
verage Hb, mpared to no
6 0.06
3.1
oholic out Bleed Now
LCOHOLIC
With UGI Bleed Without UGI Bleed With UGI Bleed Without UGI BleedOUNT IN PAT SE WITH OR
Hct & RBC on-alcoholic 6.8 22.3 2.4 onalcoholic with bleed w
C
VS
NON
Average H g/dL 6.2 8 8.8 6.8 9 10.9 TIENTS WITH WITHOUT U
C count in a cs (9.3, 29.5
10.9 33.2 4.3 Nonalcoholic without bleed
NALCOHO
Hb Averag
8.7 20.6 30.06 9.3 22.3 33.2 H ALCOHOLI UPPER GI BLE
alcoholics a 5, 3.07). (P v
c d
OLIC
Avera Haem RBC Cge PCV % A M
27.4 6
29.5
C AND NON-EED
Comparing alcoholic and non-alcoholic patients with upper GI Bleed reveals that alcoholic patients with an upper GI bleed have stastically significantly lower values of Hb, PCV and RBC count compared to the latter. (P value -<0.05)
Like wise comparing alcoholic and non-alcoholic patients without any GI bleed also shows stastically significantly lower values among the alcoholic group. (P value –<0.05
CHARACTERISTICS OF THE ANEMIA
The most common type of blood picture was normocytic red cells seen in 22 patients, of which 5 patients had a normal Hb value. Macrocytic picture was observed in 15 patients. Of these 14 patients had alcoholic liver disease and the etiology was undetermined in the other. 11 patients had a microcytic blood picture of which 8 patients had an upper GI bleed and the one patient with hemochromatosis had sideroblastic anemia that was proved with bone marrow and iron studies. Dimorphic blood picture was seen in 2 patients.
Table 20: CHARACTERISTICS & MORPHOLOGY OF ANEMIA
Peripheral smear Number Average MCV
Macrocytic 15 101.8
Normocytic 22 89.9
Microcytic 11 71.39
Dimorphic 2 78
pati mar corr prod thes pati patt pati sple part
ients in this rrow respon Iron pro relate with duced and se paramete Anemia ients had iro tern was not ient had hem
Ferritin
een and bon t of the iron
0 5 10 15 20 25 30 35 c Number of patients
s study had nse to anemi
ofile was p the Hb valu stored in th ers in relatio
a of chronic on deficienc ted in 5 pat mochromato
n is a protein
ne marrow. T n profile and
33
Anemia of chronic diseas
d a reticulo ia.
IRO
erformed fo ues and det he liver, so on to the sev
Table 21:
c disease wa cy of which tients, 4 of t osis.
n-iron comp The levels o d compared
12
se Iron defi
Iron
P
ocyte count
ON STUD
or all 50 pa termine the is Transfe verity of DC
IRON PROFIL
as the most h 11 patient these patien
plex that is of ferritin w to the Child
2
iciency Iro
Profile
in
t < 1.2 %
DIES
atients in th type of ane rrin. Hence CLD were a
LE IN DCLD
common ty ts had Upp nts had alco
found in hig were determi
d Pugh Scor
5
on overload
n
DCLD
suggesting
his study gr emia. More e changes in also determi
ype noted in er GI bleed holic liver d
ghest levels ined in all 5 re.
Numbe
g an inadeq
roup in orde eover Ferrit
n the value ned.
n