Dissertation submitted to
THE TAMILNADU DR. MGR MEDICAL UNIVERSITY
In partial fulfillment of the requirements for the degree of
M.D. BRANCH XV
COMMUNITY MEDICINE
THE TAMIL NADU Dr. MGR MEDICAL UNIVERSITY,
CHENNAI, TAMILNADU.
APRIL - 2012
A CROSS-SECTIONAL STUDY ON PREVALENCE OF REPRODUCTIVE
TRACT INFECTIONS BASED ON SYNDROMIC APPROACH AMONG
CERTIFICATE
This is to certify that the dissertation titled ‘A CROSS-SECTIONAL
STUDY ON PREVALENCE OF REPRODUCTIVE TRACT
INFECTIONS BASED ON SYNDROMIC APPROACH AMONG
MARRIED WOMEN AGED 18 TO 45 YEARS IN A RURAL AREA OF
KANCHEEPURAM DISTRICT, TAMILNADU, 2011’ is a bonafide work
carried out by Dr. M. GEETHA, Post Graduate student in the Institute of
Community Medicine, Madras Medical College, under my supervision and
guidance towards partial fulfillment of the requirements for the degree of
M.D.Branch XV Community Medicine and is being submitted to The Tamilnadu
Dr.M.G.R. Medical University, Chennai.
Dr.V.Kanagasabai, M.D., Dr.A.K.Rajendran, M.D., D.P.H.
Dean, Director,
Madras Medical College, Institute of Community Medicine,
ACKNOWLEDGEMENT
I gratefully acknowledge and sincerely thank Prof. Dr. V. Kanagasabai,M.D., Dean, Madras Medical College for granting me permission to conduct this study.
I whole heartedly thank Prof. Dr. A. K. Rajendran, M.D., D.P.H., Director, Institute of Community Medicine, Madras Medical College for guiding me in this study and for his constant encouragement and support.
I feel greatly indebted toDr. V. V. Anantharaman, B.Sc., M.D., D.P.H., D.D., Assistant Professor, Institute of Community Medicine, Madras Medical College for his valuable suggestions and guidance.
I am grateful to Dr. A. Chitra, M.D., Assistant Professor, Institute of Community Medicine, Madras Medical College for her valuable time and supporting guidance.
I wish to express my sincere thanks to Dr. S. Soundammal, D.P.H., Tutor, Institute of Community Medicine, Madras Medical College for her valuable opinions.
I wish to thank my colleagues and staff at Institute of Community Medicine for their cooperation and help.
I wish to thank my parents for their moral support throughout this period.
I am indebted to all the women who participated in the study, without whose cooperation this study would not have been possible.
ABBREVIATIONS
AIDS - Acquired Immuno Deficiency Syndrome BV - Bacterial vaginosis
df - degree of freedom
DLHS - District Level Household Survey HIV - Human Immunodeficiency Virus HPV - Human Papilloma Virus
HSV - Herpes Simplex Virus
ICMR - Indian Council of Medical Research
ICPD - International Conference on Population and Development IIPS - Indian Institute of Population Sciences
IUD - Intra Uterine Device LBW - Low Birth Weight
LGV - Lymphogranuloma venereum MCH - Maternal and Child Health
NACO - National AIDS Control Organisation NFHS - National Family Health Survey NRHM - National Rural Health Mission
NS - Not significant
OCP - Oral Contraceptive Pills
RCH - Reproductive and Child Health RTI - Reproductive Tract Infections SS - Statistically significant
STD - Sexually Transmitted Diseases STI - Sexually Transmitted Infections
TABLE OF CONTENTS
Chapter No. Contents Page No
1. INTRODUCTION 1
2. OBJECTIVES 4
3. JUSTIFICATION 5
4. REVIEW OF LITERATURE 6
5. METHODOLOGY 37
6. RESULTS 42
7. DISCUSSION 63
8. SUMMARY 67
9. LIMITATIONS 69
10. RECOMMENDATIONS 70
BIBLIOGRAPHY ANNEXURES
1. Informed consent- English and Tamil 2. Questionnaire- English and Tamil 3. Modified BG Prasad’s classification 4. Study area Maps
5. Key to Master Chart 6. Master Chart
LIST OF TABLES
TABLENO.
TITLE PAGE
NO. 1 Causes of abnormal vaginal discharge 13
2 Complications of RTIs/STIs 14
3 Comparison between Etiologic and Syndromic approach
17
4 Common RTI/STI syndromes in women 19
5 Background characteristics 42, 43
6 Distribution of study population based on number of conceptions and age at first conception
47
7 Distribution of study population based on type of abortions
48
8 Distribution of study population based on history of Permanent sterilisation
49
9 Ever usage and current usage of modern spacing methods
49
10 Type of napkin used during menstrual periods 51 11 Reuse habits of study participants 52
12 Participant age group and RTI 53
13 Marital Status and RTI 53
14 Age at marriage and RTI 54
15 Duration of marriage and RTI 54
16 Religion and RTI 54
17 Participant education status and RTI 55 18 Occupational status of participants and RTI 55
TABLE NO.
TITLE PAGE
NO. 20 Socioeconomic status (SES) and RTI 56
21 Number of conceptions and RTI 57
22 Age at first conception and RTI 57
23 Number of live births and RTI 57
24 Number of abortions and RTI 58
25 Permanent sterilisation in females and RTI 58 26 Modern spacing methods ever used and RTI 59 27 Modern spacing methods used currently and RTI 59 28 Current contraceptive status and RTI 60 29 Toilet usage for urination and RTI 60 30 Washing private parts after urination and RTI 60 31 Type of napkin used during menstruation and RTI 61
32 Reuse of napkins and RTI 61
LIST OF FIGURES
FIGURE
NO. TITLE
PAGE NO.
1 Problems in management of RTI/STI (Piot-Fransen model)
15
2 Syndromic management kits 19
3 Prevalence of perceived symptoms of RTI/STI 45
4 Prevalence of various symptoms of RTI/STI among the study population
45
5 Distribution of the study population based on number and type of live births
47
6 Distribution of study population based on experience of abortions
48
7 Current contraceptive status of the study population 50
8 Personal hygiene practices among the study population
1. INTRODUCTION
Reproductive health of women is of great importance due to its implications for their own health, health of their children, family members and socioeconomic development of society. Reproductive health has several components such as fertility control, safe motherhood and prevention and control of reproductive tract infections including sexually transmitted diseases.1
The International Conference on Population and Development (ICPD) (Cairo, Egypt) in 1994 re-defined the concept of reproductive health and emphasized that prevention and treatment of Reproductive tract infections including Sexually Transmitted Infections are integral to the promotion of Reproductive health.2
Women in reproductive age group are at risk of complications from menstruation, pregnancy and childbirth. This problem is more pronounced in developing parts of the world where women often have to deal with unwanted pregnancy, unsafe abortions, problems arising out of contraception, risk of contracting reproductive tract infections (RTIs) and sexually transmitted infections (STIs) including HIV infection, different sociocultural norms and economic dependence which further reduce their capacity to protect themselves from RTI/STIs.
According to 2005 WHO estimates, 448 million new cases of curable STIs (syphilis, gonorrhoea, Chlamydia and trichomoniasis) occur annually throughout the world in adults aged 15-49 years. According to WHO-UNAIDS report 2010, there were 33.3 million HIV cases in the world at the end of 2009. This included 2.6 million new infections in 2009. South and South East Asia was the second largest contributor to this high burden with 3.8 million cases of HIV, after Sub Saharan Africa.3
In poor and developing countries, over one-third of healthy life-years lost among women of reproductive age are due to reproductive health problems including sexually transmitted diseases and HIV/AIDS, while these conditions account for only 12% in the developed world.4
According to NFHS-2 (1998-99) estimates nearly 4 out of 10 currently married women in India reported at least one reproductive health problem that could be symptomatic of a more serious RTI.5 DLHS 3 (2007-08) data reported a prevalence of 18.2% of RTI/STI symptoms among ever married women. The prevalence was higher in the rural area (19.6%) compared to urban area (15.0%). 6
Though the prevalence of RTIs show a decreasing trend, they continue to be a significant health problem among women in terms of morbidity and mortality. The women of reproductive age group constitute about one fifth (22.2%) (310.6 thousand)7 of the population of India. Therefore the unreported, undiagnosed and untreated RTI’s in this group of population creates a huge disease burden in the community.
While not all RTIs are curable, they are all preventable. The launch of National Rural Health Mission in 2005 and the integration of Reproductive and Child Health (RCH) programme- Phase II under NRHM was a significant initiative in improving rural health care delivery system. One of the important components of the RCH Program is to lead a healthy sexual life without any fear of pregnancy or contracting disease.
2. OBJECTIVES
1. To find out the Prevalence of Reproductive tract Infections among married women of age group, 18 to 45 years in a rural area of Kancheepuram District, Tamil Nadu, 2011
3. JUSTIFICATION
1. Reproductive tract infections including sexually transmitted infections are a common and serious health problem among women worldwide.
2. RTIs cause considerable discomfort and severe long term sequelae among women like pelvic inflammatory disease, cervical cancer, infertility, spontaneous abortion and ectopic pregnancy. RTIs/STIs are associated with increased transmission of HIV.
3. In poor and developing countries, over one-third of healthy life-years lost among women of reproductive age are due to reproductive health problems including sexually transmitted diseases and HIV/AIDS
4. The women of reproductive age group constitute about one fifth (22.2%) of the population of India. Therefore any unreported and untreated RTI’s in this group of population creates a huge disease burden in the community.
5. NFHS 2 data estimates that 4 out of 10 currently married women in India report atleast one reproductive health problem which could be symptomatic of a more serious RTI.
6. According to DLHS-3, the percentage of women reporting symptoms of Reproductive tract infections is much higher in rural areas (7.5%) compared to urban areas (5.8%).5
4. REVIEW OF LITERATURE
The 4th International Conference on Population and Development (ICPD) held at Cairo, 1994 marked a fundamental shift in attitudes towards population growth and acknowledged the critical importance of reproductive health to development. It was recommended that the spectrum of services be enlarged to cover total reproduction period and integrated under the strategy of Reproductive and Child Health. Following this India launched the Reproductive and Child Health (RCH) Programme in 1996 to provide integrated services.2
The RCH approach has been defined as “People have the ability to reproduce and regulate their fertility, women are able to go through pregnancy and childbirth safely, the outcome of pregnancies is successful in terms of maternal and infant survival and well-being and couples are able to have sexual relations free of fear of pregnancy and of contracting diseases.” (Fathalla, 1989). The RCH programme in addition to the components under Child Survival and Safe Motherhood Programme also included Control and Prevention of RTI/STI.8
4.1 REPRODUCTIVE TRACT INFECTIONS:
The identification of RTI/STIs as risk factors for the spread of HIV infection has contributed in a large extent to the global awareness of RTI/STIs. The incidence is relatively high in women of the age group 15-49 years; the number of AIDS (Acquired Immuno Deficiency Syndrome) cases is likely to continue to increase in the coming years. Worldwide, one million people die annually due to causes of RTI including STIs other than HIV/AIDS (UNFPA, 1997).10
4.2 PUBLIC HEALTH IMPORTANCE OF RTI’S:11
RTIs are widespread. The WHO estimates that each year, there are over 333 million new cases of curable STIs. In addition, UNAIDS calculates that in 2000 alone, 5.3 million people became infected with HIV. RTIs that are not sexually transmitted are considered even more common.11
RTIs result in numerous serious consequences, particularly in women. Pregnancy-related complications, as well as congenital infections, can result from RTIs. Pelvic inflammatory disease (PID) can develop, and can cause infertility, ectopic pregnancy, and chronic pain.
Certain infections can increase the chances of HIV transmission. Unfortunately, symptoms and signs of many infections may not appear until it is too late to avoid such consequences and damage to the reproductive organs.11
4.3 CLASSIFICATION OF RTI’S:
4.3.1 Etiological classification:11
Etiologically, Reproductive tract infections (RTI’s) refer to 3 different types of infections which affect the reproductive tract:
Endogenous infections:11
Endogenous infections result from an overgrowth of organisms normally present in the vagina. They are probably the most common RTI’s worldwide. They include bacterial vaginosis and candidiasis. These infections can be easily treated and cured. They are common worldwide and are influenced by environmental, hygienic, hormonal and other factors.
Iatrogenic infections:11
Iatrogenic infections occur when the cause of infection is introduced into the reproductive tract through a medical procedure such as menstrual regulation, induced abortion and insertion of an intrauterine contraceptive device or during childbirth. This can happen if the surgical instruments used during the procedure have not been sterilized properly or an already existing infection in the lower reproductive tract is pushed through cervix into upper reproductive tract. Examples include Pelvic Inflammatory Disease following abortion or other transcervical procedures, infectious complications of pregnancy and postpartum period.
Sexually transmitted infections:11
and childbirth. HIV, the virus that causes AIDS is perhaps the most serious sexually transmitted infection. The list of pathogens which are sexually transmissible has expanded from the “classical” venereal diseases (Syphilis, Gonorrhoea, Chancroid, Lymphogranuloma venereum and Donovanosis) to include more than 20 agents. Examples include Trichomoniasis, Hepatitis virus B, Genital herpes and genital warts.
4.3.2 Anatomical classification:12
Anatomically, RTIs are classified into 2 types:
Upper Reproductive tract infections (also called Pelvic Inflammatory Disease) which occurs in the uterus, fallopian tubes and ovaries and present with symptoms of vaginal discharge and lower abdominal pain
Lower Reproductive tract infections which occur in the vagina and cervix and present as genital discharge and genital ulcerations12
4.4 DETERMINANTS OF RTIs:13
A framework developed by Judith Wasserheit and Ward Cates, helps us understand the range of factors that affect RTI patterns.
Microbiological determinants: Changes in vaginal flora
Existence of other RTIs
Hormonal factors (including cervical ectopy and mucus)
Personal environments:
Woman’s sexual behaviour (includes age at first sexual intercourse, number of sexual partners, participation in commercial sex and partner’s sexual behaviour)
Health behaviour (including use of condom/ barrier methods, oral contraceptives, IUDs, intravaginal preparations)
Health seeking behaviour
Macro-environmental factors:
Includes socio-economic, political, demographic, geographic and technological factors.
4.5 WOMEN ARE MORE VULNERABLE TO STI OR HIV:14
Physiologically:14
Soft tissue in the female reproductive tract tears easily making it a transmission route for the microorganism
The mucosal surface area of exposure is larger in females compared to males
Vaginal tissue absorbs fluids more easily, including sperm, which has a higher concentration of HIV virus
Women are more likely than men to have other untreated STI
Socially:14
Women often cannot control with whom or under what circumstances they have sex
Women are not always empowered to discuss use of protection
Women have less access to sexual health information and services
Economically:14
Economically vulnerable women are more likely to end up in a dangerous relationship
Women in poverty are often forced to exchange sex for money, food or other favours because of their economic situation
On matters such as sexual practices, use of protection like condoms, household spending on health and access to healthcare, men tend to dominate the decision-making
Women who are not employed are less likely to have access to money to seek health care, cover the cost of testing, counselling and prescription drugs
4.6 SYMPTOMS OF RTI:14
The following are the signs and symptoms of the most common RTI/STI in women and their causes.
Blisters or ulcers (sores) on the mouth, lips, genitals, anus or surrounding areas: Chancroid, Genital herpes and Syphilis
Dysuria (Burning or pain during micturition): Chlamydia, Genital herpes, Trichomonas infection and Gonorrhoea
Warts or bumps on the genitals, anus or surrounding areas: Human Papilloma Virus (HPV) (Genital warts)
Genital itching: BV, Trichomonas infection, Vaginal Candidiasis
Abnormal and/or heavy vaginal bleeding: Chlamydia, Gonorrhoea (this symptom is often caused by factors other than STI)
Bleeding after intercourse: Chlamydia, Gonorrhoea, Chancroid, Genital herpes
Lower abdominal pain (pain below umbilical region or pelvic pain): Chlamydia, Gonorrhoea and mixed anaerobic infection
Small, dimpled bumps or lesions on the skin that usually do not hurt or itch and are flesh coloured, but can vary from white to yellow to pink: Molluscum contagiosum
Small, red lesions or ulcers in the genital or anal area; lymph node swelling in the genital area; chronic ulcers on the genitals or anus: Lymphogranuloma venereum (LGV).
Red nodules or bumps under the skin of the mouth, genitals or anus that ulcerate, become tender and often bleed easily: Donovanosis
Jaundice and/or fever, headache, muscle ache, dark urine: Hepatitis B, Hepatitis C
Dyspareunia (pain during sexual intercourse)
Vaginal discharge is one of the common presenting symptoms seen by doctors in many services (primary care, gynaecology, family planning, and departments of genitourinary medicine). Vaginal discharge may be physiological or pathological. It can be due to both infective and non infective causes. Although abnormal vaginal discharge often prompts women to seek screening for sexually transmitted infections (STIs), vaginal discharge is poorly predictive of the presence of an STI.
[image:25.595.98.506.410.732.2]Vaginal discharge can be either physiological or pathological.15
Table 1: Causes of abnormal vaginal discharge:15
Infective organisms Infective conditions Other causes
Candida albicans Trichomonas vaginalis Chlamydia trachomatis Neisseria gonorrhoeae Human papilloma virus Primary syphilis Mycoplasma genitalium Ureaplasma urealyticum Escherichia coli Bacterial vaginosis Acute pelvic inflammatory disease Postoperative pelvic infection Post-abortal sepsis Puerperal sepsis Hormonal contraception Post partum Malignancy
Personal habits and
hygiene
Retained tampon or
condom
Chemical irritation
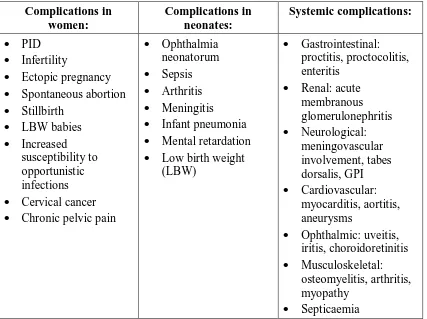
4.7 COMPLICATIONS OF RTIs/STIs:14
Table 2: Complications of RTIs/STIs: Complications in women: Complications in neonates: Systemic complications: PID Infertility Ectopic pregnancy Spontaneous abortion Stillbirth LBW babies Increased susceptibility to opportunistic infections Cervical cancer Chronic pelvic pain
Ophthalmia neonatorum Sepsis Arthritis Meningitis Infant pneumonia Mental retardation Low birth weight (LBW) Gastrointestinal: proctitis, proctocolitis, enteritis Renal: acute membranous glomerulonephritis Neurological: meningovascular involvement, tabes dorsalis, GPI Cardiovascular: myocarditis, aortitis, aneurysms Ophthalmic: uveitis, iritis, choroidoretinitis Musculoskeletal: osteomyelitis, arthritis, myopathy Septicaemia
Untreated maternal syphilis was found to be associated with adverse pregnancy outcomes like perinatal deaths, stillbirths, preterm live births and neonatal deaths in studies by Watson-Jones et al.16, McDermott J et al.17 and Mullick S et al.18 Hillier SL et al.19 has reported that presence of bacterial vaginosis was related to preterm delivery of LBW infant. Christian P et al. has reported that Gonococcal infection in mother was associated with a 5-fold increase in neonatal eye discharge and preterm delivery.20
0 20 40 60 80 100 120 Women with RTI
Symptomatic Seek treatment Go to health unit Treat correctly Compliance Treatment Partner treatment
Problems in management of RTI/STI
(Piot-Fransen model)
4.8 PROBLEMS IN MANAGEMENT OF RTI/STI (PIOT-FRANSEN MODEL):
The Piot and Fransen model of RTI/STI management sums up the problems in treatment of RTI and STI. This model illustrates the obstacles in RTI/STI control. The bottom bar represents all women with RTI/STI in a community and the bars above show how many women are identified at each step. The difference in each step describes the lost opportunities in stopping RTI/STI transmission.14
In the above figure, the comparison of the small top bar with the bottom one shows the proportion of all people with RTI/STI in the community who are identified and correctly managed at health facilities.
[image:27.595.87.511.435.703.2]According to NFHS 2 data only 3 out of 10 women suffering from RTI/STI symptoms sought health care.22 DLHS 3 data states that only 41% of those who had RTI/STI symptoms sought health care.6 The figures show very little change in health seeking behaviour among women for RTI/STI symptoms.
4.8 FRAMEWORK FOR INTERVENTION STRATEGIES:13
There are a few common elements for an interventional framework as follows:
Primary prevention of infections:
Preventing STDs by delaying age at first intercourse, reducing the number of sexual partners and promoting condoms
Preventing endogenous infections by improving knowledge of physiology and hygiene and encouraging appropriate use of antibiotics
Preventing iatrogenic infections by improving the quality of abortions, IUD insertion and childbirth practices
Identification and/ or treatment of established infections:
Standardized case management (taking into account the risk assessment component of the algorithms recommended)
Identification and treatment of asymptomatic infections
Minimizing the complications of infection:
Management of septic abortions
Early identification and treatment of pregnant women with syphilis
Cervical cancer screening and management
4.9 APPROACHES TO STI/RTI CASE MANAGEMENT:14 The two main approaches to RTI/STI diagnosis and management are
The etiological approach
The syndromic approach
4.9.1 The etiological approach:14
Though reliable for the management of RTI/STI , it is not always available to health providers in the developing world especially at primary health care level because it depends on trained laboratory technicians, availability of lab supplies and in some cases expensive, specialised equipment
Requires a second visit by the client to collect the results
4.9.2 The syndromic approach:14
In this approach diagnosis is based on the identification of syndromes, which are combinations of the symptoms the client reports and the signs the health care provider observes
The recommended treatments are effective for all the diseases that could cause the syndrome
Provides single-dose treatment as far as possible
Comprehensive: it includes patient education and counselling
Table 3: Comparison between Etiologic and Syndromic approach:14
S.No Etiologic approach Syndromic approach
1 Possible to get an exact diagnosis using laboratory tests
Diagnosis may be wrong in certain cases e.g. in case of vaginal discharge syndrome, the approach is not effective to manage Gonorrhoea and Chlamydia infection
2 Avoids overtreatment Over-treatment of patient as well as partner may happen
3 Patient must return for test results and must wait for treatment till the lab results comes
The patient is diagnosed and treated in one visit
4 More chances of lost to follow up No loss to follow up 5 Expensive as trained laboratory
technicians as well as infrastructure and supplies are needed
4.10 SYNDROMIC MANAGEMENT- INTRODUCTION:14
The Syndromic Management approach was first introduced in 1991. Since then it has been implemented in many countries through numerous programmes and research and evaluation projects supported by the WHO, UNAIDS (Joint United Nations Program on HIV/AIDS), the Commission of the European Communities, Medical Research Council (U.K.), USAID (US Agency for International Development) and others.
The Syndromic management approach is a practical way to diagnose and treat RTI/STI cases while helping to prevent further spread of the diseases. According to WHO, the flowcharts suggested for Syndromic management are based on epidemiological studies conducted throughout the industrialized and developing world and a number of validation comparisons of syndromic diagnosis with laboratory-assisted diagnosis have found them to be similar in terms of accuracy.
4.10.1 Specific relevance of Syndromic Management to RTIs/STIs:14 STIs/RTIs are apublic health problem,not about one individual
Dealing with 1 STI case is an opportunity to treat at least 1 more case
STI patients are hesitant to approach doctors
Often choose far-off doctors and do not prefer to revisit
First visit may be the last chance
Table 4: Common RTI/STI syndromes in women:14
Syndrome Symptoms Signs Most common
causes Vaginal discharge Unusual vaginal
discharge Vaginal itching Dysuria Dyspareunia Abnormal vaginal Discharge VAGINITIS: – Trichomoniasis – Candidiasis CERVICITIS: – Gonorrhoea – Chlamydia Genital ulcer Genital sore Genital ulcer
Syphilis Syphilis Chancroid Genital herpes Lower abdominal pain Lower abdominal pain Dyspareunia Vaginal discharge Lower abdominal tenderness Temperature >38° Gonorrhoea Chlamydia Mixed anaerobes
[image:31.595.85.510.101.741.2]Inguinal bubo Painful enlarged inguinal lymph nodes Enlarged inguinal lymph nodes Fluctuation Abscesses or fistulae LGV Chancroid
Figure 2: Syndromic management kits:
4.11 GLOBAL BURDEN:
RTIs and STIs including HIV are imposing an increasing burden not only on public health but also on the world’s economies, especially those of developing countries. Though there is adequate data on the worldwide prevalence of HIV and other STIs, similar estimates of other RTIs are minimal. Studies from various parts of the world present a wide range of prevalence of RTIs.
WHO Prevalence estimates for the year 1995, reported that at any point of time in 1995, on average there were 27 million people infected with syphilis, 22 million with Gonorrhoea, 81 million with Chlamydia and 107 million with Trichomoniasis. Geographically, the vast majority of these cases were in the developing world reflecting the global population distribution. South and South East Asia, which accounted for 57.2% of the global population in the 15-49 age group in 1995, accounted for 48.7% of new infections (115.5 million cases). Sub-Saharan Africa accounted for another 21.1% (50.0 million) and Latin American and the Caribbean 9.7% (23.0 million). The sex distribution of these cases was skewed towards females- 55% of the cases of syphilis, 58% of the cases of gonorrhoea, 60% of the cases of Chlamydia and 92% of the cases of trichomoniasis were in females.23
According to WHO estimates for 2005, the total number of new cases of 4 STIs in adults between the ages of 15 and 49 years was 448 million. This included 101 million cases of C. Trachomatis, 88 million cases of N. Gonorrhoeae, 11 million cases of Syphilis and 248 million cases of T. vaginalis.3
In the developing world the prevalence of the 4 major sexually transmitted infections were 188 million cases of Trichomoniasis, 101 million cases of Chlamydia, 74 million cases of Gonorrhoea and 14 million cases of Syphilis. These figures are projected to increase to 202 million cases of Trichomoniasis, 108 million cases of Chlamydia, 80 million cases of Gonorrhoea and 16 million cases of Syphilis by 2015.24
Deeb ME et al (1998) reported that the prevalence of self reported abnormal vaginal discharge was 24.5% in a rural community of Lebanon. Lower abdominal pain was the commonest symptom reported (41.1%) followed by pain after intercourse (40.7%).25
In a community-based, cross-sectional study in the rural districts in coastal, highlands and jungle districts of Peru (1997-98), by Garcia PJ et. al. 77% of women had symptoms indicative of RTIs and 70% had objective evidence of one or more RTIs. Lower abdominal pain was the commonest self reported symptom (29.3%) followed by abnormal vaginal discharge (22.9%).26
Msuya SE et al. (1999) reported from a cross-sectional study in Moshi, Tanzania that 64% of women attending primary health care clinics had atleast one RTI and 22.5% had multiple infections. Almost 27% of the women had atleast one STI (C.trachomatis, N. gonorrhoea, T.vaginalis and T.pallidum).27
Clark JL et al. (2003-05) used the syndromic management approach to assess the prevalence of STI symptoms in Peru and reported the prevalence to be 42.2% for dysuria, 32.6% for genital discharge and 6.3% for genital ulcer among women.29
Garcia-Perez H et al (2005) reported that 6% of married women in Mexico experienced constant or intermittent pelvic pain and 12% reported having pain during intercourse or within 24 hours afterwards in the previous 12 months.30
Rabiu KA et al. (2008) reported from a cross-sectional study conducted among women attending FP clinics in Lagos, Nigeria, 37.4% of RTI related symptoms in the previous six months. Vaginal discharge was the commonest symptom reported (21.8%).31
A community-based, cross-sectional study (2010) in Egypt (Oka A. Akl et al.) revealed that 75.6% of women experienced atleast one gynaecological problem. The most commonly reported gynaecological problems were symptoms of lower RTIs, reported by 51.2% of sampled women.32
4.12 SOUTH EAST ASIAN REGION (SEAR) ESTIMATES: Prevalence of STIs in adult females in 2005 in SEAR:3 C. trachomatis 1.09%
N. gonorrhoeae 0.75% Syphilis 1.37%
T. vaginalis 5.58%3 Incidence in 2005:
C. trachomatis 9.20/1000 females N. gonorrhoeae 16.32/1000 females Syphilis 3.33/1000 females
Balsara ZP et al. (1998) reported in a study on RTI among Afghan refugee women that vaginal discharge was the commonest self-reported symptom (76.5%). Over three-fourths (76.7%) of those who reported to the health clinics with reproductive complaints had an RTI. Nearly half (49.5%) of these women were diagnosed with some form of vaginitis.33
Yang LR et al. reported that in a community based study conducted in rural western China 70.3% of the interviewed women reported complaints of malodorous vaginal discharge.34
Bonetti TR et al. (2002) reported a prevalence of 33.6% of RTI/STI symptoms in rural areas of Far-western Nepal.35
4.13 BURDEN IN INDIA
Reproductive ill-health accounted for half of all illness-days and for 31% of total curative health expenditure. The 1990 Global Burden of Disease study estimated that 27.4% of disability-adjusted life years (DALYs) lost in Indian women aged 15– 44 years were attributable to reproductive ill-health. (Bhatia J and Cleland J, 2001).36
Published STI rates among ever-married women in India based on community-based studies report prevalence ranges of 0.0 to 4.2% for gonococcal infections, 0.5 to 28.7% for Chlamydia trachomatis, 0.2 to 8.8% for syphilis, 4.3 to 27.4% for T. vaginalis and 11.8% for clinical diagnosis of HPV.37
Reproductive and Child Health – Rapid Household survey (RCH-RHS) (1998-1999) estimated a prevalence of 29.7% of RTIs/STIs in India. The prevalence in Tamilnadu was higher than the national prevalence (36.5%).38
An ICMR Task Force study by Kambo IP et al. (1996-1997) across 23 districts in 14 States/Union territories found that 24.4% of women reported symptoms of RTI. This study showed a significant trend of increasing gynaecological complaints with increasing age.40
NFHS-2 estimates revealed a high reported prevalence of reproductive health problem across women in all socioeconomic groups of populations. Nearly 4 out of 10 currently married women in India reported atleast one reproductive health problem that could be symptomatic of a more serious RTI. The reported prevalence of currently married women with any reproductive health problem varied from 19% in Karnataka to 67% in Meghalaya.22
A Community based, laboratory supported STI/RTI prevalence study by ICMR-NACO, in 2002-2003 showed that 6% of adult Indian population suffer from STI/RTI in a year which adds to about 30 million episodes per year.14
Singh S (2002-2003) reported a prevalence of 46% in a study conducted by IIPS in rural areas of Maharashtra.41
DLHS 2 reported a prevalence of 32.3% of RTI/STI symptoms among married women of reproductive age group and the prevalence was higher in rural areas (33.7%) compared to urban areas (29.3%). (In Tamil Nadu 17.1%).42
Patel V et al. reported a prevalence of abnormal vaginal discharge as 14.5%s from a community-based study among married women of Goa (November 2001 to May 2003). 60% women had another co-existing gynaecological complaint.43
4.14 REPRODUCTIVE TRACT INFECTIONS- TAMILNADU
Rangaiyan G and Sureender S et al. (1996), in a community-based cross-sectional study in Salem found that approximately 76% reported atleast one current symptom of gynaecological problem. 25% of women reported to have white or coloured discharge and 19% reported symptoms suggestive of acute PID.44
Data obtained from Reproductive and Child Health-Rapid Household Survey (RCH-RHS-1&2) conducted in 1998-99 estimated that in Tamil Nadu, the prevalence of any one symptoms of RTI/STI is 36.3% which was relatively higher than the national level (29.7%). The prevalence of abnormal vaginal discharge was 32.2%, burning sensation 7.8% and lower abdominal pain 6.7%.10
Ravindran TKS et al. reported from a study in Dharmapuri district that 44.5% reported atleast one symptom of reproductive morbidity. White discharge was reported by 30% and lower abdominal pain by 10%.45
Prasad JH et al. (1996-1997) reported a high prevalence (53%) of symptoms of RTIs among young women in a rural area of Vellore District, Tamil Nadu. 45% of the symptomatic were found to have RTIs according to laboratory investigations.46
4.15 SYNDROMIC MANAGEMENT-EFFECTIVENESS:
In a study in South Africa, (Htun Y et al.) the syndromic management protocols provided adequate treatment for more than 90% of patients with genital ulcer.45 Djajakusumah T et al., (Indonesia) reported that the syndromic approach resulted in a low cost per real case treated. In addition, the cure rate for urethral discharge with the syndromic approach was 99%.48
A community-based, cross-sectional study in Vietnam by Go VF et al. (1998), estimated that about half of the study population (51.8%) experienced abnormal genital itching or vaginal discharge in the past 6 months and there was a significant association of self-reported genital itch or vaginal discharge with bacterial vaginosis (OR=2.1; 95% CI=1.1, 4.1).49
4.16 SYNDROMIC APPROACH- SHORTCOMINGS:
Choudhry S, Ramachandran VG et al. reported a high sensitivity of syndromic approach for treatment of N. gonorrhoeae and C. Trachomatis (91.83% and 96.5% respectively) but a low specificity (72-76%) which indicates that individuals were falsely diagnosed and treated. They also report low sensitivity of Genital discharge syndrome in detecting T. Vaginalis (50%), HSV-2 (5.9%) and Candida (50%).50
Ray et al. reported from a study conducted at Delhi that though a high proportion of women were diagnosed by syndromic approach, their total infection load as determined by etiological diagnosis was quite low. The sensitivity of the syndromic approach for Vaginal discharge syndrome in this study was 93.8%, but the specificity of this method in diagnosing vaginal discharge was only 37.5%.51
led to the correct management of most cases of Bacterial vaginosis and Trichomoniasis but was not much helpful in predicting cervical infection. Only 2 cases of C trachomatis were correctly managed (sensitivity 5%, specificity 93% and PPV 9%.52
Hawkes S et al. (Bangladesh, 1995) reported that the WHO algorithm of syndromic approach had a high sensitivity (100%), but a low specificity (0 for bacterial vaginosis, Candida and T. vaginalis). They estimated that between 36% and 87% of costs would have been spent on uninfected women.53
While different studies suggest concerns related to unnecessary antibiotic use resulting from the low diagnostic specificity of syndromic management, it remains an inexpensive and readily available method for the diagnosis and treatment of symptomatic STIs in both developing and developed countries.26,29
Although the syndromic approach has drawbacks, it is an essential component of STI/RTI management where resources are limited.
An important advantage is that this approach helps to ensure that the patients get effectively treated at their first and probably only contact with the health system. This also means treating for several possible infections even if the patient has only one.
4.17 INTERVIEW BASED MEASUREMENT OF PREVALENCE OF RTI:
concern with the individual experience of ill health within its social context.54This explains the need to recognise the distress and discomfort experienced by the women who suffer from symptoms of RTIs/STIs.
According to CDC the prevalence of RTI can be measured as the number of persons diagnosed with a specific RTI identified by syndromic signs/symptoms or etiologic methods at a given point in time in a population subgroup.55
In conventional health interview surveys, participation rates are usually around 90% in low income countries but much lower in Europe and North America (60-70%). When a clinical component is added or biological specimens are required, participation can drop dramatically. The participation rates depend on the characteristics of the study population, the degree of community involvement in the project, the intrusiveness of the procedures and their location (for example, at home or at the nearest clinic).56
Sadana R (Bulletin of WHO, 2000) discusses the application of interview-based measurement techniques to facilitate community-interview-based data collection. The author lists out the following merits of household interview approach in estimating prevalence of morbidity over approaches that rely on hospital statistics or medical examinations:
a greater breadth of the population is covered with higher response rates and lower cost,
interpretation of findings is simplified and
4.18 SOCIODEMOGRAPHIC FACTORS AND REPRODUCTIVE TRACT INFECTIONS:
Age is considered to be an important risk factor for transmission of RTI/STI
because the vaginal mucosa and cervical tissue of young women is immature and make them vulnerable than older women. A younger age at marriage is also
associated with lack of awareness regarding preventive measures and lesser control over their sexual and reproductive health.
Educational status and employment status play an important role in empowering women and thereby enabling them to make informed choices regarding
their reproductive life.
Oka A. Akl (2010) showed a significant association of reproductive morbidity
with age of women (highest prevalence in age group 20 to 29 years, p<0.05), education (majority affected were illiterate, p<0.01), age at first conception and
duration of marriage.32Age < 35 years was reported to be a risk factor for pelvic pain by Garcia-Perez H et al. in Mexico.30
NFHS 2 data found a significant association between prevalence of RTIs and
the age at marriage (those married before 15 years had a higher prevalence compared to those married after 19 years); education of women and that of husband.5
Kosambiya JK et al. reported the prevalence of RTI to be 53% from a community based study in the rural area of Surat. Among these women, majority
Kumar S et al. (1997-1998) reported a high prevalence of RTI symptoms
among women in Bundi District of Rajasthan. Overall, 47% of ever-married women aged 15-45 years reported atleast one symptom of RTI at the time of survey. A large
proportion of women were in the sexually active age group of 20-29 years (41%)..59
Rathore M et al. reported a prevalence of 22.3% of reproductive morbidity
among women in rural Rajasthan. They also found a significant association of RTI with increase in age and lower educational status.60
Dawn A et al. (2000-01) reported a very high prevalence of RTI symptoms in
rural areas of Singur block of West Bengal.61
Ravindran TKS et al. reported a higher prevalence of reproductive morbidity
among women living in nuclear families (48.8%) compared to those who live in joint and extended families (39.5%).45
Sharma S et al. (December 2001-March 2002) reported that the prevalence of RTIs/STIs in a rural area of Sirmour district in Himachal Pradesh was high (51.9%).
The prevalence was maximum in the age group 25-34 years and this difference was statistically significant.62
Samanta A et al. (2006-07) reported a prevalence of 13.5% of RTI/STI symptoms among women in Hooghly, West Bengal. Abnormal vaginal discharge was
4.19 OBSTETRIC HISTORY AND REPRODUCTIVE TRACT INFECTIONS:
Oka A. Akl reported a significant association with age at first conception (those who had their first conception between 20-24 years were less affected than those who had their first conceptions at younger or older ages).32Garcia-Perez H et al. reported a significant association between pelvic pain and history of Caesarean section.30
Agrawal S reported based on NFHS 2 data that number of children ever born, time since last birth, women’s current age were associated with reproductive health problems.64 Similar association of RTI with parity was also reported by Ravindran TKS et al.45, Rathore S et al.60 Sharma S et al.62 Kumar S et al.59
4.20 ABORTIONS AND REPRODUCTIVE TRACT INFECTIONS:
Induced abortion represents an important aspect of women’s reproductive health. Under the 1971 Medical Termination of Pregnancy Act, women in India can legally obtain induced abortion on physical, mental and psychological grounds. But though induced abortion is legal, it is largely unsafe and unavailable65. In 1994, governments declared for the first time that addressing unsafe abortion was a
public-health imperative.
WHO estimates that 80 million unplanned pregnancies occur each year. Approximately 26 million of these pregnancies are terminated legally and 20 million through unsafe, non-legal means, primarily in developing countries (97%).66
Agrawal S, based on analysis of NFHS 2 data reported that incidence of any reproductive health problem was 1.5 times higher (OR 1.46; 95% CI 1.33-1.60; P<0.001) among women who had one induced abortion compared with women who had no induced abortion history, increasing to 1.9 times higher (OR 1.85; 955 CI 1.52-2.27; P<0.001) among women who had two or more induced abortions after adjustment for sociodemographic and maternal factors.64
Zhang RJ et. al. reported that rural women who underwent more induced abortions were more likely to suffer from RTIs, especially cervical infection and PID. They showed that women of Anhui Province in China who underwent induced abortions had a higher prevalence of RTIs.67
Xueqiang F et al. (2007) reported significant association between 3 or more abortions and candidiasis and bacterial vaginosis in rural China.68
4.21 CONTRACEPTIVE USE AND REPRODUCTIVE TRACT INFECTIONS
Family planning is critical to prevent unwanted pregnancies and unsafe abortions and reduce maternal mortality and child mortality and to reduce poverty, and also empower women to choose when and with whom to have children. Family planning methods are related to RTIs in many ways,
certain contraceptive methods may create risks for infection or worsen pre-existing RTIs
the contraceptive methods that best protect against pregnancy are not the same that best prevent STIs including HIV infection.11
Oral contraceptive pills (especially the high dose pills) can disrupt the balance of the vaginal environment and predispose to development of Candidiasis. OCPs along with hormonal implants and Injectables may decrease risk of PID, but does not protect against STIs. Diaphragms with or without spermicide offer some partial protection against cervical infection with bacterial STIs. IUDs when inserted with improperly sterilized instruments or in a woman with untreated RTI can introduce infection into the uterus. Female sterilization carries the risk of iatrogenic infection if instruments are not properly sterilized.
The male latex condom is the single, most efficient, available technology to reduce the sexual transmission of HIV and other sexually transmitted infections.
Ever use of Contraceptive Methods:
Current Use of Contraceptive Methods:
The contraceptive prevalence rate in India is 56%. 86% of current users are using modern methods and the remaining 14% are using traditional methods. Female sterilization accounts for two-thirds of total contraceptive use. The use of the family planning programme’s three modern spacing methods together accounts for 18% of the contraceptive prevalence rate.69
Egbe CA et. al. (Nigeria) reported a 1-7 fold increase in the risk of RTIs among contraceptive users compared with non contraceptive users. Among the contraceptive users, Intrauterine device (IUD) users (53.07%;p= 0.032), users of contraceptives for less than 1 year (60.00%;p= 0.003) and those in age group of 26-30 years (68.18%;p= 0.0001) had higher prevalence of RTIs. Candida albicans was the most prevalent etiologic agent among contraceptive users.70
Wasserheit JN et al. (1989) reported from a study in rural Bangladesh that users of intrauterine devices and tubectomy were each approximately four times as likely to report symptoms and seven times as likely to have examination-confirmed infection as nonusers.71Garcia-Perez H et al. also reported that current use of IUD was associated with pelvic pain.30
Sowmini et al. reported that symptoms of RTIs were more among contraceptive users compared to non-users and specifically a higher proportion of IUD users had these problems as compared to acceptors of the female sterilisation procedure.72Riyami et al. also reported a positive association of RTI with IUD use.28
Patel V et al. in a community based study on risk factors for vaginal discharge in Goa (Nov 2001 to May 2003) found a significant association with use of IUCD (0.04).74 Similar association was also reported by Rathore M et al in rural Rajasthan.60
Warner L et al reported from a systematic review of studies that condom use was associated with reduced risk of Gonorrhoea and Chlamydia infections.75
Hawkes et al. found in their study on prevalence of RTIs among women attending NCH/FP clinics with suggestive symptoms that women with intrauterine devices or tubectomy were more likely to have an endogenous infection than those using no contraception (not significant), whereas those using condoms were less likely to have an infection (p=0.04) and no evidence of confounding with age was found in the association between contraception and endogenous infections.53
4.22 PERSONAL AND MENSTRUAL HYGIENE AND REPRODUCTIVE TRACT INFECTIONS
Riyami AL et al. examined the effect of personal hygiene among menstruating Omani women and reported that low personal hygiene was positively associated with presence of at least one RTI.28
Singh S et al. reported from a community-based, cross-sectional study among in-migrant, ever-married women in a rural slum of Dehradun, that RTI symptoms i.e. vaginal discharge, itching, boils, pain abdomen, pain during sexual intercourse, backache, lymph node enlargement were strongly associated (p<0.001) with menstrual hygiene practices of re-using cloth.76
5. METHODOLOGY
STUDY DESIGN : Community based,Descriptive, Cross-sectional study
STUDY AREA : Karanai Puducheri Panchayat village, Kancheepuram District
STUDY PERIOD : March 2011 to November 2011
STUDY POPULATION : Married women in the age group 18 to 45 years
Inclusion Criteria : Married women in the age group 18 to 45 years in Karanai Puducheri village
Exclusion criteria:
women with diagnosed gynaecological problems (like carcinoma cervix, fibroid uterus, uterine prolapse)
women who were not willing to participate in the study.
women who could not be contacted after 3 visits
SAMPLE SIZE
The sample size was calculated based on the Prevalence of RTI among married women in 15 to 45 years in Veerapandi Panchayat Union, Salem District, Tamil Nadu (Indian Journal of Comm Med, 32(2), April 2007)77 which was 44.6%, with an allowable error of 10% using the formula,
N = Z21- /2 [P (1-P)]
____________ d2
N : Required sample size
Confidence level : 95%
Z1- /2at 0.05 : 1.96
P: Prevalence : 44.6%
1-P : 55.4%
d : tolerable level of error (as % of P) : 10% of 44.6% = 4.46 N= (1.96 X 1.96 X 44.6 X 55.4 ) / (4.46 X 4.46) = 9492 / 19.9 = 476.9
Assuming 10% non response, the sample size was calculated as 525.
SAMPLING METHOD
Kancheepuram District is divided into 13 Blocks which consist of 648 Village Panchayats. Among the 13 blocks, Kattankolathur block was chosen by lottery method. Kattankolathur block consists of 39 Village Panchayats. Among these 39 Village Panchayats, Karanai Puducheri Village Panchayat was chosen by lottery method.
Karanai Puducheri Village Panchayat has a population of 10415, with 5826 males and 4589 females. This population is spread over 5 villages which constitute Karanai Puducheri Village Panchayat- Anna Nagar, Karanai Kattur, Karanai Puducheri, Karanai Puducheri colony and Vinayagapuram.
DATA COLLECTION METHODS
Permission to conduct the study was obtained from The Director, Institute of Community Medicine, The Dean, Madras Medical College and the Institutional Ethics Committee.
A semi-structured questionnaire modified from the Ever-married women’s questionnaire in DLHS 3 was devised in English and translated into Tamil and then back translated into English for accuracy and consistency. The Tamil questionnaire was pretested for clarity and reliability among a few women similar to the study population and standardized. This questionnaire was administered to the respondents and their responses were recorded. On an average 10 to 15 women were visited per day. The participants who could not be interviewed on the scheduled day were given 2 more visits and interviewed.
The questionnaire was divided into 5 sections:
1. Socio demographic characteristics
This section comprised details of age of the participant and their husbands, their marital status, age at marriage, duration since marriage, educational status of participant and husband, work status of participant, type of family, total number of members in the family and total monthly income of the family.
2. Perceived symptoms of RTI
3. Obstetric history
This section contained questions about number of conceptions, age at birth of first child and last child and a detailed obstetric history with outcome (live birth/ still birth/ abortion).
4. Contraceptive practices
This section contained questions on permanent sterilisation, practice of modern spacing methods in the past and present.
5. Personal and menstrual hygiene practices
In this section women were enquired about personal hygiene, type of napkins used during menstrual periods, reuse of napkins, washing and drying practices of napkins to be reused.
The participants were given health education and those who reported symptoms of RTI were referred to the nearest Government health centre.
DIAGNOSIS OF RTI
Abnormal vaginal discharge was defined as vaginal discharge accompanied by itching, irritation around the vaginal area, abnormal colour, texture, bad odour, severe lower abdominal pain, fever or by any other problem.78
DATA ENTRY AND ANALYSIS
6. RESULTS
The required sample size for this study was 525. The number of women interviewed was 520 which was 99% of the requisite number.
The mean age of the participants was 29.5 years with a standard deviation of 6.9 years. The mean age of their husbands was 35.1 years with a standard deviation of 8.1 years. The mean age at marriage of participants was 21 years with standard deviation 3.5 years.
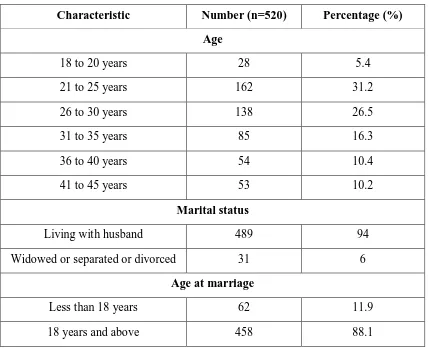
[image:56.595.85.513.349.697.2]6.1 BACKGROUND CHARACTERISTICS:
Table 5: Background characteristics
Characteristic Number (n=520) Percentage (%)
Age
18 to 20 years 28 5.4
21 to 25 years 162 31.2
26 to 30 years 138 26.5
31 to 35 years 85 16.3
36 to 40 years 54 10.4
41 to 45 years 53 10.2
Marital status
Living with husband 489 94
Widowed or separated or divorced 31 6
Age at marriage
Less than 18 years 62 11.9
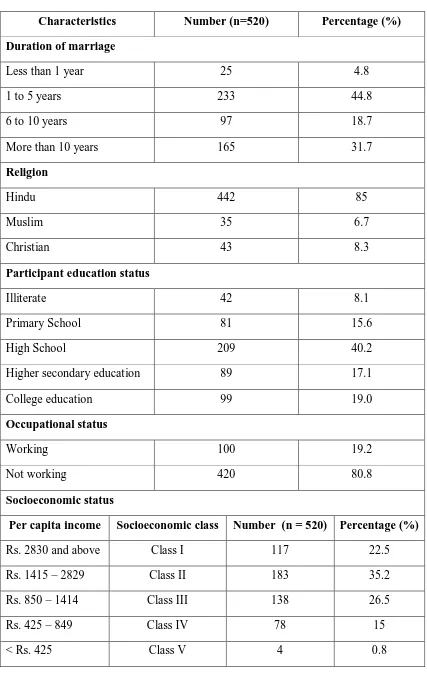
Table 5: Background characteristics (Continued):
Characteristics Number (n=520) Percentage (%)
Duration of marriage
Less than 1 year 25 4.8
1 to 5 years 233 44.8
6 to 10 years 97 18.7
More than 10 years 165 31.7
Religion
Hindu 442 85
Muslim 35 6.7
Christian 43 8.3
Participant education status
Illiterate 42 8.1
Primary School 81 15.6
High School 209 40.2
Higher secondary education 89 17.1
College education 99 19.0
Occupational status
Working 100 19.2
Not working 420 80.8
Socioeconomic status
Per capita income Socioeconomic class Number (n = 520) Percentage (%)
Rs. 2830 and above Class I 117 22.5
Rs. 1415 – 2829 Class II 183 35.2
Rs. 850 – 1414 Class III 138 26.5
Rs. 425 – 849 Class IV 78 15
In total 520 women participated in the study. Majority of the participants were in the age group 21-25 years (31.2%) followed by 26-30 years age group (26.5%). 94% of the participant women were living with their husbands. The remaining 6% were widowed/ separated or divorced. 11.9% of the participants were married before the age of 18 years, majority of them (88.1%) were married after 18 years.
Duration of marriage: 44.8% of the women (233) were married for 1 to 5 years. 4.8% (25) were married for less than a year, 18.7% (97) were married for 6 to 10 years and 31.7% of the women (165) were married for more than 10 years.
Among the participants 85% were Hindus, 8.3% were Christians and 6.7% were Muslims. Educational status of the participants was as follows: 8.1% were illiterate, 15.6% had completed 1 to 5 years (Primary School) of formal education, 40.2% had completed 6 to 10 years (High School) of education, 17.1% had completed higher secondary education and 19% had completed college education.
Occupational status: 19.2% (100) of the women were working and 80.8% (420) were not working.
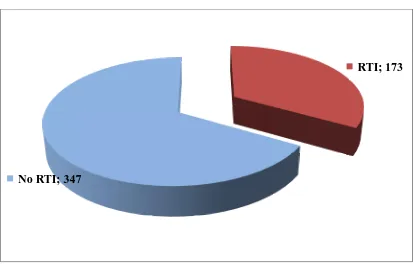
6.2 PREVALENCE OF PERCEIVED SYMPTOMS OF RTI: (N=520)
Figure 3: Prevalence of perceived symptoms of RTI/STI:
173 women (33.3%) reported symptoms of RTI/STI.
Figure 4: Prevalence of various symptoms of RTI/STI among the study population:
RTI; 173
No RTI; 347
7 26
140
173 8
18 19 0
28 13 4
123
0 50 100 150 200 3 symptoms
[image:59.595.91.504.498.761.2]6.3 OBSTETRIC HISTORY
Table 6: Distribution of study population based on number of conceptions and age at first conception:
Number of conceptions Number (n=520) Percentage (%)
None 52 10
2 conceptions 352 67.7
More than 2 conceptions 116 22.3
Age at first conception Number (n=468) Percentage (%)
< 18 years 24 5.1
18 years and above 444 94.9
Among the 520 participants, 52 women (10%) had never conceived. Of the remaining 468 women, 352 women (67.7%) have had 2 conceptions and 116 women have had > 2 conceptions.
Among the 468 women who had ever conceived, 24 women (5.1%) have had their first conception at < 18 years of age, while the remaining 444 (94.9%) women were aged 18 years and above at their first conception.
Figure 5: Distribution of the study population based on number and type of live births: (N=468)
6 153 300 397 257 167 65 58 1 0 50 100 150 200 250 300 350 400 450
Live births Vaginal births Caesarean births
Figure 5 shows that among the 468 women who had ever conceived, 397 (84.8%) had 2 live births and 65 (13.9%) had > 2 live births. 6 women (1.3%) never had live births. 257 women (54.9%) have had 2 vaginal births and 58 women (12.4%) have had > 2 vaginal births. 153 women (32.7%) had never had any vaginal births. 300 women (64.1%) had never had caesarean births, 167 women (35.7%) have had 2 caesarean births and only 1(0.2%) woman had > 2 caesarean births.
Figure 6: Distribution of study population based on experience of abortions:
Table 7: Distribution of study population based on type of abortions:
Type of abortions Number (N=468) Percentage (%)
No abortions 371 79.3
Spontaneous abortions 72 15.4
Induced abortions 23 4.9
Both 2 0.4
As shown by the Figure 6 and Table 7, among the 468 women who had ever conceived, 371 women (79.3%) have not had any abortions, while the other 97 women (20.7%) have undergone abortions. 72 women (15.4%) have experienced spontaneous abortions, 23 women (4.9%) have undergone induced abortions and 2 women (0.4%) have undergone both.
No abortions; 371 Had
6.4 CONTRACEPTIVE PRACTICES
Table 8: Distribution of study population based on history of Permanent sterilisation
Permanent sterilisation Number (n=520) Percentage (%)
No permanent sterilisation 304 58.5
Had permanent sterilisation 216 41.5
Among the study participants, 216 women (41.5%) have undergone permanent sterilisation, while the remaining 304 women (58.5%) have not undergone sterilisation.
Table 9: Ever usage and current usage of modern spacing methods
Modern spacing methods ever used (before 1 year)
Number (n=520)
Percentage (%)
None 369 71.0
Oral contraceptive pills 10 1.9
Copper T 121 23.3
Condoms 20 3.8
Modern spacing methods currently using
Number (n=520)
Percentage (%)
None 404 77.7
Oral contraceptive pills 11 2.1
Copper T 44 8.5
Ever usage of modern spacing methods (before 1 year): 369 women (71%) never used any of the modern spacing methods in the past. 121 women (23.3%) have used Copper T, 10 women (1.9%) have used Oral Contraceptive pills (OCPs) and the husbands of 20 women (3.8%) have used condoms.
[image:64.595.91.506.313.529.2]Current usage of contraceptives: 404 women (77.7%) are not using any of the modern spacing methods now. 11 women (2.1%) are using OCPs, 44 women (8.5%) are using Copper T and the husbands of 61 women (11.7%) use Condoms.
Figure 7: Current contraceptive status of the study population
Figure 7 summarises the current contraceptive status of the study population. 188 women (36.2%) are not using any contraceptive method. 216 women (41.5%) have undergone permanent sterilisation. 11 women (2.1%) are using OCPs, 44 women (8.5%) are using Copper T and the husbands of 61 women (11.7%) use Condoms.
None, 188
OCPs, 11 Copper
T, 44 Condom, 61
Permanent sterilization,
6.5 PERSONAL AND MENSTRUAL HYGIENE PRACTICES
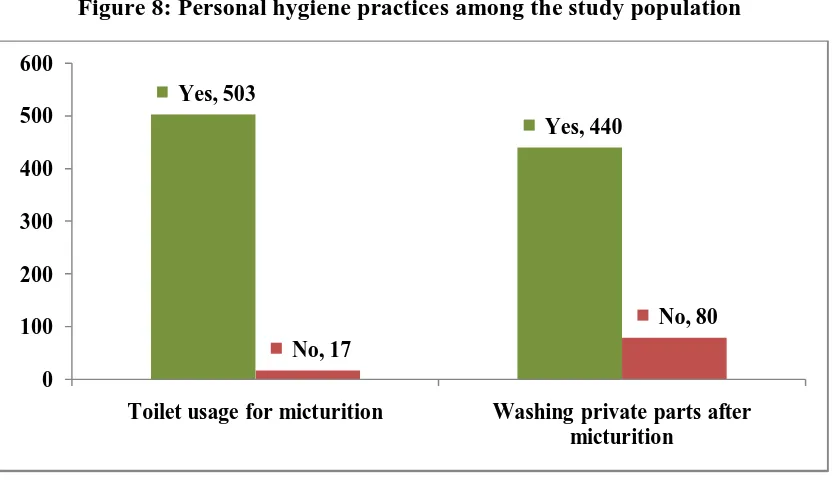
Figure 8: Personal hygiene practices among the study population
[image:65.595.93.509.112.352.2]As shown in the above Figure 8, 503 women (96.7%) use toilets for urination purposes, while 17 women (3.3%) do not use toilets for urination purposes. 440 women (84.6%) have the habit of washing their private parts after urination, whereas 80 women (15.4%) do not wash their private parts after urination.
Table 10: Type of napkin used during menstrual periods
Type of napkin used Number (n=520) Percentage (%)
Cloth or homemade pad 136 26.2
Commercial sanitary napkin 333 64.0
Both 51 9.8
Among the study participants, 136 (26.2%) women use cloth or homemade pads during their menstrual periods, 333 (64%) women use commercial sanitary napkins, and 51 (9.8%) women use both.
Yes, 503
Yes, 440
No, 17
No, 80 0
100 200 300 400 500 600
Table 11: Reuse habits of study participants:
Reuse of napkin Number (n=187) Percentage (%)
Yes 177 94.7
No 10 5.3
Washing before reuse Number (n=177)
Soap and water only 128 72.3
Soap and water with disinfectant 49 27.7
Drying before reuse Number (n=177)
Sunlight 70 39.5
Shade 107 60.5
Among the 187 (136+51) who use cloth or homemade napkins or both cloth/ homemade napkins and commercial sanitary napkins, 177 (94.7%) reuse the napkins after washing, while 10 (5.3%) women do not reuse napkins.
6.6 STATISTICAL ANALYSIS OF VARIABLES
Table 12: Participant age group and RTI
Age group RTI No RTI Total
18-20 years 16 (57.1%) 12 (42.9%) 28
21-25 years 49 (30.2%) 113 (69.8%) 162
26-30 years 43 (31.2%) 95 (68.8%) 138
31-35 years 27 (31.8%) 58 (68.2%) 85
36-40 years 26 (48.1%) 28 (51.9%) 54
41-45 years 12 (22.6%) 41 (77.4%) 53
Total 173 347 520
2
(0.05)(5) = 16.299 (P=0.006) (SS)
Among the study participants, the prevalence of RTI was found to be more common among women belonging to 18 to 20 years age group, followed by those in 36 to 40 years age group. The difference was found to be significant.
Table 13: Marital Status and RTI:
Marital status RTI No RTI Total
Living with husband 160 (32.7%) 329 (67.3%) 489
Widowed/ separated/ divorced
13 (41.9%) 18 (58.1%) 31
Total 173 347 520
2
(0.05)(1) = 1.115 (P=0.291) (NS)
Table 14: Age at marriage and RTI
Age group RTI No RTI Total
Less than 18 years 20 (32.3%) 42 (67.7%) 62 18 and > 18 years 153 (33.4%) 305 (66.6%) 458
Total 173 347 520
2
(0.05)(1) = 0.032 (P=0.857) (NS)
No significant association was observed between age at marriage and RTI.
Table 15: Duration of marriage and RTI Duration of
marriage
RTI No RTI Total
Less than 1 year 14 (56%) 11 (44%) 25
1 to 5 years 68 (29.2%) 165 (70.8%) 233
6 to 10 years 37 (38.1%) 60 (61.9%) 97
More than 10 years 54 (32.7%) 111 (67.3%) 165
Total 173 347 520
2
(0.05)(3) = 8.360 (P=0.035) (SS)
[image:68.595.88.507.585.727.2]This table shows that the prevalence of RTI was found to be highest among women married for less than 1 year (56%) and this association was found to be significant.
Table 16: Religion and RTI
Religion RTI No RTI Total
Hindu 148 (33.5%) 294 (66.5%) 442
Muslim 13 (37.1%) 22 (62.9%) 35
Christian 12 (27.9%) 31 (72.1%) 43
Total 173 347 520
2
Table 16 shows that the prevalence of RTI to be highest among Muslims (37.1%), followed by Hindus (33.5%) and Christians (27.9%). But the difference was not significant.
Table 17: Participant education status and RTI
Education status RTI No RTI Total
Illiterate 15 (35.7%) 27 (64.3%) 42
Primary school 26 (32.1%) 55 (67.9%) 81
High school 75 (35.9%) 134 (64.1%) 209
Higher Secondary School
30 (33.7%) 59 (66.3%) 89
College 27 (27.3%) 72 (72.7%) 99
Total 173 347 520
2
(0.05)(4) = 2.418 (P=0.659) (NS)
There was no significant association between the educational status of participants and RTI.
Table 18: Occupational status of participants and RTI
Occupational status RTI No RTI Total
Working 29 (29%) 71 (71%) 100
Not working 144 (34.3%) 276 (65.7%) 420
Total 173 347 520
2
(0.05)(1) = 1.016 (P=0.3134) (NS)
Table 19: Type of family and RTI
Type of family RTI No RTI Total
Nuclear family 119 (33.8%) 233 (66.2%) 352
Joint/Extended nuclear family
54 (32.1%) 114 (67.9%) 168
Total 173 347 520
2
(0.05)(1) = 0.142 (P=0.706) (NS)
There was no statistically significant association between the type of family and RTI.
Table 20: Socioeconomic status (SES) and RTI
Per capita income SES RTI No RTI Total
Rs. 2830 and above Class I 41 (35%) 76 (65%) 117
Rs. 1415 – 2829 Class II 54 (29.5%) 129 (70.5%) 183
Rs. 850 – 1414 Class III 48 (34.8%) 90 (65.2%) 138
Rs. 425 – 849 Class IV 27 (34.6%) 51 (65.4%) 78
< Rs. 425 Class V 3 (75%) 1 (25%) 4
Total 173 347 520
Fisher’s Exact test, P = 0.3303 (NS)
[image:70.595.88.513.373.630.2]Table 21: Number of conceptions and RTI
Number of conceptions RTI No RTI Total
None 22 (42.3%) 30 (57.7%) 52
2 and < 2 conceptions 114 (32.4%) 238 (67.6%) 352 > 2 conceptions 37 (31.9%) 79 (68.1%) 116
Total 173 347 520
2
(0.05)(2) = 2.136 (P=0.344) (NS)
[image:71.595.91.508.333.451.2]No significant association was observed between the number of conceptions and the prevalence of RTI.
Table 22: Age at first conception and RTI
Age at first conception RTI No RTI Total
< 18 years 7 (29.2%) 17 (70.8%) 24 18 years and above 144 (32.4%) 300 (67.6%) 444
Total 151 317 468
2
(0.05)(1) = 0.111 (P=0.739) (NS)
Age at first conception (< 18 years Vs 18 years) was not significantly associated with prevalence of RTI.
Table 23: Number of live births and RTI Number of live
births
RTI No RTI Total
No live births 3 (50%) 3 (50%) 6 1 or 2 live births 125 (31.5%) 272 (68.5%) 397
> 2 live births 23 (35.4%) 42 (64.6%) 65
Total 151 317 468
Fisher’s Exact test, P = 0.4742 (NS)
[image:71.595.90.506.545.713.2]