SEARCH FOR NDE METHODS TO CHARACTERIZE THERMAL HISTORY AND MECHANICAL PROPERTIES OF Al-Li ALLOYS
INTRODUCTION
D. J. Bracci, P. Garikepati, D. C. Jiles, and O. Buck Center for NDE and Ames Laboratory, USDOE
Iowa State University Ames, IA 50011
Aluminum-lithium alloys have attracted the interest of the aerospace industry for some time now since the use of such alloys would reduce the weight of an airframe by roughly ten percent. The production of these alloys, however, requires precise thermal and/or thermomechanical treatments to insure required material properties, such as the yield strength and ductility. On-line monitoring of the state of the material thus seems to be desirable for quality control of these materials. This paper presents results of an investigation of fieldable NDE methods capable of providing information on the state of the material. Eddy current measurements were found to be particularly sensitive to Li in solid solution. Furthermore, it appears that hardness measurements are sensitive to the volume fractions, and probably the morphology, of the various precipitates formed. Thf' results obtai.ned
so far (see also [1]) as well as by other authors on different aluminum alloys [2-4], this work will continue with additional results to be reported in future publications.
EXPERIMENTAL PROCEDURES
Materials used in this investigation were binary Al-2.2 wt% Li and Al 2090, the latter kindly provided by Alcoa [5], with a composition of about 2.7% Cu, 2.2% Li, 0.12% Zr, 0.08% Si, and 0.12% Fe (all in
strain-to-failure, Ef' were determined by means of an Instron screw-driven deformation machine at a strain rate of about 1.6 x 10⁻⁴ sec-I. RESULTS
Examples of variation in hardness (DPH) and the reactive component of the eddy current response (~X) as a function of aging time and depen-dence are shown in Fig. 1 for the water quenched binary. Similar results have been obtained for both alloys, water quenched and air cooled.
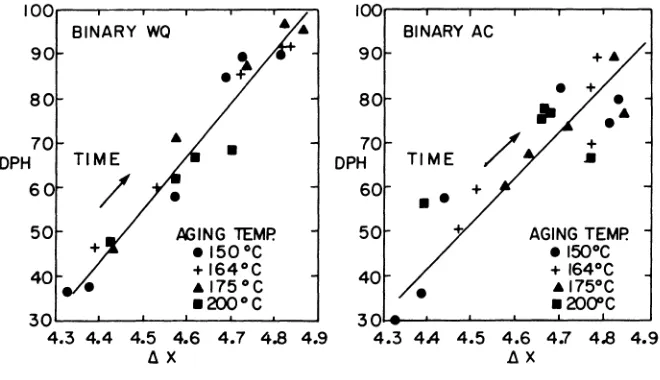
In the following, these results are summarized eliminating the time as a parameter. For example, the results shown in Fig. 1 have been replotted in Fig. 2, demonstrating that DPH is proportional to ~X over the range of aging times and temperatures chosen. Note that the aging time increases from the lower left hand to the upper right hand corner. A similar result has been obtained for the air cooled binary, as shown
in Fig. 2 although certain deviations from the proportionality can be noticed which are probably due to some nucleation of precipitates during air cool.
:I: a. o en
f3
zo cr: <t :I:
- +
AGING TEMP. • 150°C + 164°C • 175°C • 200°C
10 15 20 25 30 35
TIME. hours
5 10
AGING TEMP. • 150·C
+ 164°C A 175°C • 200°C
15 20 25 30 35
TIME. hours
Fig. 1. Hardness (DPH) and reactive component of EC (~X) changes with aging time and temperature for a water quenched binary.
100 100
BINARY
wa
BINARY AC90 90
+.
80 80
•
+•
••
70
•
70 +DPH
DPH
TIME•
60 60
••
+50 AGING TEMP. 50 AGING TEMP.
.150°C • 150°C
+164°C 40 + 164°C
.175°C • 175°C
• 2OQ°C
•
.20O"C30 30
4.3 4.4 4.5 4.6 4.7 4.8 4.9 4.3 4A 4.5 4.6 4.7 4.8 4.9
dX
1J.X [image:2.482.77.416.249.369.2] [image:2.482.84.414.435.625.2]Results obtained on water quenched Al 2090 are shown in Fig. 3. For the lower aging temperatures, DPH and ~x are, again, proportional. However, there is a dramatic deviation from proportionality after aging at longer times at 200°C. At present, we believe that proportionality i~ maintained during 6' and TI' precipitation. The strong deviations from proportionality may be caused by the formation of the T2' phase
[6]. TEM will be applied to clarify the situation. Figure 4 shows the observed correlations between the reactive component, ~X, and the
measured DC resistivity for the water quenched binary. As will be discussed later, the DC resistivity is strongly affected by lithium in solid solution. Therefore, the figure clearly demonstrates the capability of the eddy
current measurements to determine lithium in solid solution. In contrast to the DPH and ~X measurements, the elastic modulus and acoustic attenuation measurement~ both performed at 10MHz, did not show any significant changes during aging.
6X
DPH
Fig.
4.9
4.8
4.7
4.6
4.5
4.4
180.---,---:.----.---,----.----. ... "" ----,... AI 2090
wa
.
...1:1
"-2 "
160
140
120
100
•
80
3.8 3.9 4.0 4.1
6X 3. DPH as a function of
AGING TEMP. • 150°C + 164°C A 175°C • 200°C
4.4
~X for Al 2090.
""A
£+~:
BINARYwa
AGING TEMP.• 150°C
+')..
+164°C•
A175°C•
• 200°C4.3L-______ - L ________ L-______ -L ____ ~~
7.5 8.0 8.5 9.0 9.5
DC RESISTIVITY (fLflcm) CIt Li CONC IN 5.5.
[image:3.482.130.342.202.383.2] [image:3.482.102.372.415.621.2]30
25
",;
~ 20
Vi
III
"
15 .... iii "tJ Qj:;: 10
5
•
0
30 40 50
I
•
60 70 Hardness, DPH
•
.... ++
Aging Temperature
• 150 C
+ 164 C ... 175 C • 200 C
80 90 100
Fig. 5. Yield stress versus DPH for the water quenched binary.
75
70
65
60
III
~ 55
Vi 50
III
~ 45 iii
~ 40
"
35:;:
30
25
20
15 70
Aging Temperature
• 150 C
+ 164 C ... 175 C
• 200 C
90 110
•
•
•
•
130 150 170 Hardness, DPH
Fig. 6. Yield stress versus DPH for water quenched Al 2090.
The observed yield stress, 00' as a function of DPH for the water
quenched binary is given in Fig. 5 (the air cooled binary yields a similar result) and for water quenched Al 2090 in Fig. 6. In both cases, 00
increases continuously with hardness.
[image:4.482.115.380.26.206.2] [image:4.482.114.374.264.443.2]1.8
Aging Temperature
1.5
•
150 C+ 164 C
...
175 C..
1.2•
200 C...
.2
°0
...
•
"0 0.9
I:
•
"e
Vi 0.6 +
...
0.3
•
A
0.0
30 40 50 60 70 80 90 100
Hardness, DPH
Fig. 7. Strain-to-failure versus DPH for the water quenched binary.
0.5
•
Aging Temperature•
150 C0.4 + 164 C
A 175 C
"
•
200 C...
::l °0 0.3
...
"0
•
I:
0.2
.~
Vi
•
+
0.1
•
0.0
70 90 110 130 150 170
Hardness, DPH
Fig. 8. Strain-to-failure versus DPH for water quenched Al 2090.
DISCUSSION AND CONCLUSIONS
A binary Al-2.2 wt% Li and a commercial Al 2090 alloy have been quenched from the solid solution phase at two different rates. Subsequent aging between 150 and 200°C with aging times ranging from 0 to 33h were chosen to obtain alloys of different microstructures and mechanical properties. Nondestructive measurements of the eddy current response (at 5kHz), the DC resistivity, the microhardness, as well as the elastic modulus and attenuation (both at 10MHz) have been performed on the different microstructures. It was found that the reactive component of EC and
[image:5.482.107.374.27.207.2] [image:5.482.108.370.266.441.2]independent of heat treatment. These latter results are different from those noted by Rosen et al. [7] for Al 2094. In their studies [7] the alloy was pre-aged, however, which leads to stable precipitate phases which was not the case in the present studies.
The yield stress of the alloys increases by about a factor of two and the strain-to-failure of the binary alloy decreases by about a factor of five. In general, the strain-to-failure of Al 2090 also decreases; however, we have not observed a systematic trend in these results as yet.
First correlations between the mechanical properties, 00 and Ef, and the various properties, characterized nondestructively, have been obtained. In general, 00 increases and Ef decreases with DPH (with certain exemptions, mentioned above). DPH and ~X are proportional.
The only exception to this rule, within the range of measurements performed so far, is probably due to T2' phase formation [6]. This observation indicates the need for a transmission electron microscopy investigation to determine the volume fraction and morphology of the precipitates present in the alloys.
A preliminary data analysis of the reactive component of EC, ~X, and the DC resistivity was performed, based on data partially shown in Fig. 4. The figure demonstrates that ~x is linearly dependent on DC resistivity. In general, the DC resistivity is strongly determined by individual point defects or, in the present case, by Li in solid solution. As clusters form, the DC resistivity per atom drops off very rapidly [8]. ~x is therefore determined by the Li in solid solution, rather than by the precipitates. Thus, the ~x is due to the disappearance of Li from solid solution. Its emergence in the increase form of precipi-tates has little effect on ~x. Therefore, one can assume that this is a "diffusion-limited" precipitation process [9] in which case the precipitates are homogeneously distributed throughout the lattice, as indicated in Fig. 9. The bulk concentration decreases with time as [9]
0)
where c is the average concentration at time t, Co the initial concen-tration, and T is a "relaxation time", determined by the diffusion coeffi-cient. Ham [9] found that for short times n=1.5 and for long times n=l.O. Converting the concentration
c
to ~x values, Eq. (1) yields(2)
where ~~ is the reactive component of EC when basically all Li has precipitated out, ~Xo is the initial reactive component with all Li in solid solution and ~X the reactive component at time t. Figure lOa shows such a plot for n=1.5, demonstrating the expected short time diffusion behavior. Figure lab, on the other hand, shows a plot for n=l.O, demon-strating the expected long time diffusion behavior. As also can be
seen from Fig. lab, the slope at longer aging times is clearly temperature dependent. This temperature dependence is caused by the relaxation
time T in Eq. (1), given by
c
Co~----~~~----~---~---r--\ liME. \ ' •
---
.... ,", .... --1---
I~ .... , , I I' ,. ... - -r-,I.,.
-j'_ " , I-1'-- -1'--... \, I I ... ~ - ... ... \1', ",,-I".
,\.'"
,.
'I ... \' .... I,PREC. PREC.
Fig. 9. Model for diffusion-limited precipitation.
BINARY WQ e150"C
+ 164°C 0.7 AGING TEMP.
• 175°C • 1500C
\ 0.5 + 164°C
\'
0 • 175°C0 \~, x x
~ ~ 0.3 ~,
'
<1<1 0.3I I I
,
.,
....,
.
8 88 8
'"
.... xx~~ 0.2
'"
.... ... <1<1 0.2"
'
... .....:
" 't ...
"
.=
... ... "
.... ....
,
....e
0.1
,
.... .... .... '+ 0.1" ,
0.07•
0.05 0.05
40 80 120 160 200 5 10 15 20 25 30 35
TIME (h11.5 TIME (hI
Fig. 10. Relative change of ~x as a function of aging time and temperature for the water quenched binary; a) for n=1.5; b) for n=l.O.
where E is the activation energy of migration for Li in AI. Thus it appears as if the reactive component of EC provides basic information on the presence of Li in solid solution. Further evaluation is in progress, including modeling of DPH which is mainly caused by the precipitates
themselves.
In conclusion, it appears that DC resistivity and/or the reactive component ~x of the eddy current measurements, as well as the micro-hardness are prime indicators for the mechanical properties of Al-Li alloys, as noted before [3,4]. Both DC resistivity as well as ~x provide information on Li in solid solutions. The contributions to the hardness are mainly due to precipitate formation. The individual phases will have to be determined by transmission electron microscopy so that estimates of their contributions to DPH can be obtained.
ACKNOWLEDGEMENT
The work was sponsored by the Center and was performed at the Ames Laboratory. for the U.S. Department of Energy by Iowa No. W-7405-ENG-82.
[image:7.482.125.354.31.129.2] [image:7.482.57.419.172.350.2]REFERENCES
1. D. J. Bracci, P. Garikepati, D. C. Jiles, and O. Buck, in Review of Progress in Quantitative NDE, 6B, D. O. Thompson and D. E. Chimenti, Eds., Plenum Press, NY, 1987, p. 1395.
2. W. D. Rummel, Materials Evaluation 24, 322 (1966).
3. L. J. Swartzendruber, W. J. Boettinger, L. K. Ives, S. R. Coriell, and R. Mehrabian, in "Nondestructive Evaluation: Microstructural Characterization and Reliability Strategies", O. Buck and S. M. Wolf, Eds., The Metallurgical Society of AlME, 1981, p. 253. 4. R. A. Chihoski, in "Nondestructive Methods for Material Property
Determination", C. O. Ruud and R. E. Green, Eds., Plenum Press, NY, 1984, p. 81.
5. The authors appreciate several pieces of Al 2090, received from Alcoa.
6. R. J. Rioja and E. A. Ludwiczak, in "Aluminum-Lithium Alloys III", C. Baker, P. J. Gregson, S. J. Harris, and C. J. Peel, Eds., The Institute of Metals, London, 1986, p. 471.
7. M. Rosen, L. Ives, S. Ridder, F. Biancaniello, and R. Mehrabian, Mat. Science and Engr. 74, 1 (1985).
8. A. C. Damask and G. J. Dienes, "Point Defects in Metals", Gordon and Breach, NY, 1963.