promoting access to White Rose research papers
White Rose Research Online
Universities of Leeds, Sheffield and York
http://eprints.whiterose.ac.uk/
This is an author produced version of a paper published in Journal of Health
Economics.
White Rose Research Online URL for this paper: http://eprints.whiterose.ac.uk/3579/
Published paper
Dolan, P. and Edlin, R. (2002) Is it really possible to build a bridge between
cost-benefit analysis and cost-effectiveness analysis? Journal of Health Economics, 21 (5). pp. 827-43.
Is it really possible to build a bridge between cost-benefit analysis
and cost-effectiveness analysis?
1Paul Dolana, b, cand Richard Edlina, *
a
Sheffield Health Economics Group, School of Health and Related Research, University of
Sheffield, Sheffield, UK
b
Department of Economics, University of Sheffield, Sheffield, UK
c
Health Economics Research Programme, University of Oslo, Oslo, Norway
Abstract
Economists have attempted to build a welfare economic bridge between cost-benefit analysis
and cost effectiveness analysis in order to give the latter a basis in welfare economics. This
paper develops these attempts and finds that highly unrealistic assumptions are necessary to
facilitate the constant willingness-to-pay per unit of health outcome such a bridge requires.
We develop an impossibility theorem that shows it is not possible to link CBA and CEA if:
(i) the axioms of expected utility theory hold; (ii) the QALY model is valid in a welfare
economic sense; and (iii) illness affects the ability to enjoy consumption. We conclude that,
within a welfare economic framework, it would be unwise to rely on a link between CBA and
CEA in economic evaluations.
JEL Classification: I10
1We wish to thank Martin Jones, Jan Abel Olsen and Mark Sculpher for their detailed comments on earlier
drafts of this paper. We are also grateful for comments received from participants at various seminars,
Keywords: economic evaluation, cost-benefit analysis, cost-effectiveness analysis,
willingness-to-pay, quality-adjusted life-years
*
1. Introduction
Welfare economists typically advocate the use of cost-benefit analysis (CBA) when evaluating
public sector resource allocation decisions (see Mishan 1988). Under CBA, the costs and
benefits from any given programme are expressed in monetary units, and the sign of the net
benefit across all affected individuals is used as the decision criterion. CBA aims to maximise
aggregate welfare and is the only methodology that, at least in theory, provides information on
the absolute benefit of different programmes. However, potential ethical and methodological
problems in attaching a monetary value to non-market benefits (see Hausman 1993) have led to
the development of alternative methods for measuring benefits. In health economics, this has led
to the development of cost-effectiveness analysis (CEA), in which health-related benefits are
expressed in a single measure, such as gains in life years or quality-adjusted life-years
(QALYs).2 Indeed, CEA has been used in most economic evaluations of health care
interventions (see Elixhauseret al1993).
In essence, CEA considers only health-related measures of benefit to be relevant. This has led
Kenkel (1997) to conclude, “when we accept the methodology of welfare economics, we should
use cost-benefit analysis, not cost-effectiveness analysis”. Nonetheless, this has not prevented
economists from attempting to link CEA with CBA. Such a link would be appealing to many
economists since the results from the ever-increasing number of CEAs could be interpreted
within a standard welfare economic framework. Johannesson (1995) has argued that where CEA
counts all societal costs and uses a cost-per-QALY threshold, it can be interpreted as a CBA
since the threshold value can be used to translate the non-monetary benefits in CEA into
2
monetary terms for CBA. To do this, there must be a constant willingness to pay (WTP) per
QALY. There have been two main attempts to set out the conditions under which this will hold.
First, Johannesson and Meltzer (1998) have claimed that an article by Pratt and Zeckhauser
(1996, hereafter PZ) “provides the strongest theoretical evidence to date” for the use of a
constant WTP-per-QALY figure. PZ’s model uses a veil of ignorance based on perfectly
comparable utility functions. Here, linking CBA and CEA requires that the benefit (in utility
terms) from a given health improvement is constant across all individuals, so that maximising
expected benefits behind the veil necessarily maximises aggregate health. Section 2 considers
the prospects for a CBA-CEA link within PZ’s framework and shows that highly restrictive and
counter-intuitive assumptions are required. Second, Bleichrodt and Quiggin (1999) show the
conditions under which life-cycle preferences are consistent with QALY maximisation. By
arguing that individuals will consume the same amount in each period, they set out the
conditions under which all individuals weight their own QALYs equally, and so form a basis for
CEA in welfare theoretic terms. Section 3 discusses the results obtained by Bleichrodt and
Quiggin (1999) and argues that they do not in fact link the analyses, even when the conditions
they set down are met.
In Section 4, we propose a general impossibility theorem for links between CBA and CEA and
argue that, as things stand, the link must be based on unrealistic assumptions which either
arbitrarily set key variables to be constant (as in Johannesson and Meltzer 1998), or which rely
on special cases that do not exist (as in Bleichrodt and Quiggin 1999). The impossibility
theorem shows the conditions thatanylink between CBA and CEA must satisfy under expected
utility theory, and sets out the extremely stringent restrictions on the utility function that are
required. Whilst we acknowledge a potential benefit of linking CBA and CEA, we conclude that
2. Finding a societal WTP per QALY
PZ consider how to determine the socially optimal level of expenditure on reducing mortality
risks, and argue that each individual’s WTP for his risk reduction must be corrected for his own
risk and his own wealth. To do this, PZ place individuals behind a veil of ignorance that
prevents them from perceiving their risk type and wealth level. Behind the veil, individuals are
assumed to have an equal subjective probability of being each person, and so, when they
maximise expected utility (EU), they also maximise the average cardinal utility of those in
society behind the veil.3 PZ show that EU maximisation requires that the cost of a marginal
decrease in risk is set equal to societal WTP for that same marginal decrease. The first order
conditions imply that each marginal risk reduction is valued equally where wealth is constant
across society. Where wealth differs, the optimal reduction varies negatively with wealth, such
that society places a greater weight on risk reductions for wealthy individuals. Behind PZ’s veil,
society makes decisions by maximising the average of cardinal utilities so, if good health
improves the ability to enjoy wealth, then individuals with higher wealth gain a greater increase
in utility from a given health improvement. Other factors being equal, this suggests that society
is willing to pay a higher amount to save the life of a wealthy individual.
Of course, this violates the assumption of a constant WTP-per-QALY, as programmes focusing
on the rich generate greater benefits to society for an equal number of QALYs than those
focused on the poor. Johannesson and Meltzer seek to avoid this by assuming that incomes are
constant across society. As income is the only non-health factor in PZ’s model, there can be no
interaction between health and non-health factors, and so the model is consistent with the health
status of any link between CBA and CEA in doubt. We begin by developing PZ’s model to
incorporate life expectancy and quality of life. Following PZ, we assume that there are no
interpersonal aspects to utility, so that social WTP corresponds to individual WTP because
individuals are unconcerned with the health of others.4 We then find the conditions under which
a constant societal WTP-per-QALY holds when the unrealistic constant income assumption is
relaxed.
2.1 Incorporating QALYs into the model
In the PZ model, the individual simply lives (for an unspecified period of time in an unspecified
health state) or dies. Therefore, Johannesson and Meltzer’s claim of a ‘link’ between CBA and
CEA depends not only on the assumption that QALYs are a valid cardinal utility function for
individuals (as argued by Johannesson 1995) but also on the implications of incorporating life
expectancy and health status into PZ’s model. In extending PZ’s model to include length and
quality of life, we allow health status to vary by the risk and income typex, where each type
occurs with relative frequencyf(x). For typex, the type-dependent probability of illness is
p(x,e(x)), wheree(x) denotes the present value of the expenditures on each individual of that
type. As in PZ’s paper, our model deals only withpreventativeinterventions as the individual
remains in whichever health state they emerge in once the veil of ignorance is lifted.5
3
This veil of ignorance is analogous to Harsanyi (1955) and is rather ‘thinner’ than that in Rawls (1971).
4Alternative specifications are possible but require certain restrictive assumptions (see Jones-Lee (1992) for an
exposition of this).
5For curative treatments, we must consider the differential impact of treatment on individuals, and so the
As is common in the health state valuation literature, health status is bounded above by 1 (i.e.
full health) and unbounded below, with death denoted byh= 0. Further, let utility be a function
of income and health, u(w,h), where marginal utility increases in health, so that:
. < all for <
0 ( ,0) ( ,1) h0 h1
w h w u w h w u
An individual of typexis assumed to live forL(x) years for certain, at which time they receive
utility (which is a function of wealth at the time of death) from the legacy they leave their
dependants. Each individual is assumed to discount future periods exponentially with a rate of
time preference equal to the interest rate6and contributes towards societal expenditures with a
constant amount e over their remaining lifespan7, where this equals:
y y rL r x y f x e x fe = ( ) ( ) 1 ( )1-e- ( )
The expected utility of an individual behind a veil of ignorance is the sum of each type’s EU
weighted by the relative frequency, which acts as the subjective probability of being each type
behind the veil. Optimal expenditures on each type were found by solving the first order
conditions (see Appendix A for details) of this ex-ante expected utility.
y y rL r w EU x rL r e x e x p y f x h x h e x w u x hx - ( )
1 ) ( -1 )) ( , ( e -1 ) ( ) ( 1 )) ( , ) ( ( = ) ( 1 e -1 1 ) ( (1)
where u(w,h)=u(w,1)u(w,h) is the utility gain from a prevented illness.
6Whilst other discount functions (for instance, the hyperbolic one) may represent individual preferences more
accurately, we test for the possibility of CBA-CEA link under those conditions most favourable to CEA.
7The assumption that PZ used (that costs were borne equally by all) raises equity issues for those with a short life
The left hand side of (1) represents the marginal cost-per-QALY of treating typex, since the
numerator is the marginal cost of abating a statistical illness whilst the denominator is the
number of QALYs gained when a statistical illness is abated. The numerator on the right hand
side is the utility value of a prevented illness per unit of health improvement, while the
denominator is the marginal utility of income of an additional unit of expenditure spread across
society. The right hand side of (1) is therefore society’s marginal WTP-per-QALY. Therefore,
EU maximisation requires that society equalise the marginal cost and marginal WTP-per-QALY
for each type.
2.1.1 The effect of including life expectancy
In (1), differences in life expectancy between individuals affect the marginal cost-per-QALY but
not the marginal WTP-per-QALY, other things being equal. Whilst those with longer life
expectancies attract greater expenditure, this occurs in a way that is generally consistent with
QALY maximisation. Whilst our model uses deterministic life expectancies, we do not consider
it worthwhile to add a stochastic element, since this would add nothing to our critique. We note,
however, that when people die (as opposed to occupying a health state equivalent to death, which
is the case we consider), average cardinal utility falls directly, through their death, and indirectly,
through the subsequent need to increase the contribution level for those who remain. This
second factor could see treatments that prevent death or treat those with a long life expectancy
receiving priority beyond that suggested by their QALY gains alone.
2.1.2 The effect of including health status
Health status enters (1) within a utility function that increases in income and decreases in health
which health enters the utility function (see Johannesson 1995). Here, the utility from a given
health improvement must not be dependent on the type of person benefiting. Therefore, the ratio
of utility gain and health must be constant, with the utility function consequently satisfying:
,0) ( ) 1 ( ) , ( )
(h u w h h u w
The first order conditions for EU maximisation become:
y y rL r w EU x rL r e x e x p y f e x w u x hx - ( )
1 ) ( -1 )) ( , ( e -1 ) ( ) 0 , ) ( ( = ) ( 1 e -1 1 ) (
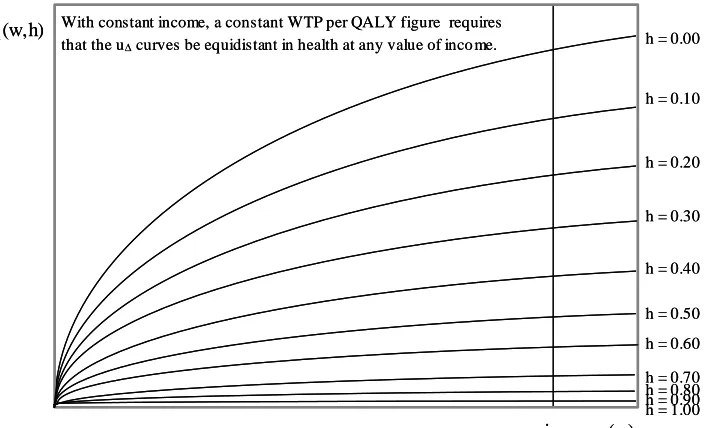
Where income is constant, the societal WTP-per-QALY becomes constant with respect to health
status. A representation of the type of u consistent with this assumption is displayed in Figure
1. Note that we require the ‘constant incomes’ assumption since a cursory examination of the
diagram reveals that the utility gain from a prevented illness is a function of income. Contrast
this with Figure 2, which shows a u function where the WTP-per-QALY assumption is
violated. At any positive level of income, the lines (though equidistant in health status) exhibit
decreasing marginal gains in utility.
2.2 Relaxing the constant income assumption
Johannesson and Meltzer’s claims of a link between CBA and CEA are tenuous, as they rest on a
special case of economic unreality where income is constant across society. For a more robust
link between CBA and CEA, the utility function must place a constant value on a given health
improvement that varies in neither health nor income. The utility gain of a prevented illness
must therefore satisfy:
,0) 0 ( ) 1 ( ) , ( ) ,
This implies that utility function at a point in time must linearly separable into health and
non-health factors with a constant trade-off between wealth and non-health that is common to all. The
intertemporal utility function of a person with wealthw, healthh, and deterministic life
expectancyLequals:
hw u L h w
U rL x
r r
) ( -1 ( ,0)+ 1-e
= ) , ,
(
whereis the common trade-off between the health and non-health portions of utility.8
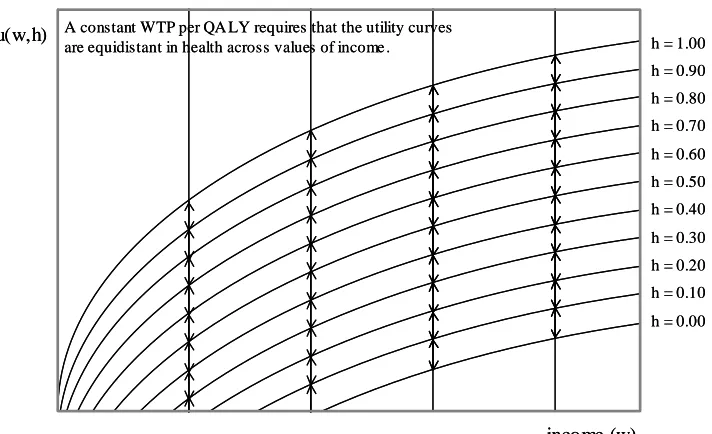
The significance of this restriction is clear in the contrast between Figures 3 and 4. Figure 3
shows a utility function in a world where CBA and CEA are linked when incomes are constant.
At any level of income, the value an individual places on preventing an illness is a function of
the severity of that illness alone. Figure 4 shows a utility function where the link between CBA
and CEA remains but where incomes may vary. Here, the utility that an individual places on a
prevented illness holdsacrosswealth levels.
Therefore, two additional constraints must be satisfied in addition to the conditions required by
PZ’s model. First, the utility value of a prevented illness must depend only on the size of the
health improvement, and second, the ability of an individual to enjoy wealth cannot be affected
by illness. The latter of these conditions is highly counter-intuitive and is not supported by
empirical evidence (see Evans and Viscusi 1993 and Sloanet al1998), making any link between
CBA and CEA of the sort Johannesson and Meltzer propose untenable.
8Note that any positive linear transformation of the utility function must affect the entire functionU(w,h,L)and not
In addition, Johannesson and Meltzer’s argument requires that all rational economic agents share
the same views about society from behind an appropriately specified veil of ignorance. The
operational device of the veil of ignorance has been the subject of much controversy in the
philosophical literature (see Barry 1989) and so, even if the restrictions outlined here were to be
established empirically, the framework may still be a difficult one to accept. Whilst we must use
a cardinal utility function in any link between CBA and CEA, we do not have to use a veil of
ignorance to achieve it. We now turn our attention to the arguments put forward by Bleichrodt
and Quiggin (1999).
3. Life cycle preferences over consumption and health
Bleichrodt and Quiggin consider the conditions under which utility maximisation over
consumption is consistent with QALY maximisation. Their analysis produces conditions that
they suggest link CBA and CEA and which appears to require neither a “constant incomes”
assumption nor linear separability under EU. Their analysis notes that any function consistent
with QALY maximisation must be a positive linear transformation of the health status enjoyed in
each period:
T
t
t t t t T
T h v c h w c
c h
c U
1 1
1, ),...,( , )) ( ) ( )
(( ,
where ct is consumption in periodtand ht is the health state in periodt.
If, as Bleichrodt and Quiggin suggest, the utility of any state equivalent to death is the same then
we can ignore wt(ct). For the utility function to be a valid positive linear transformation of the
number of QALYs it becomes sufficient to ensure v(ct) is constant. Bleichrodt and Quiggin
facilitate this by arguing that consumption is smoothed to ensure the same consumption in each
T
t t
T v c h
h h c U
1 1,..., ) (ˆ)
; ˆ
( (2)
where cˆ is smoothed consumption and ht is the health state in periodt
However, very few people are in a position to enjoy such constant consumption. For example,
imperfect credit markets prevent consumption smoothing, uncertain life expectancy makes
calculation of optimal consumption impossible, and differences in expectations over lifestyle in
different life years makes constant consumption unlikely.9 If the constant consumption
assumption is relaxed, then Bleichrodt and Quiggin acknowledge that individual
WTP-per-QALY depends on the level of consumption.
Moreover, there are unresolved issues even where consumption smoothing is possible. Firstly,
all individuals must agree on a WTP-per-QALY figure to be used in CEA. This is highly
unlikely since, as Bleichrodt and Quiggin themselves acknowledge, each individual’s
WTP-per-QALY will increase in (smoothed) consumption. Therefore, we still require that discounted
lifetime income be the same across individuals. Secondly, since health and consumption may be
correlated, an individual who is ill may have lower income over his remaining lifespan, which
may reduce his per-period consumption. In this case, health improvements improve utility from
increased smoothed consumption in addition to its direct effect. Since both are included in
individual WTP, we would expect that those interventions that improve earning capacity would
be valued more highly under CBA than those that do not.
Finally, Bleichrodt and Quiggin’s model only considers income and health. If a welfare
economic bridge is to be built between CBA and CEA thenallother possible arguments in the
9
utility function must be considered. Since there are non-wealth and non-health factors (e.g.
autonomy, self-respect, and social standing) that might affect the coefficient on the health-utility
index in (2), the following section develops a slightly more general view accommodating such
factors, and shows that a link between CBA and CEA is highly unlikely within an EU
framework.
4. The (im)possibility of a link between CBA and CEA
Following Bleichrodt and Quiggin, we impose the restrictions ofmarginalityandsymmetryon
preferences. Marginality allows us to represent preferences as the sum of a series of
period-specific utility functions, whilst symmetry guarantees that the same utility function is used in all
periods. Where EU maximisation also holds, we can represent an individual’s utility function as:
T
t
t t t T
T
T h h U c h
c c U
1 1
1
1... , ... , ... ) ( , , )
( N N N
wherectis consumption, Nt is a vector of other non-health factors andhtis health status
at timet
We begin by assuming that health does not affect the non-health variables (candN) directly, so
that WTP can be found by summing the WTP for each period’s improvement in health. We take
any link between CBA and CEA to be satisfied where individual WTP is a linear function of the
number of individual QALYs gained and where the marginal WTP-per-QALY figure is common
Theorem 1:
A utility function, U(c1...cT,N1...NT,h1...hT), linking CBA and CEA cannot embody all of the
following:
1. The axioms of EU theory.
2. Marginality.
3. Symmetry.
4. Weak concavity in consumption ( t
c U
,
2 2
t
c U
exist with 0
t
c
U and 0
2 2
t
c U ).
5. The property that health improves the ability to enjoy (h2Uc 0 ).
Under a CBA-CEA link, Conditions 1 through 4 require that the marginal utility of consumption
does not change in response to a change in health status, so that Condition 5 cannot also hold (for
a proof of this, see Appendix B). Where Condition 5 holds then the WTP for a given health
improvement will necessarily be greater for those in poor health where utility is less sensitive to
consumption. For a QALY to have a monetary value that holds for all individuals across society,
we must restrict the utility function so that consumption and health are linearly separable in the
utility function. In addition utility must be a linear function of these factors, since any
non-linearity will cause the WTP-per-QALY to vary according to the initial levels of health and
consumption.
However, Conditions 1 through 4 are not yet sufficient for a link between CEA and CBA, since
factors other than health and consumption may affect the utility function even where health and
consumption enter separately and linearly. Specifically, these factors may be either valued for
their own sake or may affect the marginal utility of consumption. Only where both these
Theorem 2:
To accommodate a link between CBA and CEA, a utility function,U(c1...cT,N1...NT,h1...hT)
satisfying Conditions 1 through 4 must also assume one of the following restrictions:
6(i) Health and consumption are be the only factors in the utility function (U ti 0
N ).
6(ii) Any non-health, non-consumption factor(s) must remain fixed in all circumstances
(N constant).
Condition 6(i) would explicitly remove any factors other than health and consumption, whilst
6(ii) requires that any such factors must be related to the identity of the individual. In different
ways, both these assumptions prevent factors such as autonomy and self-respect from entering
meaningfully into an individual’s WTP. In both cases, the per-period utility function can be
isolated down to a positive linear transformation of the function U(c,N,h)ch, whereλis
the common trade-off between consumption and health and the coefficients of this
transformation may include person-specific factorsN(under 6(ii)).
For Condition 5 to be accommodated within a link between CEA and CBA, we must relax or
replace at least one of Conditions 1-4. However, under EU (Condition 1), both marginality
(Condition 2) and symmetry (Condition 3) are required for utility to be the sum of identical
per-period utility functions. Condition 4 guarantees a “nice” WTP function, and requires only that
the utility function be (strictly) monotonic and concave in consumption. Using a utility function
that is constant or decreasing over some levels of consumption (and which is almost certainly
non-concave) will also disqualify almost all standard utility functions and so is difficult to
justify.
This leaves only Condition 1, which places the link between CBA and CEA within an EU
it is unlikely that their analysis could lead to a valid link between CBA and CEA that avoided the
problems outlined in Section 4. Generalisations of EU use utility functions in which health can
interact with other factors, causing asymmetric weightings and confounding any link between
CBA and CEA. Since the normative appeal of CBA may be questionable under theories outside
generalised EU, the prospects of a suitable link seem rather dim.
5. Conclusion
CEA is increasingly being used to evaluate resource allocation decisions in health care. Most
forms of CEA involve the maximisation of an effect variable for a given budget, which typically
involves funding all programmes with a cost-per-unit-outcome below a certain threshold level.
Economists have considered the extent to which this form of analysis is compatible with a
standard welfare economic framework and, in particular, with CBA. Under welfarist models,
individuals are the best judges of their own welfare and individual WTP is taken to be the
appropriate monetary valuation of any benefit. CBA sums WTP over all those affected and
compares this figure to net costs, implementing only those programmes that increase net benefit
(defined in monetary terms). CBA is seen as the welfarist ‘gold standard’, whilst CEA can be
argued to lack a theoretical foundation (see Johannesson and Karlsson, 1997).
Some economists have attempted to find conditions under which CBA and CEA produce
identical results. Here, a constant cost-per-QALY value must be used (Johannesson, 1995). But
this is problematic because the use of one societal WTP-per-QALY figure means that differences
in individual valuations of a QALY have to be ignored. Simply overriding individual
preferences will do this, but this does not sit easily with the welfarist tradition. Alternatively,
conditions can be imposed on individual preferences and this is the approach favoured by many
We have considered two attempts to link CBA and CEA. The first, by Johannesson and Meltzer
(1998), requires that incomes be held constant across individuals for WTP to be proportional to
the QALY gain. In relaxing this assumption, we find that health must be additively separable to
consumption in the utility function, since a relationship between health and income would
influence the ability of an individual to enjoy consumption. However, this ‘link’ does not build a
suitable bridge between CBA and CEA in the strict welfarist sense since individual judgements
(about the trade-offs between health and income) are overruled in formulating a societal CBA.
The second attempt to link CBA and CEA, by Bleichrodt and Quiggin (1999), differs in that
individual WTP figures are used. Whilst they find conditions under which individuals would
choose to maximise QALYs under a given cost-per-QALY threshold, this threshold will differ
across individuals and, without a common threshold, their analysis is not consistent with a single
implementation of CEA and so no substantive link exists here either.
We have developed an impossibility theorem that shows that it is not possible to link CBA and
CEA if: (i) the axioms of EU theory hold; (ii) the QALY model is valid in a welfare economic
sense; and (iii) illness hinders the ability to enjoy consumption. Since (iii) is intuitive and (ii) is
essential for CEA, the relaxation of (i) is the only real avenue open for a meaningful welfare
economic link between CBA and CEA (at least where costs are assessed from a societal
perspective).
In showing that there is currently no meaningful link between CBA and CEA, we have also
shown that CEA is not currently justifiable on strictly welfarist grounds. Instead, CEA would
seem to be justifiable only on non-welfarist grounds where the output of health care is judged
according to its contribution to health itself, rather than according to the extent to which it
justification for this focus on people’sobjective needsrather than on theirsubjective demands
owes much to Sen’s (1980) concept of ‘basic capabilities’. Culyer (1989) draws heavily on Sen
when he argues that health is a crucial characteristic that is important for people’s capability to
‘flourish’ as human beings.
It appears to us that CBA and CEA have such fundamentally different ethical underpinnings, that
it would seem futile to further attempt to reconcile them within the welfare economic paradigm.
Rather than attempting to find a bridge that is able to reconcile the central conflict between
utility and health maximisation, attention should instead be focused on the debate about the
appropriateness of CBA vis-à-vis CEA. One way forward might be to consider the extent to
which people prefer health care to be distributed according to the principle ‘to each according to
need’ rather than ‘to each according to willingness (and ability) to pay’ i.e. the extent to which,
as citizens, they might be willing to override their preferences as consumers. Whatever the
details, future research on the relative merits of CBA and CEA must also consider the relative
merits of welfarist and non-welfarist philosophies in the context of allocation decisions in health
APPENDIX A – The Calculation of EU in the updated PZ model
Each individual receives utility from both consumption and the legacy left to her descendants,
both of which are discounted exponentially at the prevailing interest rate. Intertemporal utility
for an individual with certain incomew, healthh, and life expectancyLtherefore equals:
1 e
( , ) e ( ,0) ,0)d ( e )d , ( e ) , ,( 1 1
0 w u h w u t w u t h w u L h w
U r rL r rL
L rt L
rt
As the probability of an illness occurring for an individual of type x is p(x, e(x)), EU is:
1 e
( ( )) )) ( , ( )) ( , 1 , ( )) ( , 1 , ( )) ( , ( -1 )) ( ), ( , ( )) ( , ( )) ( ), ( , ( ) (1 u w,h x
x e x p x L w U x L w U x e x p x L x h w U x e x p x L x h w EU x rL r
where u(w,h)=u(w,1)u(w,h)
Given constant contribution towards risk-reducing expenditures, type-dependent EU becomes:
1 e
( ( ) , ( )) )) ( , ( )) ( , 1 , e -) ( ( )) ( ), ( , ) ((w x e h x L x U w x L x p x e x 1 ( ) u w x e h x
EU r rLx
EU behind the veil of ignorance is
x x rL r x x h e x w u x e x p x f x L e x w U x fEU ( ) ( ( ) ,1, ( )) ( ) ( , ( ))1 1 e ( ) ( ( ) , ( ))
where
y y rL r x y f x e x f
e = ( ) ( ) 1 ( )1-e- ( ) .
Therefore, the first order conditions for the EU maximising type-dependent expenditure:
y y rL r w EU x rL r e x e x p e e e w w EU x rL r e x e x p y f x f x h e x w u x f x h e x w u x f x ) ( -1 ) ( -1 )) ( , ( ) ( -1 )) ( , ( e -1 ) ( ) ( )) ( , ) ( ( e -1 ) ( )) ( , ) ( ( e -1 ) ( 0 ) (
y y rL r w EU x rL r e x e x p y f x h e x w ux - ( )
1 ) ( -1 )) ( , ( e -1 ) ( )) ( , ) ( ( = e -1 1 ) (
To aid interpretation, this is divided by the benefits from a successful cure, (1 -h(x)). Therefore:
y y rL r w EU x rL r e x e x p y f x h x h e x w u x hx - ( )
1 ) ( -1 )) ( , ( e -1 ) ( ) ( 1 )) ( , ) ( ( = ) ( 1 e -1 1 ) (
APPENDIX B – Proof of Theorems
Theorem 1
Conditions (1)-(3) allow us to represent utility as the sum of identical per-period utility functions
(as required by the QALY model). This also allows us to find WTP by summing period-specific
WTP figure across periods. For a link between CBA and CEA, we must have a constant
WTP-per-QALY. We proceed by showing that this is impossible under all of Conditions (1)-(5).
LetU(c,N,h)be the per-period utility function. Condition (4) guarantees that this function is
one-to-one in consumption (holdinghandNconstant) and guarantees the existence of a
consumption-specific inverse that returns the consumption required to achieve a specific level of
utility. For such a C(u,N,h), we know that Cu 0 and
0 2 2 u C .
Consider two periods, 0 and 1, in which health differs. WTP is given by the function:
This function must satisfy g(c0,N0,h0,N1,h1)(h1 h0) for some common if
individual WTP is to be consistent with an implementation of CEA. For the WTP for marginal
changes inh0(holdingh1constant) to be invariant under changes in consumption then:
0 ) , , ( ) , ), , , ( ( ) , , , , ( 0 0 0 0 0 2 2 1 1 0 0 0 2 0 0 1 1 0 0 0 2 h c h c U u h h c U C h c h h c
g N N N N N
Here, either the utility function is additively separable into portions that consider health and
consumption (Case I) and/or utility enters linearly into the compensation function (Case II).
Case I
Here 2 ( 0, 0,0) 0 0 0
h c h c U N
and the utility function is of the form
) ( )
, ,
( (1 )
) (
1
2
1 N
N h N c N h W
c
U V V
for some positive functionsV1(N),V2(N). The theorem is established for this case because (5)
cannot be accommodated within this function, which uses (1)-(4).
For marginal WTP inh1(holdingh0constant) to be invariant to changes inN1, we also require:
, , , ) ( (
, , ), , ) 0, ( ) ( 1 1 1 0 0 0 2 1 1 1 0 0 0 2 h h h c U C h h h c g i i 1 i 1 N N N N N N
So thatV1(N)=V2(N),
) ( ) ( ) , ,
( (1 )
1 N
N h N c h W
c
U V ,
And ( 0, 0, 0, 1, 1) 0 1 (( ))( 0 0) 2( 1)( ( 1) ( 0))
0 2
1
2 N N N
N
N h h c h NN c h V W W
c
g VV
We proceed with 2 0
2
u
C so that C(u,N,h)uuY(N,h)Z(N,h) for some and
) , ( h
Y N >0. For marginal WTP for changes inh1to be invariant to changes inN1, we require:
, , , ) ( (
, , ), , ) 0, ( ) ( 1 1 1 0 0 0 2 1 1 1 0 0 0 2 h h h c U C h h h c g i i 1 i 1 N N N N N N
So that C(u,N1,h1)uuY1(h1)uY2(N1)Z1(h1)Z2(N1).
The analogous restriction forh1vs.c0 is:
0 ) , , ( ) , ), , , ( ( ) , , , , ( 0 0 0 0 1 1 1 0 0 0 2 1 0 1 1 0 0 0 2 c h c U h u h h c U C h c h h c
g N N N N N
And since Uc 0, ( , , )
( )
( ) ( ) 1 2 1 1 1 2 11 N N
N h u Y Z h Z
u
C .
Again, since changes inh1cannot affect marginal WTP for changes inh1, we have.
0 ˆ ) , ), , , ( ( ) , , , , ( 2 1 1 1 0 0 0 2 2 1 1 1 0 0 0 2 h h h c U C h h h c
g N N N N
So that C(u,N1,h1)u
Y2(N1)
Z2(N1)h1Finally, since c0 C(U(c0,N0,h0),N0,h0).
2 0
2 0 00 0 0
0 U(c , ,h ) Y ( ) Z ( ) h
c N N N
and 0 2 0 0
) ( 1 0
0
0, , ) ( )
(
0
2 c Z h
h c
U N Y N N
Under a CBA-CEA link, the marginal utility of income is unaffected by the health level, so that
(5) cannot hold alongside (1)-(4).
We can see that the utility function above is trivially different to that required for a CEA-CBA
link since we require:
1 0
1 1 0 0
0, , , , )
(c h h h h
g N N (1)
In Theorem 1, Conditions (1)-(4) provide terms in all five variables. For Case I above we have:
)) ( ) ( )( ( ) ( ) , , , ,
( 0 0 0 1 1 0 1 (( )) 0 0 2 1 1 0
0 2
1
2 N N N
N
N h h c h NN c h V W W
c
g VV (2)
While for Case II:
(( )) 0 2 0 0
1 1 2 0 1 1 0 0
0, , , , ) ( ) ( )
(
0 2
1
2 c Z h
h Z c h h c
g N N N YY NN N (3)
where the functions differ in each case.
In both cases the non-health, non-consumption factors,N, confound any CEA-CBA link since
they may have a direct affect on utility (throughW(N)and Z2(N)), and can also affect the
marginal utility of consumption (throughV2(N) and Y2(N)).
CEA and CBA are linked only where both these possibilities are precluded. To see this, let us
substitute (1) into (2). Solving this, we find that we require bothV2(N1)V2(N0) and
) ( )
(N1 W N0
W (sinceV2(N) > 0). Likewise, substituting (1) into (3), we find that we require
) ( )
( 1 2 0 2 N Y N
Y and Z2(N1)Z2(N0). Where these restrictions are not met then for some
values of the non-health, non-consumption factors then either the marginal utility of
consumption changes or a non-health factor must be compensated for directly (that is N0,N1:
) ( )
( 1 2 0 2 N Y N
Y or Z2(N1)Z2(N0)).
To accommodate these restrictions, we require either that the functions are constant and/or that
theNvalues are constant. In Case I, where V2(Ni)k and W(Ni)l we have:
l h c h
c
) ( ) ( ) ( ) , , ( 0 1 0 0 1 0 1 0 0 h h l l k h c h c h h c g
While for Case II, Y2(Ni) 2 > 0 and Z(Ni)n we have:
2
2( )
) ,
( 0 0
1 0
0
n
h c h
c
U
and ) ( ) , , ( 0 1 0 0 1 0 1 0 0 h h h n c h n c h h c g
In both cases non-health, non-consumption factors are indistinguishable from a linear
transformation of the utility function. WhereV2,W,Y2, andZ2are constant across all values ofN
non-health, non-consumption factors have no meaning and can be said not to exist. WhereNis
constant across all possible outcomes then only those non-health, non-consumption factors that
are specific to a person can be said to exist, and even here they cannot be said to affect WTP in
References
Barry, B.M., 1989. A treatise on social justice, vol I: Theories of justice. California series on
social choice and political economy, vol. 16. Harvester Wheatshaft, London.
Bleichrodt, H., Quiggin, J., 1999. Life-cycle preferences over consumption and health: when is
cost-effectiveness analysis equivalent to cost–benefit analysis? Journal of Health Economics 18,
681--708.
Bleichrodt, H., Wakker, P., Johannesson, M., 1997. Characterizing QALYs by Risk Neutrality.
Journal of Risk and Uncertainty 15, 107--114.
Brouwer, W.B.F., Koopmanschap, M.A., 2000, On the economic foundations of CEA: ladies and
gentlemen, take your positions please. Journal of Health Economics, 19, 439--460.
Culyer, A.J., 1989. The normative economics of health care finance and provision. Oxford
Review of Economic Policy 5, 34--58.
Elixhauser, A., Luce, B.R., Taylor, W.R., Reblando, J., 1993. Health care CBA/CEA: an update
on the growth and composition of the literature. Medical Care 31, JS1--11.
Evans, W.N., Viscusi, W.K., 1993. Income effects and the value of health. Journal of Human
Resources 28, 497--518.
Harsanyi, J., 1955. Cardinal welfare, individualistic ethics and interpersonal comparisons of
Hausman, J.A. (Ed.), 1993. Contingent valuation: a critical assessment. North-Holland,
Amsterdam.
Johannesson, M., 1995. The Relationship between Cost-Effectiveness Analysis and Cost-Benefit
Analysis. Social Science and Medicine 41, 483--489.
Johannesson, M., Karlsson, G., 1997. The friction cost method: a comment. Journal of Health
Economics 16, 249--256.
Johannesson, M., Meltzer, D., 1998. Some reflections on cost-effectiveness analysis. Health
Economics 7, 1--7.
Jones-Lee, M., 1992. Paternalistic altruism and the value of a statistical life. Economic Journal
102, 80--90.
Kenkel, D., 1997. On valuing morbidity, cost-effectiveness analysis, and being rude. Journal of
Health Economics 16, 749--757.
Mishan, E.J., 1988. Cost-benefit analysis: an informal introduction. 4thedn. Unwin Hyman,
London.
Pratt, J.W., Zeckhauser, R.J., 1996. Willingness to pay and the distribution of risk and wealth.
Quiggin, J., 1982. A Theory of Anticipated Utility. Journal of Economic Behavior and
Organisation 3, 323--343.
Rawls, J., 1971. A theory of justice. Clarendon Press, Oxford.
Sen, A., 1980. Equality of what?, in: McMurrin, S. (Ed), The Tanner lecture on human values.
Cambridge University Press.
Sloan, F.A., Viscusi, W.K., Chesson, H.W., Conover, C.J., Whetton-Goldstein, K., 1998.
Alternative approaches to valuing intangible health losses: the evidence for multiple sclerosis,
Journal of Health Economics 17, 475--497.
Williams, A., 1997. Intergenerational equity: an exploration of the ‘fair innings’ argument.
Figure 1: Constant WTP per QALY at any given income level
h = 0.00
h = 0.10
h = 0.20
h = 0.30
h = 0.40
h = 0.50
h = 0.60
h = 0.70
h = 0.80
h = 0.90
h = 1.00 inco me (w)
u(w,h) Wit h cons tant income, a const ant WTP p er QALY figure requires
that the ucurves b e equidistant in health at any value of in come. h = 0.00
h = 0.10
h = 0.20
h = 0.30
h = 0.40
h = 0.50
h = 0.60
h = 0.70
h = 0.80
h = 0.90
h = 1.00 inco me (w)
u(w,h) Wit h cons tant income, a const ant WTP p er QALY figure requires
that the ucurves b e equidistant in health at any value of in come. h = 0.00
h = 0.10
h = 0.20
h = 0.30
h = 0.40
h = 0.50
h = 0.60
h = 0.70
h = 0.80
h = 0.90
h = 1.00 inco me (w)
u(w,h) Wit h cons tant income, a const ant WTP p er QALY figure requires
that the ucurves b e equidistant in health at any value of in come. h = 0.00
h = 0.10
h = 0.20
h = 0.30
h = 0.40
h = 0.50
h = 0.60
h = 0.70
h = 0.80
h = 0.90
h = 1.00 inco me (w)
u(w,h) Wit h cons tant income, a const ant WTP p er QALY figure requires that the ucurves b e equidistant in health at any value of in come.
Figure 2: Variable WTP-per-QALY at any positive income level
h = 0.00
h = 0.10
h = 0.20
h = 0.30
h = 0.40
h = 0.50 h = 0.60
h = 0.70 h = 0.80 h = 0.90 h = 1.00 income (w) u(w,h) With constant income, a constant WTP per QALY figure requires
that the ucurves be equidistant in health at any value of inco me. h = 0.00
h = 0.10
h = 0.20
h = 0.30
h = 0.40
h = 0.50 h = 0.60
h = 0.70 h = 0.80 h = 0.90 h = 1.00 income (w) u(w,h) With constant income, a constant WTP per QALY figure requires
[image:29.595.72.424.376.590.2]Figure 3: Constant WTP per QALY at any given income level
h = 1.00
h = 0.90 h = 0.80
h = 0.70
h = 0.60
h = 0.50
h = 0.40 h = 0.30
h = 0.20
h = 0.10 h = 0.00
income (w) u(w,h) With constant income, a constant WTP per QALY figure requires
that the utility curves be equidistant in health at any value of inco me. h = 1.00 h = 0.90 h = 0.80
h = 0.70
h = 0.60
h = 0.50
h = 0.40 h = 0.30
h = 0.20
h = 0.10 h = 0.00
income (w) u(w,h) With constant income, a constant WTP per QALY figure requires
that the utility curves be equidistant in health at any value of inco me.
Figure 4: Constant WTP per QALY at all income levels.
h = 1.00 h = 0.90 h = 0.80 h = 0.70 h = 0.60 h = 0.50 h = 0.40 h = 0.30 h = 0.20 h = 0.10 h = 0.00
income (w) u(w,h) A constant WTP per QA LY requires that the utility curves
are equidistant in health across values of income . h = 1.00 h = 0.90 h = 0.80 h = 0.70 h = 0.60 h = 0.50 h = 0.40 h = 0.30 h = 0.20 h = 0.10 h = 0.00
income (w) u(w,h) A constant WTP per QA LY requires that the utility curves
[image:30.595.66.422.376.593.2]