promoting access to White Rose research papers
White Rose Research Online
[email protected]
Universities of Leeds, Sheffield and York
http://eprints.whiterose.ac.uk/
This is the published version of an article in
Geophysical Research Letters, 28
(10)
White Rose Research Online URL for this paper:
http://eprints.whiterose.ac.uk/id/eprint/77233
Published article:
Brooks, IM (2001)
Air-Sea Interaction and the Spatial Variability of the Surface
Evaporation Duct in a Coastal Environment.
Geophysical Research Letters, 28
(10). 2009 - 2012. ISSN 0094-8276
Air-Sea Interaction and Spatial Variability of the Surface
Evaporation Duct in a Coastal Environment
Ian M. Brooks
Scripps Institution of Oceanography, La Jolla, California.
Abstract
Aircraft observations are presented of the horizontal variability in the depth of the surface evaporation duct and the relationship with the mesoscale structure of air-sea interaction processes. The 2-dimensional fields of near-surface wind, stress, wind-stress curl, air and sea-surface temperature are measured directly for flow around a headland. The sea surface temperature field indicates cold upwelling driven by the wind-stress curl. Boundary-layer stability responds rapidly to the spatial changes in surface temperature. These changes result in modification of the evaporation duct, which decreases significantly in depth over the cooler upwelling water.
1.
Introduction
The refractivity of air for radio frequencies is highly sensitive to the temperature and moisture content; gradients in these quantities result in refraction of radio waves - bending of the ray path. A commonly used measure when considering radar propagation is the modified refractive index, defined as
M =
77.6(P+ 4810e)+-z-,
T
T
10-
6r
(1)where T is the air temperature in Kelvin, P is atmospheric pressure and e is water vapor pressure in millibars, z is
altitude and r the radius of the earth in meters (Bean and Dutton 1968). The modified refractive index is defined such that for constant M the curvature of the ray path is equal to that of the Earth's surface. Where dM/dz is negative the ray
path is bent back towards the surface, and radio waves become trapped between the region of negative gradient - the trapping layer - and either the level at which M exceeds the value at the top of the trapping layer or the surface, a phenomenon known as ducting.
Ducting conditions are ubiquitous over the oceans (Craig 1946; Emmons 1947; Babin 1996; Babin et al. 1997), associated with the large gradient in humidity in the lowest few meters above the surface; this is the so-called evaporation duct. Evaporation ducts are typically a few meters to a few tens of meters deep, but can vary greatly with location, season, and the time of day. Ducts may also be associated with gradients across the BL inversion.
The effects of radar ducting are important in a variety of applications. Ducting can greatly modify the effective range of radio communications and navigation radar used by
Copyright 2001 by the American Geophysical Union.
Paper number 2000GL012751. 0094-8276/0 112000GLO 12751$05.00
shipping, and can lead to highly erroneous conclusions if not accounted for properly in the interpretation of weather radar signals (Moszkowicz et al. 1994). They are of particular importance to naval operations: ducting can significantly enhance the range of radio communications and the detection of radar targets. Conversely, trapping of energy within the duct results in a corresponding decrease in energy on the other side of the trapping layer, resulting in poor radio communications and holes in the radar cover. An accurate assessment of the propagation environment allows these effects to be taken into account and resources to be deployed to best effect (Cook et al. 1994). In this context the surface evaporation duct is of particular interest since it will have a significant influence on the ability of radar to detect targets close to the surface.
In order to assess the propagation range accurately for a ship-mounted antenna, typically located 20-30 m above the surface, the depth of the evaporation duct must be determined to an accuracy of better than 2 m (Babin et al. 1997). While direct measurement of the refractivity of the larger part of the boundary layer and lower troposphere may be made using radiosondes, or by instrumented aircraft, it is rarely possible to make direct profile measurements within a few meters of the sea surface. Furthermore, the perturbation of the surface by wave motions, and turbulent fluctuations of a similar magnitude to the vertical changes of interest means that individual, instantaneous measurements are of little use for characterizing the evaporation duct structure. Averaging over periods of several tens of minutes may be required to smooth out turbulent variations on all contributing scales. The
40.5
40.0
I I I I I I I I I I I I I I I
~11,
',
~v~
\ \ \ 1 \ \
\ \ \ \ \
\ \
-124.6
Longitude
[image:2.618.320.540.529.731.2]-124.1
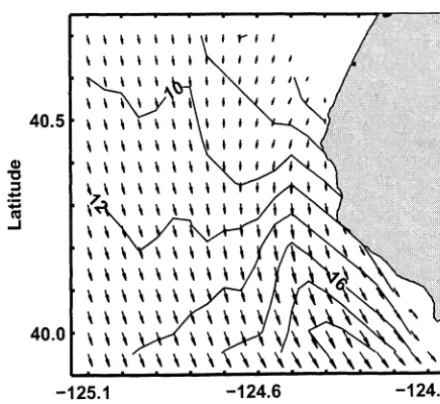
Figure 1. Mean wind speed (m s·1) and vector.
2010 BROOKS: AIR-SEA INTERACTION AND SURFACE EVAPORATION DUCTS
Q)
,
:I
-
~...J
40.5
~:
. '
.·7.-\ ' • ' I
40.0
[image:3.613.74.295.51.255.2] [image:3.613.327.545.532.737.2]Longitude
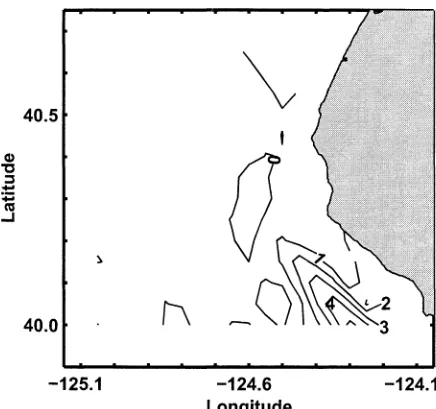
Figure 2. Surface wind stress (Pa) and vector.
difficulties associated with the direct measurement of the evaporation duct have necessitated the development of parameterizations for the local duct depth based on easily made point measurements of bulk quantities. A number of such parameterizations are reviewed by Babin et a!. (1997).
Over the open oceans BL conditions are relatively homogeneous. In order to characterize the propagation environment it is usually sufficient to make a single measurement of the refractivity structure; this may then be applied over a range of several hundred kilometers. The coastal environment, however, is inherently heterogeneous. The BL responds rapidly to the large contrasts in surface roughness, moisture, and thermal forcing between the land and sea. In the case of offshore flow the formation of an internal boundary layer is common; this grows rapidly close to shore, but in the stable case may continue to evolve and deepen for several hundred kilometers downwind before reaching equilibrium with the surface (Garrett, 1990). Such cases result in extensive regions over which the propagation conditions change continuously (Craig 1946; Emmons 1947; Brooks eta!. 1999; Atkinson and Li 2000). The case of coast parallel flow, although not subject to the extreme changes of surface conditions experienced by cross-coast flow, can present an equally variable environment. Where the boundary layer is shallow, coastal topography can act as a barrier imposing restrictions on the flow that result in modification of the boundary-layer structure for distances of up to 100 km or so offshore (Overland 1984).
The Coastal Waves '96 field program (CW96) was designed to examine the structure of the coastal boundary layer off Northern California and Oregon under summer conditions; an overview of the program is given in Rogers et a!, (1998). A key finding was the extent to which the flow becomes supercritical around each major headland along the coast (Haack et a!. 1999; Dorman et a!. 2000). In such cases an expansion fan forms downwind of the headland as the coastline bends away from the flow, and the layer accelerates and thins (Winant et a!. 1988). This results in a highly heterogeneous radio propagation environment due to the dramatic changes in height of the trapping layer at the inversion (Haack and Burk, 1999). The heterogeneity of the
wind field imposes a high degree of spatial variability on the surface forcing that drives upwelling in the ocean, and thus on the SST field (Enriquez and Friehe, 1995). This study examines the June 7 case from the CW96 experiment to determine the effect of the topographic forcing on the surface evaporation duct close to the coast.
2. Measurements
Airborne measurements were made by the NCAR C-130 Hercules. Temperature measurements were made by an unheated Rosemount platinum resistance thermometer. Humidity measurements derive from a Lyman-a absorption hygrometer calibrated continuously against a stable thermoelectric dewpoint hygrometer. The sea surface temperature (SST) was measured radiometrically by a Heimann infrared radiometer; a correction for the sky reflectance was applied. Turbulent winds were derived from pressure measurements around the radome. Aircraft motion was monitored by an inertial navigation unit and Global Positioning System, and removed from the measured aircraft-relative winds. Turbulence data were sampled at 25 Hz giving a spatial resolution of 4 mat an airspeed of 100m s·1•
This study uses measurements from flight legs at 30 m above the surface to map the 2-dimensional fields of near-surface boundary-layer properties and estimates of evaporation duct depth around Cape Mendocino, California. Series of sawtooth profiles along the same ground tracks mapped the vertical structure of the BL (not shown) and verify that the 30-m legs were well within the BL at all times.
3. Results
Measurements of both mean and turbulence quantities were averaged over 5km sections of the flight path - equivalent to the time averaging required for measurements at a fixed site. The averaging length was chosen to ensure that all scales contributing to the turbulence fluxes were included, while providing good spatial resolution. The averaged data were linearly interpolated onto a 0.1-by-0.1 degree grid to produce 2-dimensional fields.
Q)
,
:I
-~
...J 40.5
40.0
-125.1 -124.6
Longitude
-124.1
-125.1 -124.6
[image:4.612.72.292.58.264.2]Longitude
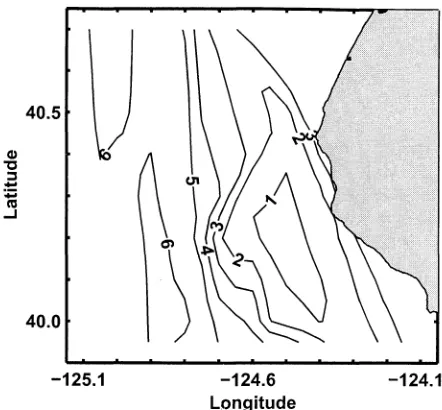
Figure 4. Sea surface temperature (°C).
-124.1
Figure 1 shows the mean wind at 30 m around Cape Mendocino. As the flow rounds the headland it accelerates from approximately 6 m s-1 to a maximum in excess of
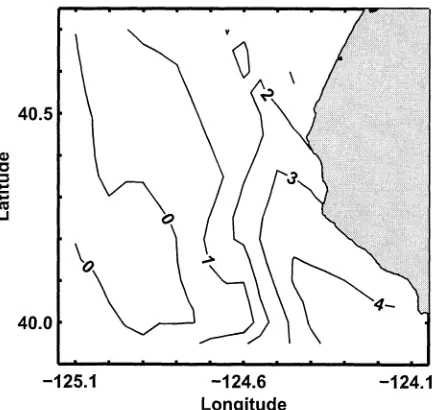
20 m s- . The associated wind stress field is shown in Figure 2; this increases from close to zero upwind of the Cape to a maximum of approximately 0.65 Pa. Note that the wind stress does not follow the changes in the wind field exactly since stability plays a significant role in determining the turbulent momentum flux. Wind stress is the major driving force for turbulent mixing in the upper-ocean. Ekman pumping drives upwelling of cold water along much of the West Coast of the US. In the lee of Cape Mendocino strong divergence in the surface wind and stress act both to increase the local Ekman pumping and to impose divergent flow in the ocean surface, resulting in increased cold upwelling. A measure of the strength of the divergence is given by the curl of the wind stress (Figure 3). Positive values of the curl indicate upwelling favorable conditions. The maximum values observed here are approximately 5xl0-5 m s-2, much larger
than the climatological mean but comparable with those found by Enriquez and Friehe (1995). Figure 4 shows the SST field; the correspondence in the spatial distribution of temperature and wind-stress curl is strong, with the coldest water located in the region of the largest curl. Figure 5 shows the air-sea temperature difference; this follows the spatial distribution of the SST field closely, suggesting that the BL air at 30m has only partially adjusted to the change in surface conditions.
The evaporation duct cannot be measured directly from the aircraft, but must be estimated from a bulk parameterization. Here the TOGA-COARE bulk flux algorithm (Fairall et a!. 1996) is used to derive profiles of the mean temperature and humidity between the surface and the aircraft altitude from the measured quantities. These profiles are then used to calculate the modified refractive index and establish the height of the duct (Brooks et a!. 1999). Figure 6 shows the distribution of evaporation duct height. Offshore it is near uniform and close to 7 m in depth. Approximately 20 km offshore the depth decreases dramatically, falling to less than 2 m within a distance of less than 10 Ian. The region within the expansion fan is again relatively uniform in depth, but very shallow, at less than 1 m.
The duct depth depends on the gradients of the near-surface profiles of temperature and humidity. The profile shapes are influenced by a range of complex interactions. In stable conditions mixing is driven only by the surface wind stress. A higher stress drives stronger mixing and tends to confine the strongest gradients to a shallower layer close to the surface, lowering the duct height. The stress depends both on the wind speed and on stability. Spatial variability in the wind speed here is determined largely by the interaction of the mesoscale flow with the coastal topography while the stability depends primarily on the air-sea temperature difference. A closely coupled system exists between the atmospheric and ocean boundary layers - increased wind stress drives stronger upwelling, lowering the SST; this increases stability and acts to lower the wind stress. Duct depth thus depends on a complex interplay between different forcing processes.
4. Discussion
Radar propagation conditions are routinely assessed from observations at a single location, and applied to a wide area. Over the open ocean the assumption of spatial homogeneity may provide an acceptable degree of accuracy. Coastal regions, however, can be spatially highly heterogeneous. This study demonstrates the spatial variability in the surface evaporation duct around Cape Mendocino, while Haack and Burk (1999) found abrupt changes in ducts associated with the BL inversion at the same location. In order to assess propagation conditions accurately it is essential to identify the conditions and environments for which spatial variability is significant. The region around a coastal headland, where the mean flow is constrained by the topography and interacts strongly with the ocean surface, is one such environment.
The form of the flow around the headland is a robust feature, observed at every major headland along the coast of northern California and Oregon during the CW96 field program (Dorman et a!. 2000), and reproduced by mesoscale modeling studies (Burk et a!. 1999). This suggests that similar regions of spatially variable surface evaporation ducts should be readily identifiable from numerical simulations.
Cl)
"0
:I
-
~ ...I-125.1 -124.6
Longitude
[image:4.612.328.544.530.735.2]2012 BROOKS: AIR-SEA INTERACTION AND SURFACE EVAPORATION DUCTS
40.5
)
40.0
-125.1 -124.6
Longitude
[image:5.613.66.287.58.263.2]-124.1
Figure 6. Depth of the evaporation duct (m).
One note of caution should be sounded with respect to these results. The evaporation duct depth cannot be measured directly over a wide area, but must be derived from a bulk parameterization. Such parameterizations assume that the boundary layer is in equilibrium with the local surface forcing. This may not hold true in such a heterogeneous environment. Furthermore, the parameterizations are not ideally suited to stable conditions such as those prevailing here (Nappo and Bach 1997). These uncertainties in the parameterization might be expected to result in changes to the absolute value of the duct depth, but not to alter significantly the general spatial distribution. Furthermore, Richter ( 1994) notes that errors in the assessment of propagation conditions are affected by spatial variability far more than uncertainties in the parameterizations. Although imperfect, this approach remains the only practical way to measure the spatial variability of the evaporation duct depth.
5. Conclusions
Aircraft observations of the near-surface wind, stress, and temperature fields around a coastal headland have been presented. These illustrate the response of the sea surface temperature field to the imposed forcing. The surface evaporation duct height has been determined from a bulk parameterization, and shown to vary significantly around the headland. These results identify an environment where the spatial variability of the surface evaporation duct should be accounted for when assessing radar propagation conditions.
Acknowledgements This work was supported by the Office of Naval Research. The CW96 field program was supported by the National Science Foundation.
References
Atkinson, B. W., and J. -G. Li., 2000: Numerical modeling of the propagation environment in the atmospheric boundary layer over the Persian Gulf. J. Appl. Met., IN PRESS.
Babin, S. M., 1996: Surface duct height distributions for Wallops Island, Virginia, 1985-1994. J. Appl. Meteor., 35, 86-93.
Babin, S.M., G. S. Young, and J. A. Carton, 1997: A new model of the oceanic evaporation duct. J. Appl. Meteor., 36, 193-204. Bean, B. B., and E. J. Dutton, 1968: Radio Meteorology, Dover
Publications, 435pp.
Brooks, I. M., A. K.Goroch, and D.P. Rogers, 1999: Observations of strong surface radar ducts over the Persian Gulf. J. Appl. Met., 38, 9, 1293-1310.
Burk, S. D., T. Haack, and R. M. Samelson, 1999: Mesoscale simulation of supercritical, subcritical, and transcritical flow along coastal topography. J. Atmos. Sci. 56, 2780-2795.
Cook, J., G. Vogel, and G. Love, 1994: Operational support for a range-dependent radio propagation model. . Proceedings of the NATO-AGARD conference proceedings 567, Propagation Assessment in Coastal Environments, Bremerhaven, Germany, Sept. 19-22. 13.1-13.7.
Craig, R. A., 1946: Measurements oftemperature and humidity in the lowest 1000 feet of the atmosphere over Massachusetts Bay. Pap.
Phys. Oceanogr. Meteor., 10, I, 1-47.
Dorman, C. E., T. Holt, D. P. Rogers, K. Edwards., 2000: Large scale structure of the June-July marine boundary layer along California and Oregon. Mon. Wea. Rev., 128, 1632-1652.
Emmons, G., 1947: Vertical distributions of temperature and humidity over the ocean between Nantucket and New Jersey. Pap.
Phys. Oceanogr. Meteor., 10, 3, 1-89.
Enriquez, A. G. and C. A. Friehe, 1995: Effects of wind stress and wind stress curl variability on coastal upwelling. J. Phys.
Oceanogr., 25, 1651-1671.
Fairall, C., E. F. Bradley, D. P. Rogers, J. B. Edson, and G. S. Young, 1996: Bulk parameterisation of air-sea fluxes for the Tropical Ocean Global Atmosphere Coupled Ocean-Atmosphere Response Experiment. J. Geophys. Res., 101, 3747-3764. Garratt, J. R., 1990: The internal boundary layer- A review.
Bound.-Layer Meteor., 50, 171-203.
Haack, T., and S. D. Burk, 1999: Summertime marine refractivitY. conditions along coastal California. Proceedings of the 3'd conference on Coastal Atmosphere and Ocean Prediction and Processes, 324-328.
Haack, T., S.D. Burk, C. E. Dorman, ahd D.P. Rogers, 1999: Flow criticality and coastal mesoscale dynamics. Proceedings of the 81h
conference on Mesoscale Processes, Boulder, Co, 428-433. Moszkowicz, S., G. J. Ciach, and W. F. Krajewski, 1994: Statistical
detection of anomalous propagation in radar reflectivity patterns.
J. Atmos. Oceanic Techno!., 11, 1026-1034.
Nappo, C. J., and W. D. Bach, 1997: Summary report on the ARO/ARL workshop on the stable planetary boundary layer. Bull.
Amer. Meteorol. Soc., 78,493-498.
Overland, J. E., 1984: Scale analysis of marine winds in straits and along mountainous coasts., Mon. Wea. Rev., 112, 2530-2534. Richter, J. H., 1994: Structure, variability, and sensing of the coastal
environment. Proceedings of the NATO-AGARD conference proceedings 567, Propagation Assessment in Coastal Environments, Bremerhaven, Germany, Sept. 19-22. ppl.l-1.13. Rogers, D. P., C. E. Dorman, K. A. Edwards, I. M. Brooks, W. K.
Melville, S. D. Burk, W. T. Thompson, T. Holt, L.M. Strom, M. Tjernstrom, B. Grisogono, J. M. Bane, W. A. Nuss, B. M. Morley, and A. J. Schanot, 1998: Highlights of Coastal Waves 1996. Bull.
Amer. Meteor. Soc.,79, 1307-1326.
Winant, C. D., C. E. Dorman, C. A. Friehe, and R. C. Beardsley, 1988: The marine layer off northern California: An example of supercritical channel flow. J. Atmos. Sci., 45, 3588-3605.
I. M. Brooks, Scripps Institution of Oceanography, 9500 Gilman Drive, La Jolla, CA 92093-0213 (e-mail: [email protected])