Ames Laboratory Technical Reports Ames Laboratory
11-1963
Vapor pressures of some amino acids
Dale Dean Clyde Iowa State University Harry Svec Iowa State University
Follow this and additional works at:http://lib.dr.iastate.edu/ameslab_isreports Part of theChemistry Commons
This Report is brought to you for free and open access by the Ames Laboratory at Iowa State University Digital Repository. It has been accepted for inclusion in Ames Laboratory Technical Reports by an authorized administrator of Iowa State University Digital Repository. For more information, please contactdigirep@iastate.edu.
Recommended Citation
Clyde, Dale Dean and Svec, Harry, "Vapor pressures of some amino acids" (1963).Ames Laboratory Technical Reports. 51.
Abstract
The vapor pressures of several amino acids have been determined by the Knudsen cell effusion method. The standard thermodynamic quantities for the heat of sublimation, the entropy of sublimation and the free energy of sublimation are calculated.
Disciplines Chemistry
"
IS-790!
IOWA
VAPOR PRESSURES OF SOME
AMINO ACIDS
by
Dale Dean 'clyde and Harry Svec
RESEARCH AND
DEVELOPMENT
REPORT
TID 4500, January l, 1964
UNITED STATES ATOMIC ENERGY COMMISSION
Research and Development Report
VAPOR PRESSURES OF SOME
AMINO ACIDS
by
Dale Dean Clyde and Harry Svec
November, 1963
Ames Laboratory at
Iowa State University of Science and Technology F. H. Spedding, Director
11
IS-790
This report is distributed according to the category Chemistry (UC-4) as listed in TID 4500, January 1, 1964.
Legal Notice
This report was prepared as an account of Government sponsored work. Neither the United States, nor the Commission, nor any person acting on behalf of the. Commission:
A. Makes any warranty of representation, express or implied, with respect to the accuracy, completeness, or usefulness of the information contained in this report, or that the use of any information, apparatus, method, or process disclosed in this report may not infringe privately owned rights; or
B. Assumes any liabilities with respect to the use of, or for damages resulting from the use of any information, apparatus, method, or process disclosed in this report.
As used in the above, ''person acting on behalf of the Commission" in-cludes any e.mployee or contractor of the Commission, or employee of such contractor, to the extent that such employee or contractor of the Commission, or employee of such contractor prepares, disseminates, or provides access to, any information pursuant to his employment of contract with the Commission, or his employment with such contractor.
Printed in U.S. A. Price $ l. 00 Available from the
IS-790
TABLE OF CONTENTS
Page
A B S T R A C T . . . v
INTRODUCTION • . . . 1
THEORY AND METHOD . . . 5
APPARATUS . . . . • . . . 10
EXPERIMENTAL R E S U L T S . . . 18
DISCUSSION OF ERRORS . . . 24
DISCUSSION OF RESULTS . . . 28
lV
IS-790
VAPOR PRESSURES OF SOME AMINO ACIDS>:<
by
Dale Dean Clyde and Harry Svec
ABSTRACT
The vapor pressures of several amino acids have been determined
by the Knudsen cell effusion method. The standard thermodynamic
quan-tities for the heat of sublimation, the entropy of sublimation and the free energy of sublimation are calculated.
The sensitivity of the mass spectrometer is calculated for an amino acid from its vapor pressure, its ionization cross-section and its inten-sity of the (P-COOH)+ ion currents relative to the total ion intensity.
Errata
Dale Dean Clyde and Harry Svec, "Vapor Pressures of Some
Amino Acids", USAEC Rept. IS-790 {1963}.
p. 19, Table 1. - The second column heading should read "Pressure {Torr)
X 10311
INTRODUCTION
The relationship of the vapor pressure oi crystallinF
compounds to their structure makes the study ot the sublimaticr;
process of considerable practical and theoretical interest.
Interpretation of the vapor pressure data can suggest tt:~
relative energy required for molecules or ions to break cr st.ll
bonds during the sublimation process. The vapor pressures of
several amino acids have been measured and their heats of
sublimation and other thermochemical properties have been
calculated. The presentation of these data with a discussion
of the results is the purpose of this report.
With the exception of glycine, values for the heats of sublimation or the vapor pressure of the amino acids have r1ot
been reported in the literature. At most, only time irttervalr
required to sublime an approximate amount of acid have be~:l
recorded over a temperature range of ten degrees (1).
In 1961, Takagi, Chihara and Seki (2) published value~
for the vapor pressure of glycine at various temperatures and
its heat of sublimation. They were interested in the structur~;
form of glycine in the vapor and the solid phases. Realizinc
the existence of the zwitterion, a dipolar ion characteristic
of the amino acids, they considered possible ionic or
molec-ular species present in glycine vapor. As an aid in
deter-mining the correct processes, these workers proposed the
zwi tterion
I
Ain gas phase
4
heat of h y d r a t i o n-D
proton transfer
72 kcal.
99.8 kcal.
~B
c /
lattice energy heat of
103 kcal. ~ solution
~.---/
3. 75 kcal.zwitterion
G /
observed heat of sublimation
31.2 kcal.
in crystal
E
I
protontransfer
7 .... 10~kcal.
molecule
H
/lin
crystalI
1hypothetical
~
heat of soln ofhydrated
zwitterion in water
F
heat of self neutralization
9. 7 kcal.
heat of sublimation hypothetical crystals
21-24 kcal. of molecular glycine
.---=/....,
3-6kcal.~
molecule in
gas phase ....---~
J
17.8 kcal.
heat of solution
of glycine vapor
hydrated molecule
in water
Energy-cycle of glycine (in kcal./mole) arrows indicate the direction of endo-thermic changes.
Figure 1. Heat of solution of hypothetical crystals of molecular glycine
[image:11.612.81.719.48.474.2]The va~'J?S for A (3) an~ C (4) are obtained from
pub-lished experimental results. The lattice energy (B) is
based on Kirkwood's theory using heats of solution and partial
molal volumes of solutions with varying dielectric constants.
A value of 21-24 kcal. for His based on van der Waals' force
energies and hydrogen bond energies. Takagi has determined
the value for G.
The process of self-neutralization, F, in solution is
evaluated from two reactions which are
and
H3N+CH2COOH = H2NCH2COOH + H+ + 6 Hb.
The value of 6 Ha is determined from the temperature variation
of pKa' giving 1.16 kcal.-mole- 1 . The heat change associated
with the reaction
H3N+CH2COO-
=
H2NCH2COO- + H+is 10.8 kcal.-mole-l which is approximately equal to
~Hb.
Theheat of self-neutralization is then 9.7 kcal.-mole- 1 .
The remaining processes D, E, J and I are calculated from
the completion of each energy cycle. These values are 72 kcal.,
7-10 kcal., 3-6 kcal., and 17.8 kcal., respectively.
From the above information Takagi et al. (2) has been
able to make the following conclusions:
1. If the sublimation does not accompany a proton
trans-fer, the lattice energy would be the energy necessary for
4
than the calculated heat.oi sublimation, Takagi concluded
that glycine sublimes with Lh~ n1olecular configuration. Ihe
observation (5) of the absence of the zwitterion in the vapor
by means of mass spectrometry confirms this conclusion.
2. The energy required to transfer a proton witt.in the
crystal is D of Figure 1. The energy required to transi21
a proton within a molecule in glycine vapor is E. The proc~ss
requiring the least amount of energy, and therefore the more
likely to occur, is the transformati on from a zwitterion to
a molecule within the crystal before sublimation takes place.
Dr. H. J. Svec and Greg Junk (6) have developed a m2ss
spectrometric method for the quantitative analysis of the
amino acids in which the instrumental sensitivity for different
amino acids is obtained empirically. In order to analyze a
mixture of amino acids, the sample must be vaporized in the
mass spectrometer. The relative amounts of the amino acids
in the vaporized sample depends on their vapor pressures.
An analyst .using this procedure could be more selective in his
analysis i f he knew the vapor pressures of a variety of amino
acids over a range of temperature. One of the purposes for
this research then was to increase the usefulness and potential
of this analytical method by providing some needed vapor
THEORY AND METHOD
Due to the strong bonding of the dipolar ions present
in solid amino acids, vapor pressures are low and the heats
of sublimation are much higher than those for corresponding
analogous straight chain aliphatic acids. As a result a
special apparatus and technique must be used to measure the
vapor pressures. A procedure capable of measuring low vapor
pressures is the Knudsen effusion method which has been used
for this research.
At the beginning of the twentieth century, Knudsen (7)
noted a direct relationship between the vapor pressure of a
sample and the weight lost during a measured interval of time.
The molecules of the sample passed through a hole of known
area in a vessel containing vapor in equilibrium with the
solid or liquid sample. By assuming that the Maxwellian
velocity distribution of the molecules can be averaged, he
expressed the number of molecules striking an area of wall
equal to the area of the orifice by
(J = 1/4
z
c ( 1 )h th b f 1 1 3 d
-w ere
z
=
e num er o mo ecu es per em an c=
average meanvelocity. From the equation for a perfect gas, PV = NRT, (2)
A
z
can be calculated according to Z=
N=
AP=
the number of3
V
RTmolecules per em , (3) where N
=
number of molecules of the gasand A= Avogadro's number.
The total number of molecules (8) effectively leaving
6
a surface was considered equal to the difference between the
number leaving ( 0 )
1"""'2
solid phase or
and the number returning ( 0 ) to the
2-+l
The pressure P1 on one side of the orifice is lower than
the pressure P2 on the other side of the orifice such that the
mean free paths of the molecules are at least ten times the
orifice diameter.
If the effusion vessel is placed in a vacuum, then P2 = 0
and
cr =A Plc (5)
1~ 4 RT
From the Maxwell-Boltzmann distribution of velocities, the
arithmetical average velocity is
and
c
=
(8RT)l/27rM
(J 1-+2
where M
=
molecular weight of the gas.( 6)
( 7)
It follows that the amount leaving the surface can be
expressed as
Substituting Equation
and
m
=
cr
M1-+2
A
(7) in (8) gives
( M )1/2 m
=
p 27rRT( 8)
( 9 )
For R
=
8.314 x 10⁷ erg-deg- 1-mole- 1 , Equation (10) becomeswhere
P
=
(2.286 x10
4)~
J.I
dynes at M cm2a
=
area in cm2 , t=
time in seconds,w
=
weight lost in grams, T=
temperature in absoluteand
M
=
molecular weight. Converting to observable units gives(11)
degrees
P
=
17.14 wJI
mm. (12)~M
Clausing (9) realized subsequently that if the hole were longer than the mean free path of a molecule, some of the molecules would collide with the inside wall of the effusing hole. This meant that some of the molecules could be re-fleeted back into the cell. Thus a factor to correct this effect was needed. The equation for the calculation of vapor pressures became,
p = 17.14 ~
J.I
w0 at M
where W0 is the Clausing factor.
(13)
The factor which he introduced was experimentally shown to be a function of the radius of the cylinder through which the molecules traveled and thus the Clausing factor in
Equation (13) is the correction factor for the effusion ori-fice. Following the work of Clausing, Demarcus (10) theoret-ically calculated more accurate values for the Clausing factors.
8
number of molecules than actually escape through real holes.
Only when the cell has no opening, does a true equilibrium
pressure exist. In reality the equation given by Knudsen
represents a steady state pressure. Speiser (ll) considered
a material balance for the sublimation of a sample from a
Knudsen cell. The rate of vaporization equals the summation
on the rate of condensation and the rate of effusion. From
the kinetic theory of gases, the following relationships can
be derived:
where
Rc = a pss ( 21TMRT) -l/2HsA,
Rv = a peq (21TMRT)-l/2H A and s
Re = P 0 (21TMRT)-l/2H A 0
Hs = area of the sample
H0 = area of the orifice
a = vaporization coefficient
P0 = pressure at the orifice
P = steady state pressure
Rss= rate of condensation Rc = rate of vaporization
R~ = rate of effusion
A =Avogadro's number
Peq
=
equilibrium pressure.From the equation accounting for a material balance,
Rv
=
Rc + Re'P can be obtained and becomes
eq
peq = pss + PoHo
aH5
(14)
(15)
(16)
(17)
(18)
Whitman (12) was the first to apply a Clausing factor
to correct for the shape of the cell in the vaporization
equation
Pss
=
Pe(19)
1 + w~ H0
(l
+ 1-
2)Hs a
r
afor the steady state pressure Pss where W~ and W~ are Clausing
factors for the orifice and the cell, respectively. If the
depth of the cell is as long as the diameter of the cell, the
Clausing factor for the cell is approximately 0.5. If a
=
1,then the equation for the measured steady state pressure
10
APPARATUS
The apparatus used for the study of the vapor pressure
of the amino acids consisted of a fused quartz microbalance
by which weight-loss measurements were made. Figure 2 shows
a schematic diagram of the apparatus. The microbalance was
patterned after the one described by Defayette (14) except
that the one used in this study has greater capacity with a
resulting lower sensitivity. Free use was made of the work
of Edwards and Baldwin (15) who discuss the construction of
microbalances and their operation. The balance (shown at A
in Figure 2) was made from a 4 mm quartz tube approximately
20 em long, trussed with a quartz rod. Quartz fibers were
pulled from stubs on each side of the main beam at its center
and fused to a supporting-quartz frame. A piece of Cunife
(General Electric Co., Schenectady, N. Y.) rod was machined
to fit in the center of the main beam. After the metal rod was
sealed in place by pieces of quartz rod fused to the main beam,
it was magnetized by a force of 200,000 ampere turns. Quar~z
hooks were placed on each end of the beam and a quartz fiber
was drawn from one end of the beam to serve as an index.
The balance which behaves like a tangent galvanometer
is operated by a passing current through the two solenoids
shown at B in the figure. A variation of the current changes
the electromagnetic field perpendicular to the Cunife magnet
MERCURY DIFFUSION PUMP
PRESS SEAL...____ CHROMEL- ALUMEL -" THERMOCOUPLE -....-_. E
SAMPLE EFFUSION CELL I II l't -i...J
EMPTY CELL I 1l II •O
LABORATORY JACK CENCO- LERNER NO. 19089 CHICAGO, ILL.
THERMOMETER
TYPE 507
I 110N GUAGE,
NRC EQUIP. CORP.
(SEEN THROUGH TELESCOPE l QUARTZ MICROBALANCE
COUNTER WEIGHT
THERMOSWITCH (FENWAL NO. 17502,ASHLAND, MASS.)
SCREW CAP
.!.
16
8
~-t.
' I ii
FOIL CORP.
Figure 2. Gravimetric apparatus for studying the vapor pressures of several
amino acids
[image:20.612.43.784.17.548.2]The solenoid current is related directly to weight differences.
Each coil was wound on a brass sp~ol 1~ ~m in diameter and 3
em wide and consisted of approximately 1100 turns of For11Vdl
insulated AWG 22 copper wire. The circuit was connected as shown in Figure 3. The coils were connected in series with helical variable resistors, four six-volt batteries, a con
-stantan wire resistor and the circuit polarity was changeable by means of a polarity reversing switch. An accurate measure -ment of the current flowing through the coils was made by
measuring the IR drop across the manganin resistor with a potentiometer.
The balance was used as a null instrument. A telescope
with ocular cross hairs (Gaertner Scientific Co.) allowed the
observation of the quartz index extending from one end of the
microbalance. All weighings were made by adjusting the micro -balance index to coincide with the point of intersection of
the ocular cross hairs. The sample and the counterweights
were suspended from the ends of the balance beam at A and B. The balance was calibrated by observing the change in the coil
current required to restore the balance to the null position
after a precision weight was added to one side of the balance
under its working load. The weights used for the calibration of the quartz microbalance were made of platinum and aluminum
wire and were accurately weighed on a conventional balance
(Mettl er Type Hl6). A plot of millivolts (potentiometer
L,
~
L,~
I!
I
B
.--=,~
I
R 1 (,I Ka l
~OK a)
R3
( 5.430 .Q)
POTENTIOMETER
(LEEDS S NORTHRUP
N0.8691 l
L___ __________ -o
L1 AND L2 ARE SOLENOIDS ( BSS AWG 22 MAGNETWIRE).
51 IS A DPDT SWITCH.
52 IS A SPST SWITCH.
R1 AND R2 ARE 10 TURN VARIBLE RESISTORS (HELl POT, BECKMAN INSTRUMENT INC.).
R3 IS A PRECISION RESISTOR CONSTANTAN WIRE.
8 IS A UNIT OF FOUR SIX- VOLT STORAGE BATTERIES CONNECTED IN SERIES.
14
milligrams gave a straight line for weights of 0 to SO mg.
The sensitivity of the balance was calculated from the slope
by the method of least squares. Since the beam of the
micro-balance is suspended from the basic frame by very small quartz
fibers, the load was limited and changes in the position of
the balance had to be made slowly and carefully. On one
occasion, the balance was accidentally given a sudden jolt
during its operation and was broken. It was repaired and
recalibrated. The sensitivity of the original balance and
-1
of the repaired balance were 0.075
±
0.009 mg-mv and 0.072-1+
±
0.008 mg-mv -, respectively. These two values appear inthe record of this work which appears in the author's research
notebook.
A thermostated salt bath was used to heat tube C of
Figure 2. The salt bath container was made from a stainless
steel cylinder six inches in diameter and twenty-two inches
long which was wrapped with a layer of asbestos followed by
approximately forty turns of resistance wire (Chromel A,
AWG 20, Hoskins Manufacturing Co., Detroit) which acts as a
heater. Another layer of asbestos was placed over the wires
and the container was further insulated with a layer of fiber
glass pipe insulation. A 0-130 volt variable autotransformer
(Superior Electric Co., Bristol, Conn.) and a thermoswitch
(Fenwal no. 17502, Ashland, Mass.) were connected in series
with the heater. The bath mixture (16) consisted of 18 weight
cent KN03 which has an eutectic freezing point at l20°C. A mechanical stirrer and a mercury thermometer were also placed
in the bath. A laboratory jack (Cenco-Lerner no. 19089,
Chicago, Ill.) was used to adjust the height of the bath
around the tube in which the effusion cell was suspended.
A chromel-alumel thermocouple was used to measure the
temperature in tube C. The thermocouple wires were
intro-duced through the side of the tube at E and extended along
the inside wall of the tube to the bottom as are shown in
Figure 2. The fused junction of the thermocouple was located
directly below the suspended effusion vessel. During the
operation of the apparatus, a blackened effusion cell was
placed upside down over the thermocouple junction. The wires
leading from the hot junction were connected in series with
0
a cold junction kept at 0 C and a potentiometer.
A mercury diffusion pump and a liquid-N2 cooled trap, backed by a rotary mechanical pump maintained a sufficiently
low pressure within the system. An ionization guage with an
electronic guage control unit indicated the pressure in the
apparatus. All joints were sealed with Apiezon W vacuum wax
except the joint of tube C. Apiezon N was used for this joint
since this made it more convenient to introduce samples into
the system.
The conditions necessary for molecular flow were
16
(see detail in Figure 2). The effusion aperture measured
-3
0.32 mm in diameter. At a pressure of 10 Torr, this is
less than ten times the shortest mean free path calculated
for the largest amino acid molecule studied. A microdrill
was used to bore the hole in a tantalum disc, 0.05 mm thick.
After the hole was polished with Crocus cloth, its size was
measured with a metallographic microscope fitted with a filar
eyepiece.
The effusion vessels (see detail in Figure 2) were made
from one half-inch diameter aluminum rod and were one inch
long. A concentric hole 3/8 inch in diameter and 9/16 inch
deep was drilled in the rod. With a sample packed in the
vessel, the free space of the cell was approximately as long
as the inside diameter of the vessel. To insure good heating
by radiation from the furnace, each container was painted with
Aquadag (Acheson Colloid Corp., Port Huron, Mich.) and baked.
The tantalum disc with the aperture was firmly held in place by
means of a screw cap designed to fit the top of the cell. The
screw cap had a large enough hole in its center so that the
effusion aperture was not covered.
After the effusion vessel was filled with an amino acid
and placed inside the vacuum apparatus which was then pumped
-4
down to a pressure of S x 10 Torr or less, the salt bath was
raised and the stirrer started. In thirty to forty-five
equilib-rium as indicated by the thermocouple and the bath
ther-mometer. The variable resistors in the balance circuit were
adjusted until the balance was at the null position. Balance
readings were recorded at fifteen minute to one hour
inter-vals, depending upon the volatility of the sample. Timing
was by means of an electrical timer (Lab-Chron 1501). The
bath stirrer had to be stopped during the time of each reading
in order to avoid vibration of the balance. Several readings
at several different temperatures were made during a single
18
EXPERIMENTAL RESULTS
Data for the amino acids studied are tabulated in Table
1. The values for log P were plotted against reciprocal
absolute temperatures. This gave a straight line according
to the equation
log P = - A + B (20)
T
where A is the slope and
B
is the intercept. Equations forthe best line fitting the data were obtained by the least
squares method and are listed in Table 2. The uncertainties
in the slope and the intercept were also calculated by the
least squares method.
The equation used in the calculation of the standard
thermodynamic quantities ot sublimation is
0 0 0 (
~F = ~H
-
T~S = -RT ln P atm)or
0 .
J
~F = -2.303 RT llog P(mm) - log 760 .
Substitution of Equation (20) for log P gives
0 .
J
~F =-2.303 RT
l -
A
+B -
log 760_.T
The rearranged equation is
~F0 = 4.576
A -
4.576[B -
2.88l]T .Comparison of Equation (24) with Equation (21) shows that
~F0 = 4.576 A and
6S0 = 4.576 [B- 2.881].
The standard thermodynamic quantities calculated for ( 2.1 )
(22)
(23)
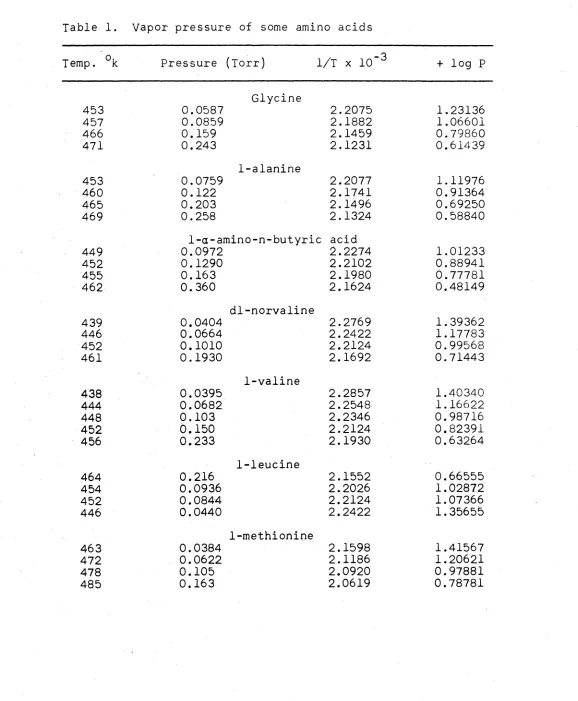
Table 1. Vapor pressure of some amino acids
Temp. ok Pressure (Torr) 1/T X 10- 3 + log P
Glycine
453 0.0587 2.2075 1.23136 457 0.0859 2.1882 1. 06601 466 0.159 2.1459 0.79860 471 0.243 2.1231 0.61439
1-alanine
453 0.0759 2.2077 1.11976 460 0.122 2.1741 0.91364 465 0.203 2.1496 0.69250 469 0.258 2.1324 0.58840
1-a-amino-n-butyric acid
449 0.0972 2.2274 1.01233 452 0.1290 2.2102 0.88941 455 0.163 2.1980 0.77781 462 0.360 2.1624 0.48149
dl-norvaline
439 0.0404 2.2769 1. 39362 446 0.0664 2.2422 1.17783 452 0.1010 2.2124 0.99568 461 0.1930 2.1692 0.71443
1-valine
438 0.0395 2.2857 1.40340 444 0.0682 2.2548 1.16622 448 0.103 2.2346 0.98716 452 0.150 2.2124 0.82391 456 0.233 2.1930 0.63264
1-leucine
464 0.216 2.1552 0.66555 454 0.0936 2.2026 1.02872 452 0.0844 2.2124 1.07366 446 0.0440 2.2422 1.35655
1-methionine
[image:28.612.23.601.75.776.2]20
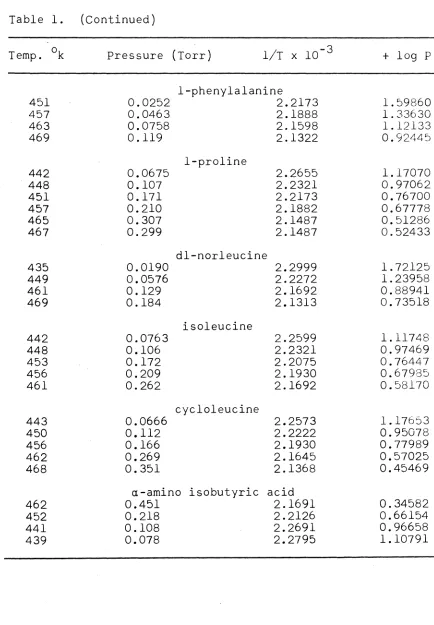
Table l . (Continued)
Temp. ok Pressure (Torr) 1/T X 10- 3 + log P
1-phenylalanine
451 0.0252 2.2173 l. 59860
457 0.0463 2.1888 l . 33630
463 0.0758 2.1598 l. 12133
469 0.119 2.1322 0.92445
1-proline
442 0.0675 2.2655 1.17070
448 0.107 2.2321 0.97062
451 0.171 2.2173 0.76700
457 0.210 2.1882 0.67778
465 0.307 2.1487 0.51286
467 0.299 2.1487 0.52433
dl-nor1eucine
435 0.0190 2.2999 1.72125
449 0.0576 2.2272 1.23958
461 0.129 2.1692 0.88941
469 0.184 2.1313 0.73518
isoleucine
442 0.0763 2.2599 1.11748
448 0.106 2.2321 0.97469
453 0.172 2.2075 0.76447
456 0.209 2.1930 0.67985
461 0.262 2.1692 0.58170
cycloleucine
443 0.0666 2.2573 1.17653
450 0.112 2.2222 0.95078
456 0.166 2.1930 0.77989
462 0.269 2.1645 0.57025
468 0.351 2.1368 0.45469
a-amino isobutyric acid
462 0.451 2.1691 0.34582
452 0.218 2.2126 0.66154
441 0.108 2.2691 0.96658
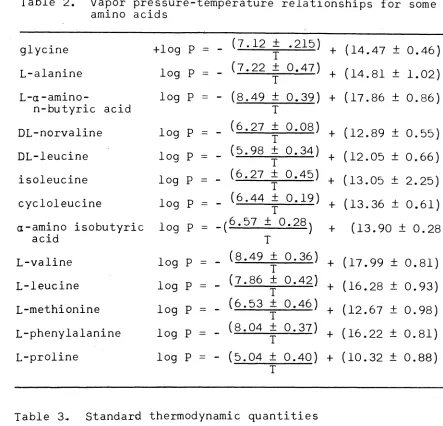
[image:29.612.90.524.88.713.2]Table 2. Vapor pressure-temperature relationships for some amino acids
glycine +log p ·-
-
(7.12 ± .215) + (14.47 ± 0.46)I
L-alanine log p
=
-
(7.22 ± 0.47) + (14.81 ± 1.02) IL-a-amino- log p
=
(8.49 ± 0.39) + (17.86 ± 0.86)n-butyric acid I
DL-norvaline log p
=
(6.27 ± 0.08) + (12.89 ± 0.55) IDL-leucine log p
=
(5.98 ± 0.34) + (12.05 ± 0.66) Iisoleucine log p
=
(6.27 ± 0.45) + (13.05 ± 2.25) Icycloleucine log p
=
(6.44 ± 0.19) + (13.36 ± 0.61) Ia-amino isobutyric log p
=
-(6.57 ± 0.28) + (13.90 ± 0.28)acid I
L-valine log p
=
(8.49 ± 0.36) + (17.99 ± 0.81) IL-leucine log p
=
(7.86 ± 0.42) + (16.28 ± 0.93) IL-methionine log p
=
(6.53 ± 0.46) + (12.67 ± 0.98) IL-phenylalanine log p
=
(8.04 ± 0.37) + (16.22 ± 0.81) IL-proline log p
=
(5.04 ± 0.40) + (10.32 ± 0.88) ITable 3~ Standard thermodynamic quantities
this Takagi(2) research
-heat of sublimation 31.18 ± 0.49 kcal/mole 32.6 ± T.O
entropy of sublimation free energy of
sublimation
49.33 ± 1.17 cal/deg-mole 53.0 ± 2.2 16.47 ± 0.60 kcal/mole 16.8 ± 1.2
[image:30.612.72.515.99.525.2]---22
glycine agree with the values reported by Takagi et al.within
--
--experimental error. These values are given in Table 3 along
with the values obtained in this work. The same thernodynamic
quantities have been calculated for all of the amino acids
studied and are tabulated in Table 4.
L-glutamic acid, L-cystine, L-tyrosine, L-tryptophan and
L-serine were not stable enough to determine their heats of
sublimation in the temperature range of 150° to 200°C. No
b,.So t::,.Fo b,.Ho Density Solubility(i7)
cal/deg-mole kcal/mole kcal/mole gm/cm3 at 25°C
gm/100 gm
of H20
Glycine 53.0 ± 2.2 16.8 ± 1. 2 32.6 ± 1.0 1.601 24.99
i.-alanine 54.6 ± 4.7 18.1 ± 2.6 33.0 ± 2.2 1.401 16.65
L-a-amino-n- 68.6 ± 3.9 18.4 ± 2.1 38.9 ± 1.8 1.231 18.56 20°C
I butyric acid
-1 DL-norvaline 45.8 ± 2.5 15.0 ± 0.9 28.7 ± 0.4 1.316 7.09
i- DL-leucine 42.0 ± 3.0 14.8 ± 1. 8 27.4 ± 1.6 1.191 0.991
isoleucine 46.5 ±10.3 14.8 ± 3.7 28.7 ± 2.1
cycloleucine 48.0 ± 2.8 15.2 ± 1. 2 29.5 ± 0.9
a-amino iso- 50.4 ± 1. 3 15.0 ± '1.4 30.1 ± 1. 3 N
butyric acid w
L-valine 69.1 ± 3.7 18.2 ± 1. 9 38.9 ± 1.6
L-leucine 61.3 ± 4.3 17.7 ± 2.3 36.0 ± 1. 9
20°C
L-methionine 44.8 ± 4.5 16.5 ± 2.5 29.9 ± 2.1 1.278 13.71
L-phenylalanine 61.0 ± 3. 7 18.6 ± 2.0 36.8 ± 1. 7 1.230 8.85
[image:32.612.66.755.54.594.2]24
DISCUSSION OF ERRORS
According to Phipps, Seifert, Simpson and coworkers (17),
the errors occurring in the calculated vapor pressure can be
divided into four types--inherent, systematic, statistic and
basic errors.
Inherent errors are due to an incomplete knowledge of
some quantity not measured in the experiment. Such errors
are of concern in Avogadro's number, the molecular weight of
the compound and the gas constant. Since the values for these
constants are considered correct, the error introduced by
them is insignificant.
Systematic errors represent the uncertainty in a measured
quantity in a nonrandom manner. Errors of this type involved
in this research are (1) in the measurement of the orifice
area, (2) in the weights used to calibrate the balance and to
determine the conversion factor, (3) the Clausing factor, and
(4) in the thermocouple calibration. In addition a systematic
error occurs when the measured vapor pressure is assumed to
equal the true equilibrium pressure. Use of the equation given
by Motzfeldt (13)
pss = Pe (22)
1 + W'H (1. + 1
-
2) ~ a ijj"'"Hs a
reveals the magnitude of this error. The diameter of the cell
research, the evaporation coefficient can be estimated to be nearly equal to one (19). Thus the equation becomes
(23)
Since the ratio of the areas is 0.0015, and the product of this ratio and H0 is insignificant, the equilibrium pressure can be assumed to be the same as the measured vapor pressure.
Statistical errors represent the uncertainty in the measured quantity in a random manner. These include errors in the time, the temperature, the Clausing factor, the area
and the loss in weight of the sample. The estimated uncertainty in reading the time is 0.03 of a minute or about 2 seconds.
Since all of the time intervals were greater than 10 minutes, the maximum error in the time is± 0.3%. The error in the temperature is determined by the error in reading the potentio-meter and by the error in the spread of the temperature during the experiment.
- [ 2 + 2 ]1/2
crtemp - crpot crrange (24) The maximum spread in the temperature during an experi-ment corresponded to
a
potentiometer reading of ± 0.04 mvor+ 1°C for the Chromel-Alumel thermocouple. This corresponds to an error of ± 0.5%. The error in reading the potentiometer was + 0.005 mv which was negligible compared to the temperature
26
reading was estimated to be
±
0.04 mg. Since two readingswere taken for each weight-loss interval, the total
uncer-tainty becomes
± 0.08
mg. The error introduced in the vaporpressure is not uniform because the weight varies; however,
most of the samples lost over 2 milligrams. The estimated
error in the vapor pressure is estimated to be + 4%.
The Clausing factor was determined by extrapolation of
the data given by Demarcus (10). The error in this value
depends upon the error in the ratio L/R and the error in
reading the graph.
(25)
The micrometer used to measure the thickness of the
tantalum foil was calibrated against a set of standard guages.
Its standard deviation was calculated to be + 0.0006 mm.
From this value the calculated per cent error in the ratio
(L/R) is± 1.0%.
The error in reading the value from the graph used to
obtain the Clausing factor is estimated to be
±
0.0003, or a±
0.04% error. Therefore, there is a total error of + 1% inthe value of this factor.
The uncertainty in the measurement of the diameter of the
orifice is + 0.002 mm. which corresponds to an error of
±
1.2%. The error due to the linear expansion of thetan-talum metal is negligible over the temperature range for the
sublimation of the amino acids.
a p
=
-+ 4.3% error.(26)
28
DISCUSSION OF RESULTS
Values were calculated for the standard entropy,
standard free energy and the heat of sublimation for glycine.
The author's values for these quantities agree within
experi-mental error with those published by Takagi et al. (2) (~,ee
Table 3).
Other observations noted from the results are as follows:
A. Branching at the end of a hydrocarbon chain results
in a high heat of sublimation. Examples are valine, leucine
and phenylalanine which have a heat of sublimation of
approxi-mately 36-38 kcal./ mole.
B. Branching on any inner carbon atom except the psi
and omega atoms of a hydrocarbon chain lowers the heat of
sublimation. For example, isoleucine and cycloleucine have
a heat of sublimation approximately 7-8 kcal./mole less than
leucine.
C. Proline, a heterocyclic amino acid, had the lowest
heat of sublimation observed. No other such acids were tested
so it is not possible to state that this is generally true.
D. In a homologous straight chain series such as
glycine, 1-alanine, 1-a-amino-n-butyric acid, dl-norvaline
and dl-norleucine, there is a gradual decrease in the heat of
sublimation with lengthening of the chain. Exception to this
is the nonnaturally occurring amino acid, 1-a-amino-n-butyric
E. In comparing isomers, the heat of sublimation is
always greater for the acid in which branching occurs on the
omega carbon. For example, valine and leucine have a greater
heat of sublimation than norvaline and norleucine,
respec-tively, by approximately 9-10 kcal./mole. The butyric acid
isomers are again an exception. The 1-a-amino-n-butyric acid
is greater than the a-aminoisobutyric acid by approximately
9 kcal./mole.
F. Anomalies for the butyric acids are also observed
in the solubilities and the crystal densities {see Table 5).
No attempt has been made to explain the above trends.
This might be done if a knowledge of the lattice energy of
the crystalline acids and heats of hydration were known.
Unfortunately these are unavailable for all of the amino
acids except glycine.
A mixture of amino acids can be quantitatively analyzed
by means of a mass spectrometer. The sensitivity of the
analysis of an amino acid depends upon its vapor pressure, its
ionization cross section and the intensity of the (P-COOH)+
ion current relative to total ion intensity. Svec and Junk
(6) have ~mpirically determined the relative sensitivities
by using an internal standard in the mass spectrometer. The
sensitivities can be calculated from the vapor pressure by
the equation
S
=
[%
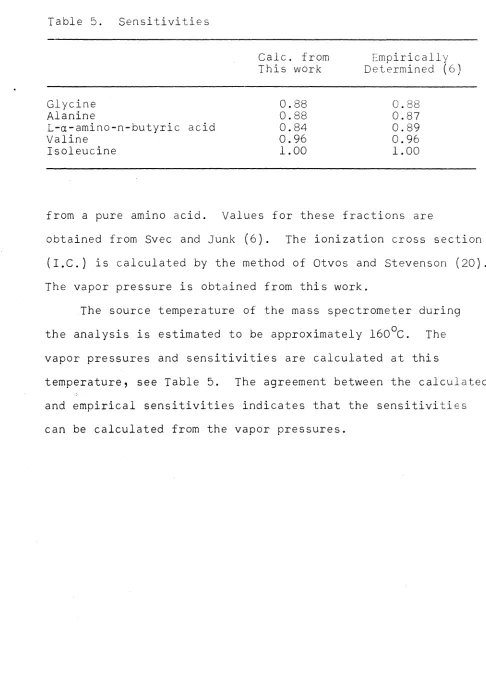
(P-COOH)+](I.C.)(V.P.)l/2Table 5. Sensitivities
Glycine Alanine
L-a-amino-n-butyric acid Valine
Isoleucine
30
Calc. from This work
0.88 0.88 0.84 0.96 1.00
Empirically Determined (6)
0.88 0.87 0.89 0.96 1.00
from a pure amino acid. Values for these fractions are
obtained from Svec and Junk (6). The ionization cross section
(I.C.) is calculated by the method of Otvos and Stevenson (20).
The vapor pressure is obtained from this work.
The source temperature of the mass spectrometer during
the analysis is estimated to be approximately 160°C. The
vapor pressures and sensitivities are calculated at this
temperature, see Table 5. The agreement between the calculated
and empirical sensitivities indicates that the sensitivities
[image:39.612.56.542.72.769.2]BIBLIOGRAPHY
1. Greenstein, Jesse P. and Milton Winitz. Chemistry of the amino acids. lst ed. Vol. 1. New York, New York. John Wiley and Sons, Inc. 1961.
2. Takagi, S., H. Chihara and S. Seki. Vapor pressure of molecular crystals. XII. Vapor pressure of
a-glycine crystals. Chemical Society of Japan Bulletin 32: 84. 1959.
3. Shimura, K. Studies in the physical chemistry of amino acids and proteins. III. In Japanese; translated title Nippon Nogeikagaku Kaishi 24: 412. 1951.
4. Dalton, J. B. and C.L.A. Schmidt. The solubilities of certain amino acids in water, the densities of their solutions at twenty-five degrees, and the calculated heats of solution and partial molal volumes. Journal of Biological Chemistry 103: 549. 1933.
5. Junk, Gregor and Harry Svec. The mass spectra of the a-amino acids. American Chemical Society Journal 85: 839. 1963.
6. Junk, Gregor and Harry Svec. The use of the mass spectrometer for the quantitative analyses of mixtures of amino acids. Analytica Chimica Acta 28: 164. 1963.
7. Knuds~n, M. Die Molekular Stromung der Gase durch Offnungen und die Erguss. Annalen der Physik 28: 999. 1909.
8. Bockris,
J.
O'M. Physicochemical measurements at high temperatures. London Butterworths Scientific Publications. 1959.9. Clausing, P. Die Formeln der Molekular-stromung nach v. Smoluchowski und nach Gaede. Annalen der Physik 42: 567. 1930.
10. Demarcus, W. The problem of Knudsen flow. III.
Solutions for one-dimensional systems. U. S. Atomic Energy Commission Report K-1302 [Oak Ridge Gaseous Diffusion Plant, Tenn.]. 1956.
32
12. Whitman, Charles I. On the measurement of vapor
pressures by effusion. Journal of Chemical Physics 20: 161. 1952.
13. Motzfeldt, K. The thermal decomposition of sodium carbonate by the effusion method. Journal of Physical Chemistry 59: 139. 1955.
14. Defayette, R. W. yttrium and Ames, Iowa. Science and
Kinetics of the reaction between water vapor. Unpublished M.S. thesis
Library, Iowa State University of Technology. 1959.
15. Edwards, F. and R. Baldwin. Magnetically controlled quartz fiber microbalance. Analytical Chemistry 23: 357. 1951.
16. Carveth, H. R. Study of a three component system.
17.
Journal of Physical Chemistry 2: 209. 1898.
Hodgman, C. D., R. C Weast, and S M. Selby, eds.
Handbook of chemistry and physics. 39th ed. Cleve-land, Ohio. Chemical Rubber Publishing Co. 1958.
18. Phipps, T. E., N. D. Erdway, L. 0. Gilpatrick, A. W.
Jasaitis, F. D. Johnson, G. W. Sears, R. L. Seifert, and 0. C. Simpson. U S. Atomic Energy Commission Report CN-3223 [Chicago. Univ. Metallurgical Lab.]. 1945.
19. Balson, E. W. Some aspects of molecular effusion. Journal of Physical Chemistry 65: 1151. 1961.