This is a repository copy of
The Simulation of Organised Car Sharing (2) – The Simulation
Models and their Calibration.
.
White Rose Research Online URL for this paper:
http://eprints.whiterose.ac.uk/2414/
Monograph:
Bonsall, P.W. (1979) The Simulation of Organised Car Sharing (2) – The Simulation
Models and their Calibration. Working Paper. Institute of Transport Studies, University of
Leeds , Leeds, UK.
Working Paper 109
[email protected] https://eprints.whiterose.ac.uk/
Reuse
Unless indicated otherwise, fulltext items are protected by copyright with all rights reserved. The copyright exception in section 29 of the Copyright, Designs and Patents Act 1988 allows the making of a single copy solely for the purpose of non-commercial research or private study within the limits of fair dealing. The publisher or other rights-holder may allow further reproduction and re-use of this version - refer to the White Rose Research Online record for this item. Where records identify the publisher as the copyright holder, users can verify any specific terms of use on the publisher’s website.
Takedown
If you consider content in White Rose Research Online to be in breach of UK law, please notify us by
White Rose Research Online
http://eprints.whiterose.ac.uk/
Institute of Transport Studies
University of Leeds
This is an ITS Working Paper produced and published by the University of
Leeds. ITS Working Papers are intended to provide information and encourage
discussion on a topic in advance of formal publication. They represent only the
views of the authors, and do not necessarily reflect the views or approval of the
sponsors.
White Rose Repository URL for this paper:
http://eprints.whiterose.ac.uk/
2414/
Published paper
Bonsall, P.W. (1979)
The Simulation of Organised Car Sharing (2) – The
Simulation Models and their Calibration.
Institute of Transport Studies, University
of Leeds, Working Paper 109
Working Paper 109
May 1979
THE SIMULATION OF
ORGANISED CAR SHARING (2)
-
THE SIMULATION MODELS
AND THEIR CALIBRATION
by
Peter
Bonsall
ABSTRACT
1. INTRODUCTION
1.1 Aims of the project
1.2 Microsimulation
1.3 Microsimulation compared with other model forms
1.4
Revealed preference or stated intentions2. STRUCTURE OF THE MODEL
Introduction
Synthesis of the population base
Definition of the scheme to be tested
The simulation of individuals' decisions to join a given car sharing scheme
The processing of applications
The simulation of the decision to match
The failure of matches to survive
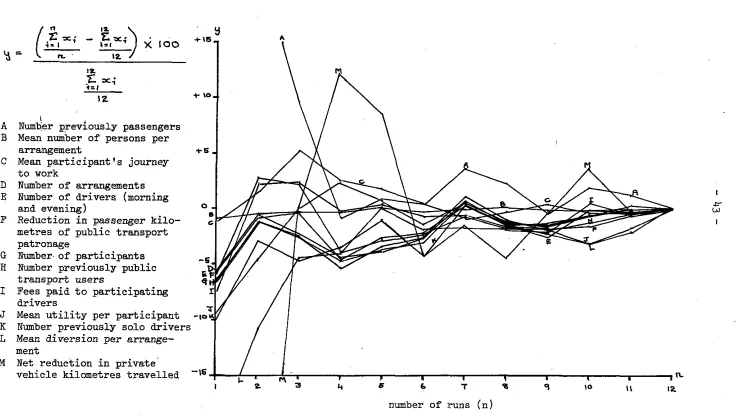
System performance indicators
3. CALIBRATION OF THE DECISION MODELS
3.1 Introduction
3.2 Calibration of the decision to join a given car sharing scheme
3.3 Calibration of the decision to match
4.
PERFORMANCE OFTHE
MODELS4.1
Introduction4.2 Results of the calibration of the decision to apply
4.3 Results of the calibration of match utilities
4.4
Results of the microsimulation models4.5
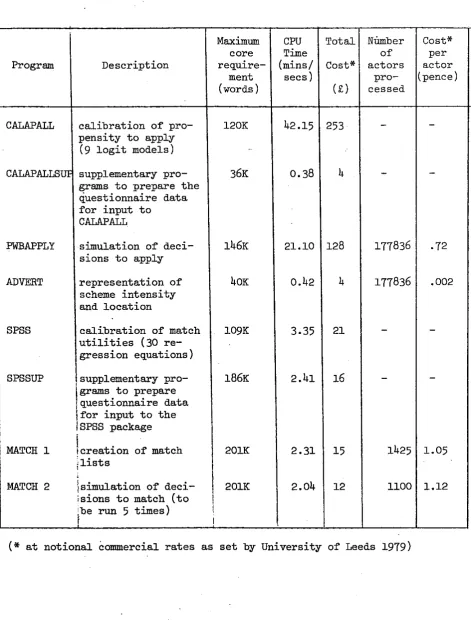
Computational performance of the models5. DISCUSSION AND CONCLUSIONS
5.1
Criticism of the model as formulated-
possible enhancements5.2 Conclusions
REFERENCES
ABSTRACT
BONSALL, P.W. (1979) The simulation of organised c a r s h a r i n g
I1
-
The simulation models and t h e i r c a l i b r a t i o n . Leeds:University of Leeds, I n s t . Transp. Stud., WP 109 (unpublished).
This paper i s one of a s e r i e s d e s c r i b i n g t h e methocis and f i n d i n g s of a TRRL sponsored p r o j e c t t o simulate organised c a r sharing. This volume d e s c r i b e s t h e simulation model and i t s c a l i b r a t i o n . The model r e q u i r e s a s input a d e s c r i p t i o n of each i n d i v i d u a l tripmaker w i t h i n t h e system ( t h e r e a r e 180,000 such i n d i v i d u a l s i n t h e study a r e a under i n v e s t i g a t i o n ) . Using t h e s e i n d i v i d u a l s a s a c t o r s , t h e model simulates, w i t h i n a c a l i b r a t e d choice model, t h e d e c i s i o n - o f each of them i n t u r n whether o r not t o apply t o j o i n a hypothesised c a r s h a r i n g scheme. The matching of such a p p l i c a n t s t o form p o t e n t i a l c a r pools i s t h e n eCfected i n a s p e c i a l r o u t i n e . A second c a l i b r a t e d choice model t h e n simulates t h e d e c i s i o n s by each of t h e a p p l i c a n t s whether t o e n t e r an arrangement with any of t h e p o t e n t i a l p a r t n e r s with whom t h e y have been p r o v i s i o n a l l y matched. A mutual e v a l u a t i o n
of u t i l i t i e s t h e n determines which arrangements w i l l a c t u a l l y come t o f r u i t i o n .
The microsimulation approach t o t r a n s p o r t modelling involves c o n s i d e r a t i o n of choice o p t i o n s by t h e fundamental a c t o r s w i t h i n t h e system
-
t h e i n d i v i d u a l tripmakers. The approach i s i n h e r e n t l y a t t r a c t i v e but o n l y r e c e n t l y have decreasing computer c o s t s made microsimulation a v i a b l e branch of t r a v e l demand modelling.The choice models were c a l i b r a t e d on t h e b a s i s of a s e r i e s of f i e l d surveys which were designed t o mirror e x a c t l y t h e simulation models
-
respondents were i n v i t e d t o make d e c i s i o n s and t o e v a l u a t e proposals drawn from t h e simulation modelsthemselves. Thus t h e respondents e f f e c t i v e l y became a c t o r s within t h e simulation and t h e i r r e a c t i o n s t o t h e choices a v a i l a b l e t o them were used t o c a l i b r a t e t h e models.
Previous i n v e s t i g a t i o n s of c a r s h a r i n g have concentrated e i t h e r on t h e behavioural and psychological a s p e c t s of t h e mode with l i t t l e attempt t o e s t i m a t e t h e g l o b a l consequences of t h e s e o r have concentrated on t h e probable demand f o r t h e mode with l i t t l e attempt t o consider t h e i n t e r a c t i o n between p o t e n t i a l matchees
.
The microsimulation approach adopted h e r e has s u c c e s s f u l l y combined a c a l i b r a t e d model of demand f o r t h e mode with an a c c u r a t e r e n d i t i o n of t h e supply s i d e
-
t h e matching of i n d i v i d u a l t r i p makers with compatible requirements and, f i n a l l y , a c a l i b r a t e d model of t h e d e c i s i o n whether o r not t o e n t e r an arrangement with a s p e c i f i e d i n d i v i d u a l .THE SIMULATION OF ORGANISED CAR SHARING. I1 THE SIMULATION
MODELS AND T H E I R C A L I B R A T I O N
1. INTRODUCTION
1.1 Aims of t h e pro.iect
The p r o j e c t was conceived during 1976 and submitted t o t h e SRC f o r
g r a n t funding. The submission was then modified i n t h e l i g h t of i n t e r e s t
expressed by t h e TRRL who subsequently undertook t o fund t h e work on a
c o n t r a c t u r a l b a s i s .
The primary o b j e c t i v e of t h e study was t o provide guidance f o r policy
makers contemplating t h e implementation o r modification of c a r sharing
schemes. This guidance t o be i n t h e form of t h e r e l a t i o n s h i p s e s t a b l i s h e d
between performance of schemes, t h e p o l i c y environment i n which t h e y operate
and t h e nature of t h e schemes themselves.
The performance of t h e schemes i s expressed i n terms of t h e i r e f f e c t
on t r a n s p o r t system i n d i c e s including peak period c a r mileage, peak period
public t r a n s p o r t patronage and numbers of c a r s ' l i b e r a t e d ' f o r off-peak use.
The p r o j e c t seeks t o p r e d i c t how t h e performance of schemes would
r e f l e c t t h e i r o p e r a t i o n a l c h a r a c t e r i s t i c s such a s s i z e and l o c a t i o n and
how t h e y would b e a f f e c t e d by economic/financial d e t e r r e n t s and i n c e n t i v e s
o r by t r a f f i c r e s t r a i n t p o l i c i e s . The p r o j e c t concentrates on c a r sharing
schemes f o r peak period work t r i p s .
Several s t u d i e s have addressed themselves t o t h e p o t e n t i a l market
f o r organised work journey c a r sharing ( ~ o m l i n s o n and K e l l e t t 1977, Vincent
and Wood 1979, Cambridge Systematics Inc 1976, Atherton e t a1 1976) but
t h e y have been concerned mainly with t h e p o t e n t i a l and t h e o r e t i c a l impact
of c a r s h a r i n g given p r e s e n t journey-to-work p a t t e r n s and c h a r a c t e r i s t i c s .
They have been a b l e t o c o n t r i b u t e l i t t l e t o t h e e s t i m a t i o n of l i k e l y _ i m ~ a c t
because t h e y could not estimate how many of t h e p o t e n t i a l matches could o r
would be r e a l i s e d . Another l i n e of research has been concerned with
a t t i t u d e s t o c a r s h a r i n g i n an attempt t o understand t h e l i k e l y response a t
t h e micro l e v e l (Margolin e t a1 1976, Dobson and Tischer 1976, Levin e t a 1
1978, Tomlinson and K e l l e t t 1978, Hawker Siddeley Dynamics 1977). This
a t t i t u d i n a l work has provided u s e f u l i n s i g h t i n t o t h e l i k e l y behaviour of
i n d i v i d u a l s but it i s , i n i t s e l f , not r e a d i l y adapted f o r p r e d i c t i v e
It was our aim i n t h i s p r o j e c t t o bridge t h e gap between t h e o r e t i c a l
modelling and a t t i t u d i n a l i n v e s t i g a t i o n by developing a model which, while
being based on t h e a t t i t u d e s and consequential d e c i s i o n s of i n d i v i d u a l s ,
could t a k e i n t o account t h e a v a i l a b i l i t y and c h a r a c t e r i s t i c s of p o t e n t i a l
p a r t n e r s and could t h u s p r e d i c t t h e impact of a c a r s h a r i n g schr11.e a t both
t h e micro and macro l e v e l . The form of model b e s t s u i t e d t o t h i s t a s k i s
microsimulation. The r e s u l t i n g model seeks t o r e p r e s e n t t h e i n t e r a c t i o n s
between i n d i v i d u a l decisionmakers and t h e manner i n which an organised
c a r s h a r i n g scheme would operate.
1 . 2 Microsimulation
Microsimulation i s a technique of computerised modelling w i t h i n which
t h e d e c i s i o n making process i s r e p l i c a t e d f o r i n d i v i d u a l d e c i s i o n makers
within t h e system. These d e c i s i o n makers e f f e c t i v e l y become ' a c t o r s '
w i t h i n t h e modelled system. The model i s driven by llonte Carlo t y p e sampling.
Xonte Carlo simulation h a s , of course, a long and r e s p e c t e d pedigree
p a r t i c u l a r l y i n t h e f i e l d of Operational Research. But it has not been
much a p p l i e d t o t r a v e l demand modelling. Recently, however, Monte Carlo
simulation h a s been used i n t h e t h e o r e t i c a l i n v e s t i g a t i o n of l o g i t and
p r o b i t models (Albright e t a 1 1977, Ortuzar and Williams 1979) and a s t h e
b a s i s of a model r e p o r t e d by K r e i b i t c h (1978). I n h i s model t h e population
i s divided i n t o groups ( ' s i t u a t i o n g r o u p s f ) deemed t o s h a r e a common
' d e c i s i o n p r o f i l e ' . The d e c i s i o n p r o f i l e i s expressed a s a t a b l e of
p r o b a b i l i t i e s of making a p a r t i c u l a r d e c i s i o n and i s a c t i v a t e d using a
random number generator.
The main d i f f e r e n c e between K r e i b i t c h ' s approach and microsimulation
a s presented i n t h i s paper, i s t h a t i n i t s pure form, microsimulation makes
e x p l i c i t
m he
mechanisms of d e c i s i o n making r a t h e r t h a n r e l y i n g on c o r r e l a t i o n .1.3
Microsimulation compared with o t h e r model formsThe development of m i c r o s h u l a t i o n techniques should be seen i n t h e
context of t h e c u r r e n t emphases (Manheim 1979, I6Iilliams 1979) within t r a v e l
demand modelling. A changed emphasis i n planning, away from t h e b l u e p r i n t
plans of t h e post w a r y e a r s and towards t h e incrementalism o f t h e post
o i l c r i s i s , has been matched by i n c r e a s i n g d i s i l l u s i o n with aggregate
planning models and g r e a t e r i n t e r e s t i n disaggregate and b e h a v i o u r a l l y
Much of the work on disaggregate modelling has been concerned with
the development of the logit models and their derivatives. Advantages
quoted (Atherton and Ben-Akiva
1977)
for this type of model when comparedwith aggregate models include greater statistical efficiency, transferability,
behavioural structure and policy sensitivity. Other authorities, however,
dispute that the structure of logit based models is behaviourally valid,
and insist that a radical change in model framework is required if the
behavioural dimension is to be given a place. This thinking has developed
the pioneering work of Hagerstrand
(1976)
into the activity based gamingmodel, 'HATS' (Heggie
1977.
Hsggie and Jones1978).
A problem with theHATS approach has, however, been its computational intractability.
The mathematical expression of conventional planning models (which
for this purpose must include logit and probit models) tend to obscure
any
behavioural basis which they may have. This makes it difficult orimpossible to represent the nuances of behavioural logic within them.
Against this background it will never be possible to develop a truly causal
model. Nor will it be possible to convince the layman-politician that
planning models are anything more than black boxes. The development of
HATS and of microsimulation promises to allow progress on both these fronts.
Microsimulation seems to allow for a combination of some of the
philosophical advantages of the HATS approach with the computational advantages
of more conventional model forms. The main advantages which the HATS approach
and microsimulation have over more conventional model forms are their
detailed representation of the decision making process and their essential
simplicity. These twin advantages make them uniquely suitable vehicles
for testing paradigms of behaviour adnd as aids to policy formulation. The
cmputational intractability of HATS however, restricts its role in
predictive planning and it is here that the value of microsimulation lies.
1.4
Revealed preference or stated intentions?The dangers of basing predictive models on stated intentions are well
known, they stem from the known divergence between what a respondent says
he would do in a given, hypothetical, situation and what he in fact does
if and when that situation arises. This divergence is due to the difficulty
of replicating the environment in which the real decision would be made.
It is important that the respondent should state his intentions in proper
cognisance of the facts and &er the same constraints which would affect
his actual decision. Furthermore he must act as if his very statement of
preference would entail a real commitment
-
if he thinks he can stater e a l i s t i c a s it would be i n r e a l i t y . Arguments of t h i s k i n d , although
r a r e l y a r t i c u l a t e d , have discouraged t h e use of s t a t e d i n t e n t i o n s f o r t h e
c a l i b r a t i o n of p r e d i c t i v e models.
There a r e , however, a number of objections which can be r a i s e d t o t h e
conventional use of revealed preference d a t a . F i r s t l y d a t a a v a i l a b i l i t y
u s u a l l y f o r c e s t h e use of c r o s s - s e c t i o n a l r a t h e r t h a n time-series d a t a ;
t h i s n e c e s s i t a t e s t h e h e r o i c assumption t h a t s p a t i a l and c i r c u m s t a n t i a l
v a r i a t i o n i n behaviour can be used t o p r e d i c t temporal changes. I t means
t h a t models can a t b e s t be c o r r e l a t i v e
-
t h e y can never be c a u s a l .A second drawback of revealed preference d a t a , even i f it be time-
s e r i e s , i s t h a t it i s not r e t r o s p e c t i v e
-
it shows behaviour i n t h e contextof e x i s t i n g circumstances r a t h e r t h a n i n t h e context of t h e circumstances
which p r e v a i l e d when t h e behavioural d e c i s i o n was a c t u a l l y taken.
Environmental f a c t o r s may have caused t h e behaviour t o be adopted but
i n e r t i a l e f f e c t s w i l l almost c e r t a i n l y ensure t h a t t h e behavioural p a t t e r n
o u t l i v e s i t s causes. C o r r e l a t i o n between co-existing behaviour and
environment w i l l r a r e l y r e v e a l c a u s a l i t y and i s t h u s a dubious b a s i s f o r
p r e d i c t i o n .
A lengthy comparison of t h e r e l a t i v e m e r i t s of revealed preference
and s t a t e d i n t e n t i o n d a t a w i l l conclude t h a t they s h a r e t h e same b a s i c
problem
-
an i n a b i l i t y t o c o n s t r u c t t h e environment i n which d e c i s i o n sa r e a c t u a l l y taken.
I n t h e c u r r e n t p r o j e c t we seek t o model a mode choice which does not
y e t e x i s t i n t h e f i e l d
-
oraanised c a r sharing. C l e a r l y we have t o choosebetween two o p t i o n s :
-
a r e v e a l e d preference model vased on observed behaviours which we may assume t o be c o r r e l a t e d with r e a c t i o n t oorganised c a r s h a r i n g ;
-
o r a s t a t e d i n t e n t i o n model based on r e a c t i o n s t o ahypothesised c a r s h a r i n g scheme.
Both of t h e s e o p t i o n s a r e compatible with a microsimulation framework.
I f we chose t h e r e v e a l e d preference option then we would be working a t two
removes from t h e phenomenon rre wish t o model
-
we would be observingbehaviour which we assume t o be c o r r e l a t e d with organised c a r sharing
behaviour but which i t s e l f may have a r i s e n i n circumstances d i f f e r e n t from
circumstances we would be unable t o c a p i t a l i s e on a l l t h e advantages
of microsimulation which were outlined i n previous s e c t i o n s of t h i s paper.
The Monte Carlo simulation model described by K r e i b i t c h w a s based on
revealed preference d a t a and, i n t h e view of t h e present a u t h o r , t h i s
must d e t r a c t from i t s usefulness.
If t h e problems a s s o c i a t e d with using s t a t e d i n t e n t i o n d a t a can be
overcome t h e n i t s combination with microsimulation can prove an a t t r a c t i v e
b a s i s f o r p r e d i c t i v e modelling. It i s t h i s combination which t h e current
model seeks t o achieve.
2. STRUCTURE OF THE MODEL
2 . 1 Introduction
The simulation s u i t e i t s e l f has t h r e e s t a g e s , each r e p r e s e n t i n g a
d i s t i n c t process i n t h e stablishment of an organised c a r sharing scheme.
These t h r e e s t a g e s a r e represented i n Figure 2.X.
The f i r s t s t a g e i s concerned with t h e scope and i n t e n s i t y of t h e
scheme being simulated and t h e decisions by members of t h e public t o be
a s s o c i a t e d with it. The second s t a g e d e a l s with t h e mechanics of attempting
t o match up p o t e n t i a l p a r t n e r s , t h e t h i r d with t h e r e a c t i o n s of t h e
p a r t i c i p a n t s i n t h e scheme t o t h e i r proposed p a r t n e r s . An appendix t o
t h e main model t r a n s l a t e s t h e performance of t h e scheme i n t o i t s e f f e c t
on some c r i t i c a l components of t h e t r a n s p o r t system.
2.2 Synthesis of t h e population base
The microsimulation approach t o modelling r e q u i r e s , as a fundamental
input, a d e s c r i p t i o n of each of t h e a c t o r s i n t h e system of i n t e r e s t . It
i s not p o s s i b l e t o r e p l a c e t h i s l i s t of unique i n d i v i d u a l s with t h e combined
p r o b a b i l i t y matrices which d e f i n e them because of t h e problem of accounting
-
a s each i n d i v i d u a l passes through t h e system records must be kept of h i sprogress. This i s p a r t i c u l a r l y important i n t h e present case because it i s
a fundamental f e a t u r e of carsharing t h a t t h e r e be a b s o l u t e e q u a l i t y between
F i ~ r e 2.1. OUTLIN?3 STRUCTURE .OF SIMOi,ATION SUITE
Unique Description of
P u b l i c i t y f o r
a
given Transnort Syflte~ncar
sharing scheme. ISTAGE
I
STAGE
11
given
I
TO JOIN
A CARSHARING
p o t e n t i a l
ON HOW TO
REACT
TO
PVlXNTIAL
MATCH
1
PARTNERSI
II
not s a t i s f i e d
Thus we r e q u i r e d e s c r i p t i o n s of each of t h e a c t o r s i n t h e system.
I n t h e c u r r e n t case t h i s means a unique d e s c r i p t i o n o f every peak period
work tripmaker i n t h e study a r e a . These d e s c r i p t i o n s have t o d e f i n e t h e
i n d i v i d u a l s i n such d e t a i l t h a t we can estimate t h e i r propensity t o join
a c a r s h a r i n g scheme, t h e i r r e a c t i o n t o proposed matches and t h e i r influence
on t h e t r a n s p o r t system. I n many instances a sample of t h e a c t o r s would
s u f f i c e b u t i n t h e modelling of c a r sharing a complete population i s necessary.
This i s because, f o r c a r sharing, successful arrangements a r e a function
of t h e compatability between i n d i v i d u a l s u p p l i e r s ( l i f t g i v e r s o r p o o l e r s )
and i n d i v i d u a l demanders
(lift
r e c e i v e r s o r p o o l e r s ) ; one of t h e f a c t o r sbearing on t h i s c o m p a t i b i l i t y i s c l e a r l y t h e s p a t i a l r e l a t i o n s h i p between
t h e p o t e n t i a l p a r t n e r s and t h i s i s a function of r e s i d e n t i a l d e n s i t i e s which
can not be s a t i s f a c t o r i l y represented with a sample population.
Had it been p o s s i b l e , t h e use of a sample population would obviously
have reduced t h e computational requirements of t h e model. I n some
circumstances t h e amount o f computation required f o r modelling t h e t o t a l
population by microsimulation would prove p r o h i b i t i v e . I n t h e c a s e of c a r
sharing, however, t h e model can be arranged s e q u e n t i a l l y s o t h a t t h a t p a r t
of t h e population ( t h e m a j o r i t y ) who express no i n t e r e s t i n c a r sharing can
be discarded i n t h e e a r l y s t a g e s of t h e simulation. The more complex
p a r t s of t h e simulation ( s t a g e s I1 and I11 of Figure 2.1) can then proceed
with
a
manageable number of a c t o r s .I d e a l l y , of course, t h e population of a c t o r s would be taken d i r e c t l y
from
a
100% household census. Clearly such censuses a r e r a r e l y a v a i l a b l eand so a second-best s o l u t i o n must be adopted. We d i d have a v a i l a b l e a
sample survey of 9,500 households i n our study a r e a with f i l e s f o r i n d i v i d u a l
t r i p makers. (WYTCONSULT 1976) It would not have been appropriate merely
t o m u l t i p l y t h e sample d a t a by t h e sampling function because t o have done
s o would have produced a population of s e t s of i d e n t i c a l people
-
whosemutual i n t e r a c t i o n s could not be taken as r e p r e s e n t a t i v e o f a t r u e population!
A more s o p h i s t i c a t e d method of s y n t h e s i s was t h e r e f o r e necessary.
A full d e s c r i p t i o n of t h e method of synthesis i s described i n a companion volume of t h e present paper ( ~ o n s a l l and Champernowne 1979).
I n summary, however, t h e method w a s based on t h e use of i n t e r - c h a r a c t e r i s t i c
p r o b a b i l i t i e s revealed i n t h e household survey t o generate i n d i v i d u a l s
Table 2.1 lists the personal characteristics which were synthesised
for each number of our population. They are characteristics which
a
priori
can be expected to influence an individual's propensity to joinand be accepted in a car sharing scheme. Other characteristics would no
doubt be equally important but there would have been no point in our
synthesising characteristics which could not be used in our simulation
-
this ruled out such things as race, education and income for which we
could not expect to achieve reliable attitudinal data for calibration
purposes. Other characteristics had to be ignored because of poor data on
their distribution within the population (eg. smoking habits and political
persuasion)
.
2.3 The definition of the scheme to be tested
2.3.1 The simulation suite accepts parameters which describe the
location and intensity of the car-sharing scheme being simulated. These
parameters comprise a list of residential areas and of work locations to
be included in the scheme and a 'Threshold of interest' below which individuals
are deemed not to participate in the scheme.
By manipulating the list of residential zones and work areas, it is
possible to simulate anything from a county wide scheme to one which
links a single city centre zone to a given suburb. By manipulating the
threshold of interest it is possible to represent publicity campaigns of
varying intensity, from one which results in the participation of all trip
makers in the target area down to one which interests only a minute
proportion of the population. Also by manipulation of the threshold of
interest it is possible to order the list of applicants on the assumption
(uncalibrated) that the keenest applicants apply quickest. By manipulating
the list, of zones in conjunction with the threshold of interest it is
possible to simulate the complex effects of a publicity campaign whose
intensity varies in time as well as space. This may turn out to be an
important element in the organisational strategy of car sharing schemes.
2.4
scheme
2.4.1 This submodel, together with its inputs and outputs, is represented
in Figure 2.2
TABLE2.1CIIARACTERISTICS DEFINED FOR EACH MEMBER OF OUR POPUJATIOII
1) P r e c i s e l o c a t i o n of home ( 6 Figure g r i d - r e f e r e n c e )
2 ) P r e c i s e location of workplace
( 6
Figure g r i d - r e f e r e n c e )3 ) Sex
4 )
Age (under 30, 30 t o 50 o r over 50)5 )
Whether head of household.6 ) Driving l i c e n c e t e n u r e .
7 )
Eaployment c s t e g c r y (Manual/shop f l o o r , t e c h - n i c a l / c l e r i c n l o r p r o f e s s ional/management )8 ) Whether c a r needed a t work ( b u s i n e s s u s e )
9 ) Current mode of t r a v e l t o work ( i e . p r i o r t o i ~ t r o d u c t i o n of c a r s h a r i n g scherne)
P o s s i b l e modes
=
1) Solo c a r d r i v e r2 ) Car d r i v e r with one passenger
3 ) " I, 11 two passengers
ii)
1, 11 8 ,t h r e e o r n o r e passengers 5 ) Car passengers
6 )
Public t r a n s p o r t7 )
Any o t h e r modet h e evening node i s not c o n s t r a i n e d t o equal t h e morning mode t h u s t h e r e a r e 49 p o s s i b l e modal combinations.
1 0 ) Normal time of a r r i v a l a t work.
1 1 ) Normal time of d e p a r t u r e from work.
1 2 ) Number of c a r s a v a i l a b l e i n t h e household.
1 3 ) Number of l i c e n s e d d r i v e r s i n t h e household.
14) Total number of people i n t h e household.
1 5 ) Houshold telephone?
In a d d i t i o n t o t h e s e
1 5
c h a r a c t e r i s t i c s each i n d i v i d u a l i s a l l o c a t e da reference number i n d i c a t i n g which household he i s a member of and
h i s unique i d e n t i t y w i t h i n t h a t household. Each i n 2 i v i d u a l i s a l s o
-
10-
FIGURE 2.2 SnmCRTIiE OF
SIMOLATIONOF APPLICATIONS
/unique description
\
of each tripmaker
within the system
(15 characteristics)
*
I
For each tripmaker:
Given his characteristics
1.
How likely to apply to give liftsmorning
&evening?
2.
" )I 11 II 11 "morning only?
3.
"
II II I* 11 "evening only?
4.
"
11 )I I ) "receive lifts morning
&evening?
5.
"
I I II I, I, I1morning only?
6 .
"
I,,
11 I, I1"
evening only?
1 ,
7.
"
t1"
to pool (alternate driving)?
8."
I t I'allow more than one passenger?
9.
'I 11 $1 I* II"
two passengers?
(likelihoods expressed on a scale 0-15)
/
Calibrated
\
Coefficients
(logit model
parameters
)
.
/'
unique description of each tri~aker
with hie likelihood of applyind
allowing each of the 9
modes
i
DESCRIPTION OF
SCREME (location
.
-/
w d intensity)
unique dascription of each tripmaker
deemed to make an application and
description of the type(s) of
application(s) he would make
-
+1
TOR
EACH
TRI-:
Given his Characteristics:
Is he withir. the target population?
if no, reject him
Given his likelihoods:
Would he apply to a scheme of this intensity?
if no, reject him.
What
type(6) of appldcation(s) would he make?
The model allows a p p l i c a t i o n s f o r up t o seven types of c a r sharing
arrangement :
1. C a r pooling
2. Giving l i f t s morning and evening
3.
Giving l i f t s morning only4.
Giving l i f t s evening only5.
Receivingl i f t s
morning and evening6.
Receiving l i f t s morning only7.
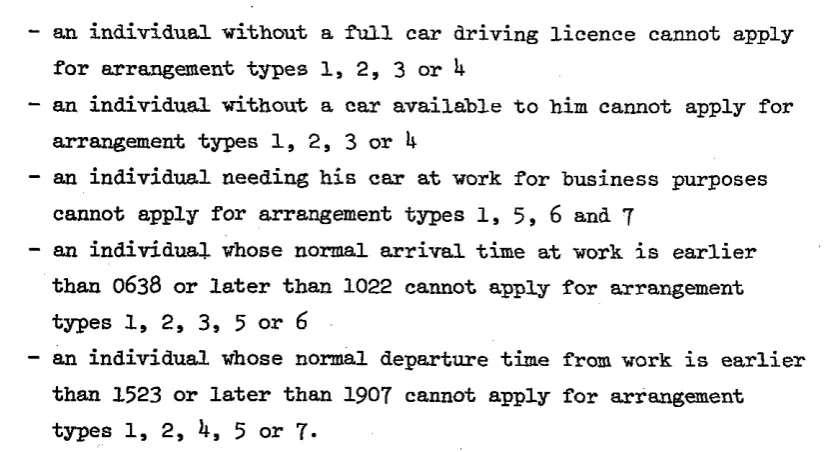
Receiving l i f t s evening only.An i n d i v i d u a l may make an a p p l i c a t i o n t o include any number of t h e s e types
of arrangement s u b j e c t only t o t h e following r e s t r i c t i o n s :
-
an i n d i v i d u a l without a f u l l c a r d r i v i n g l i c e n c e cannot apply f o r arrangement t y p e s 1, 2,3
o r4
-
an i n d i v i d u a l without a c a r a v a i l a b l e t o him cannot apply f o r arrangement types 1, 2 ,3
o r4
-
an i n d i v i d u a l needing h i s c a r at work f o r business purposes cannot apply f o r arrangement types 1,5 ,
6
and7
-
an i n d i v i d u a l whose normal a r r i v a l time a t work i s e a r l i e r than 0638 o r l a t e r t h a n 1022 cannot apply f o r arrangementtypes 1, 2,
3,
5 o r6
-
an i n d i v i d u a l whose normal departure time from work i s e a r l i e r than 1523 o r l a t e r than 1907 cannot apply f o r arrangementtypes 1, 2,
4,
5 o r7.
(These l a s t * two r e s t r i c t i o n s a r e introduced because of t h e high marginal cost
of processing a p p l i c a t i o n s f o r times s o f a r o u t s i d e t h e main peak periods,
t h e r a t h e r p e c u l i a r time bands a r e a result of our d e s i r e t o include t h e
15 most popular q u a r t e r hour periods.
1 5 because
of computational requirements). I n d i v i d u a l s making a p p l i c a t i o n s of types 1, 2, 3 o r4
a r e r e q u i r e d t oi n d i c a t e t h e
maximum
number of passengers t h a t t h e y would want i n t h e i r car.2.4.2 The l i k e l i h o o d of
a
t r i p a k e r making any of t h e seven types ofa p p l i c a t i o n mentioned above i s deemed t o be a f u n c t i o n of c e r t a i n of t h a t
tripmaker's c h a r a c t e r i s t i c s . m e r e l e v a n t c h a r a c t e r i s t i c s a r e l i s t e d i n
Table 2.2.
I n o r d e r t o e s t a b l i s h t h e importance of t h e s e c h a r a c t e r i s t i c s a
s e r i e s of b i n a r y l o g i t models were c a l i b r a t e d . We recognise t h a t t h i s i s
a
d e p a r t u r e from our d e s i r e t o make e x p l i c i t t h e mechanism of all choices [image:16.613.96.515.271.497.2]TABLE 2.2 DETERMINANTS OF APPLICATION
0.
A
dummy (always set to 1)1. The leneth of the individual's journey to work.
2. 1 if individual's normal mode of travel to work is solo driver, otherwise 0.
3. 1 if individual's normal mode of travel to work is accompanied driver, otherwise 0.
4.
1 if individual's normal mode of travel to work is private transport passenger, otherwise 0.5.
1 if individual's normal mode of travel to work is public transport, otherwise 0.6 .
1 if individual's normal mode of travel from work is solo driver, otherwise 0.7 .
1 if individual's normal. Inode of travel from work is accompanied driver, otherwise 0.8. 1 if individual's normal mode of travel from work is private transport passenger otherwise 0.
9.
1 if individual's normal mode of travel from work is public transport, otherwise 0.10. 1 if individual is under 30 years of age, otheriise 0.
11. 1 if individunl is ovcr
50
years of age,otherwise
0.12. The number of cars available to the household and not needed for business use.
13. 1 if individual has a full car driving licence, otherwise 0.
1 if individual is a factory or manual worker, otherwise 0.
1 if individual is a professional or managerial worker otherwise 0.
1
if individual is female, otherwise 0.Number of licensed persons in the individual's household.
Number of unlicenoed persons in the individual's household.
1
if individual's journey to work is between 0638 and 1022, otherwise 0.1 if individual's journey from work is between 1523 and
1907
otherwise 0.of time and resources. The models were regression transformations
of the standard logit model. They can be expressed as:
where
P
is the probability of making an applicationx is the value of the ith characteristic of the individual i
being considered
a is the calibrated coefficient. i
The calibration process is described in section 3.2
Application of this logit model for each individual in the population
produces, for him, a probability of applying to join a car sharing scheme.
This probability is then compared with a random number drawn from a
rectangular distribution between 0 and 1.
-
the ratio of the probabilityto the random number is then deemed to be the 'likelihood' of that
individual making an application (it is this likelihood upon which the
'threshold of interest' described in section 2.3.1 operates).
2.5 The processing of applications
2.5.1 This submodel is shown in Figure 2.3. It is a direct representation
of the matching process which is fundamental to organised car sharing schemes.
A matching system will accept a file of applicants, and will produce,
for each applicant, a list of people whose journey to work characteristics
and expressed interest in car sharing make them, prima facie, viable
travelling companions. In practice this matching process may be manual,
using pigeon holes or pins on a map, or computerised (several packages
exist in the USA). (See for example USDOT
1974).
The simulation model perhaps bears a closer resemblance to computerised
matching because its search routine is based on co-ordinate geometry rather
than on a detailed road network." The simulation suite was, however,
F i m 2.3 TAE mtOFESSING OF APPLICATIONS
File of Applicants
(giving for each applicant details of typc(s) of application(s) mode, location of home.
cation of work, hours of work
Parameters :
.
Size of batch to be processed.
(lkdmum number of partners per list).
Size of t h e window (latitude in work hours).
Spatial search algori-thmL
1
For each applicant
.
search applicants file for potential partners who have compatible honeand work locaticne snd work horns
.
create a list of the best partners(where best = minimum diversion from driver's ehorteet route to work)
designed i n such a way t h a t t h e processing of a p p l i c a t i o n s could be done
manually by bypassing t h e computerised matching r o u t i n e . It w i l l be
i n t e r e s t i n g t o examine how d i f f e r e n t t h e model r e s u l t s a r e u s i n g such manual
i n t e r v e n t i o n compared t o t h e computerised method.
2.5.2 Within t h e simulation s u i t e a matching algorithm has been
programmed t o process a batch of a p p l i c a n t s ( i e . i n d i v i d u a l s who made
an a p p l i c a t i o n t o j o i n t h e scheme a t s t a g e 1 of t h e model) producing, f o r
each a c t i v e a p p l i c a n t , a l i s t o f p o t e n t i a l p a r t n e r s whose work hours a r e
comparable with h i s own, whose-trip ends a r e c l o s e t o h i s own and who have
made a p p l i c a t i o n s f o r modes of c a r s h a r i n g which a r e compatable with
those of t h e a p p l i c a n t . The algorithm accepts parameters t o c o n t r o l t h e
following a s p e c t s of t h e simulated matching process:
The s i z e of batch of a p p l i c a n t s t o be processed at one time
( a l a r g e r batch i s more expensive and time consuming but
w i l l r e s u l t i n more s u c c e s s f u l matches).
2. The rigorousness of t h e c o n s t r a i n t s on compatability of work hours. (Varies from i n s i s t a n c e t h a t both p a r t i e s ' work
hours be w i t h i n t h e same 1 5 minute band t o t o t a l r e l a x a t i o n
of t h e time c o n s t r a i n t ) .
?. The number of p o t e n t i a l p a r t n e r s t o be included on each
a p p l i c a n t ' s l i s t .
4.
The n a t u r e o f t h e search r o u t i n e used t o c r e a t e t h e l i s tof p o t e n t i a l p a r t n e r s .
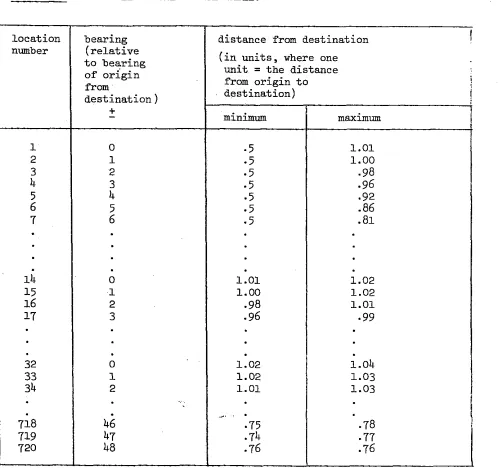
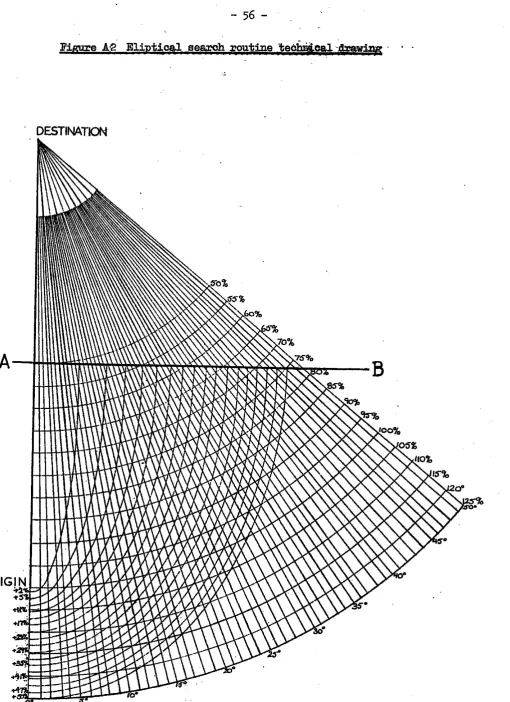
The f o u r t h parameter i s t h e most complex, it d e f i n e s t h e s p a t i a l search
algorithm t o be used i n t h e matching process. Two a l t e r n a t i v e s p a t i a l search
algorithms have been programed f o r i n c l u s i o n i n t h i s model. The f i r s t i s
a h i g h l y e f f i c i e n t (and unique!) r o u t i n e which assumes t h a t one end o f t h e
t r i p i s common t o a l l a p p l i c a n t s ( a s w i l l be t h e c a s e i n employer-based
schemes); it i s based on an ordered search i n c o n c e n t r i c e l i p s e s . The
second method i s somewhat more expensive c a a p u t a t i o n a l l y b u t allows f o r
v a r i a t i o n a t both ends o f t h e t r i p ( a s would be t h e case i n area-wide
2.6 The simulation of the decision to match
2.6.1 This part of the simulation suite is the most ambitious and is
closest to the ideal of microsimulation.
It
represents the consideration,by each applicant, of the list of potential travelling companions sent to
him by the car sharing scheme organisers. This consideration is assumed
to involve an evaluation by the applicant of the net expected utility associated
with each possible arrangement presented by his list of potential partners.
This evaluation is made on the basis of the known and expected characteristics
of the arrangement postulated. If an arrangement has a positive net
expected utility to all participants within it and has a higher utility than
any other arrangement to at least one of them then it is deemed a successful
car sharing arrangement.
The model is thus based on utility maximisation with a satisficing
constraint. The utility to a given person
P
of a given arrangementA
isa function of personal characteristics of the person
P,
of the personalcharacteristics of his partners in arrangement
A
and ofthe operationalconsequences of the arrangement (delays, diversions etc) on the participants.
These utilities can be represented as
"AP
=
Z Z a p n m n m x + enP
+
feepaid.
n=l m=lwhere
U
AP
is the utility of the arrangementA
to personP
al.. .a are characteristics of the arrangement
A
(see Table 2.3a) npl.. .pm axe characteristics of the perFon
P
(see Table 2.3b)X
11. eXnm are components of utility associated with
any
person with characteristic m engaging in an arrangement withcharacteristic n
e....e are stochastic elements associated with the utility to person
P
1 nP
of an arrangement with characteristic n.
feepaid is the net sum of money, if any, passing to this person
in respect of his participation in the scheme.
The calibration of the components x was on the basis of a series of -.
regression equations using data from a special field survey (see Bonsall 1979a).
It is described in section 3.3 of this paper. The calibration procedure
(u) C ~ L ~ ~ - Y C ~ F F ~ : ~ I . ~ C ~ ; or th.. U T I . ~ ~ I R L ~ P ~ ~ (Y,, i n cij~lrltinn ?.:?)
Y m u lmssmecl.'s i ~ i a t 0,' view: 1. rtutldurd m'l'ntlCsiltoll 2. vlxethrr t h e clriver i s f m n l c
3. nmkber or minuies e w l i e l . than ~>rovioualy that thc nrr.ntlp,nnrst w i l l rcquir.e pnrsen,?cr!% t o ;.ct o u t I . rnrmber or rninvtcr 1 n i . e ~ thnn pl.cviaunly t h a t the orrttnrjcment, will rc.qitire panneepcrs t o al.rivu llnnc 5. vlletller t h c driver hnr n telellhone a t llme
6. nmbcr o r ~ u i l c a ~ C ~ V C C ~ tllc d r i v e r ' s vorkplncr and t h a t or the paasencer - I . nvlnber o r miles between t h e driver's hane nnd t h a t or tile pnrsencer
8. whether t h e d r i v r r i a over 50 years o r a&.
From n d r i v e r ' s point or view: 9. s t a n b r a nrmngm""t
10. whethec t h e piuscngcr is f d e
11. amber of minutes e a r l i e r thnn pmvi-ly t h a t the arrongment v i l l require drivers t o s e t nut 12. number o r minotes l n t c r than previously thnt thc arrangement v i l l req,tire drivers t o orrive hone 13. whether t h e passenger bas a tclephonc n t h w e
14. nmber o r miles between the passenger's vorliplecc and tliat of the driver 15. number o r miles between t h e pnrscnger's hme hnd t h a t o r the driver 16. whether t h e pcsaenscr i s over 50 years of age
17. extra mileage incurred due t o diversions
18. vhcthcr t h i n i s not t h e driver's f i r s t passenger.
Rm a poa1er.s point o r vieu: 19. standard arrangement
21. whether t h e pnrtner i n remalo
2l. nmber o r minutes e a r l i e r tinst tlre srrongment v i l l require partieipa?ts t o s e t out (when t h e y are p s s e n g c r s ) 22. number or minutes l a t e r t h a t t h e %rangwent v i l l require participlr!ts t o arrive hime (vhcn they are passengers)
.. ..
23. -&her o r ninutea eel-lier that' t h e nrrangment v i l l require paYticipnnts t o s e t out (when they'are drivers) 24. number of mi~zutes la t e r t h n t the mangement rill require participants t o arri-lc ha-e (when t h e y arc drivers1 25. vllether t h e partner has a telephone a t home
26. nm-r o r miles between vorkplsces of p l e r and psrtner
27. nmbebe of miles tetueen t h e hooes o r poolm and partner 28. vhether t h e partner i s over 50 years o r age
29. e x t r a mileage incurred due t o diversion= 30. whether t h i s is not t h e p w l e r ' s f i r s t partner. (b) ChmacteriEties ot t h e individual ($ i n equation 2.2)
1. standard person
2. whether remale
3. vhether has a home telephone
4. vhethcr under 30 years of age 5. whether over 50 years or age
6. ullethcr a m o w 1 worker
1. whether a professional worker
8. .distance t o work
9. whether previously Cave scmleonr o lie t o v s ~ k lo. whether previously a n m driver to rork
We use t h i s e r r o r term t o r e c r e a t e t h e s t o c h a s t i c element of i n d i v i d u a l
d e c i s i o n s . This i s done by random sampling from a normal d i s t r i b u t i o n with
mean zero and standard d e v i a t i o n equal t o t h e standard e r r o r of t h e r e s i d u a l .
2.6.2 Within t h e simulation model each individual w i l l consider t h e u t i l i t y t o himself of a c a r sharing arrangement with each of t h e persons
on h i s match l i s t (which was prepared f o r him from among h i s f e l l o w
a p p l i c a n t s during s t a g e two of t h e model).
The model maximises u t i l i t y f o r i n d i v i d u a l s r a t h e r t h a n f o r t h e system
a s a whole ( t h i s i s fundmuental t o microsimulation). A system optimum could
e x i s t only if a l l decisions could be made simultaneously and i n p e r f e c t
knowledge of a l l o t h e r decisions. Such a circumstance i s a s impossible
computationally a s it i s i n r e a l i t y . An optimum might be approached by means
of an expensive i t e r a t i v e r o u t i n e b u t such a r o u t i n e i s not j u s t i f i e d given
t h a t we seek t o m i r r o r r e a l i t y . Since we do not seek t h i s u n r e a l i s t i c system
optimum, t h e end s t a t e reached i n t h e model ( a s i n r e a l i t y ) w i l l be a function
of t h e order i n which bargains a r e s t r u c k . (Once person A has f i r m l y
contracted t o t r a v e l with person B they a r e both of them e f f e c t i v e l y out of
t h e market). I n t h e absence of d a t a on t h e complex question of t h e order
i n which bargains a r e l i k e l y t o be s t r u c k we must assume t h a t t h e order w i l l
be random. The s e n s i t i v i t y of model r e s u l t s t o t h i s assumption w i l l be
t e s t e d ( s e e Bonsall and Kirby 1979).
2 . 6 . 3
It i s not known p r e c i s e l y how an individual w i l l make h i s d e c i s i o non how t o r e a c t t o
a
l i s t of p o s s i b l e c a r sharing p a r t n e r s nor i sit
a t a l ll i k e l y t h a t everyone would make t h e i r d e c i s i o n i n t h e same way. For t h e
purposes of t h i s simulation, however, a s i n g l e decision making algorithm had
t o be adopted. This algorithm was constrained t o be computationally
p o s s i b l e b u t w a s designed t o be i n t u i t i v e l y reasonable. Several algorithms
have been programmed i n t h e p r o j e c t t o r e p l i c a t e t h e d e c i s i o n t o match;
t h e p r e f e r r e d v e r s i o n
i s
presented here as Figure 2.4. The important pointst o note about t h i s algorithm a r e :
a. We assume t h a t a p p l i c a n t s w i l l consider a l l possible p a r t n e r s
and combinations of p a r t n e r s w i t h i n a l l p o s s i b l e t y p e s of
arrangement o r combinations of arrangement. This c o n s i d e r a t i o n
may however be an almost immediate r e j e c t i o n on t h e grounds
t h a t ( s a y ) he i s not i n t e r e s t e d i n carrying t h a t many passengers o r he does not want t o s e t off t h a t e a r l y i n t h e morning.
b. I f an arrangement has a Get u t i l i t y t o any of i t s p a r t i c i p a n t s
o f 6 o t h e n t h a t arrangement w i l l not come t o f r u i t i o n ( t h i s i s equivalent t o t h e assumption t h a t t h e u t i l i t y of t h e s t a t u s quo
FIGWLE
2-b
TIE IIECISION TO EL4TCH AWORITIIMI
-.
c For each applicant TlnN
I
1
(-DO
Far all partners on his list:
Calculate and store the applicant's reaction to the partner's personal choractericties
Calculate nnd store the partner's reaation to the applicant's personal characteristics
I
For all the paolers on the list:Calculate and storc their reactions to each others persolla1 characteristics
1
~p -
Par all arrangement t~pes and combination of arrangement types (Pooling.lifts morning and evening, lifts morning only,
lifts evenings only) :
Calculate any fee payable to the driver to the applicant?
NO
.
all participants?For all such arrangements:
c . We assume t h a t o p t i n i s a t i o n w i l l be from t h e p o i n t of view
of t h e d r i v e r r a t h e r than t h e passenger ( i e . t h e d r i v e r chooses
t h e most a t t r a c t i v e passenger(s) on h i s l i s t r a t h e r t h a n
passengers choosing t h e most a t t r a c t i v e d r i v e r on t h e i r l i s t s ) .
This
i s
done f o r computational reasons but can be defendedon t h e grounds t h a t car-sharing i s a s e l l e r s ' ( d r i v e r s ' ) market
d. The algorithm w i l l c a l c u l a t e any f e e s payable by passengers
t o t h e i r d r i v e r s on t h e b a s i s e i t h e r of a f i x e d f e e per mile
o r of an o f f e r by t h e passenger on t h e b a s i s of h i s u t i l i t y
( t h i s may be s u b j e c t t o a maximum r a t e per m i l e i n l i n e with
insurance company r e g u l a t i o n s ) .
2.7
The f a i l u r e of matches t o surviveThe decision t o match i s based on t h e expected u t i l i t i e s of t h e
arrangements i n question. I n p r a t i c e , however, t h e s e u t i l i t i e s may be
r e v i s e d a f t e r t h e arrangement has been i n operation f o r a week o r so. The
revised u t i l i t y may be smaller than t h e o r i g i n a l u t i l i t y ; where it i s
s o much smaller as t o be negative, we may assume t h a t t h e arrangement would
f a i l t o survive. The process by which t h e s e revised u t i l i t i e s a r e c a l c u l a t e d
would be s i m i l a r t o t h a t f o r t h e decision t o match but would include more
accurate estimates of t h e operational consequences of t h e arrangement and
more i n t r i c a t e evaluations of t h e personal c h a r a c t e r i s t i c s of t h e p a r t n e r s .
Data was not a v a i l a b l e f o r t h e c a l i b r a t i o n of t h i s model and it has
consequently n o t been implemented i n t h e c a r sharing microsimulation s u i t e .
Without it we a r e e f f e c t i v e l y simulating t h e establishment r a t h e r t h a n t h e
s u r v i v a l of c a r sharing arrangements. A s an uncalibrated proxy f a r t h e
s u r v i v a l c a l c u l a t i o n it i s proposed t o use a bandom number generator i n
conjunction with t h e u t i l i t i e s t o a l l p a r t i e s t h a t were c a l c u l a t e d at
t h e time of t h e decision t o match. This program would t h e n accept ' t h r e s h o l d s '
t o determine t h e l e v e l a t which arrangements a r e deemed t o survive, t o be
modified o r t o be terminated. I n such a model t h e 'death r a t e ' of
arrangements would be determined exogenously.
2.8 System performance i n d i c a t o r s
2.8.1 It w i l l be r e c a l l e d from t h e introduction t o t h i s paper t h a t t h e
model was t o h e l p planners and policymakers considering t h e implementation of organised c a r sharing schemes. I n order t o do t h i s it i s necessary t o
i n d i c a t e how a given scheme would pkrform and, i n p a r t i c u l a r , what e f f e c t
-
21-
TABLE 2.4 IMPORTANT MODEL OUTPUTS
*
a l s o displayed on a map.Type
PROFILE. OF
AND
PARTICIPANTS I N
EACH
TYPE OF ARRANGEMENT
OPERATIONAL PERFORMANCE OF THE SCHEME
SYSTEM EFFECTS
I n d i c a t o r
Location of homes and workplaces*
Length of journey t o work
Previous mode of t r a v e l t o work
Sex, age and employment s t a t u s
Household background (including c a r s owned, number of d r i v e r s , number of members and
telephone ownership)
Perceived u t i l i t y of arrangements
Fees changing hands
Diversions and delays accepted
Number of a p p l i c a n t s f o r each type of arrangement
Number of a p p l i c a n t s given a match l i s t
Number of arrangements i n i t i a t e d
Computational c o s t of matching program
Work journey public t r a n s p o r t patronage nwnbers of passengers l o s t
passenger kilometres l o s t
P r i v a t e v e h i c l e usage:
kilometres saved
kilometres driven w i t h i n c a r s h a r i n g arrangements*
n e t saving i n kilometres driven
change i n c a r occupancies
v e h i c l e s ' l i b e r a t e d ' f o r p o s s i b l e off-peak usage
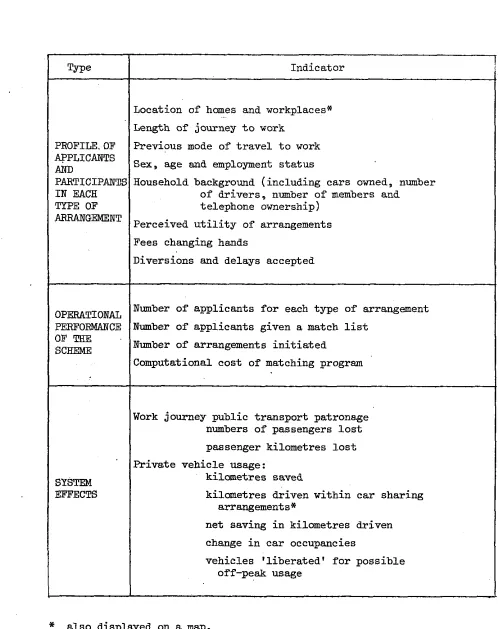
[image:26.605.54.552.121.750.2]This information i s provided v i a an a n a l y s i s package i n t o which model
p r e d i c t i o n s a r e fed. The package provides f o r a range of performance
i n d i c a t o r s including g r a p h i c a l d i s p l a y . The main i n d i c a t o r s a r e l i s t e d
i n Table 2.4. The a n a l y s i s package produces values and 90% confidence
i n t e r v a l s f o r each i n d i c a t o r .
The p r o f i l e s of a p p l i c a n t s and p a r t i c i p a n t s w i l l be of use t o policy
makers wishing t o consider t h e d i s t r i b u t i o n a l e f f e c t s of a c a r s h a r i n g
p o l i c y . A d e s c r i p t i o n of o p e r a t i o n a l performance of t h e scheme w i l l
obviously be of p a r t i c u l a r i n t e r e s t t o t h e organisers and managers of schemes.
The most important i n d i c a t o r s , however, &d t h e ones of g r e a t e s t general
i n t e r e s t , w i l l be t h o s e which describe t h e e f f e c t s t h a t t h e scheme would
have on t h e t r a n s p o r t system a s a whole.
2.8.2 From f i g u r e 2.1 it w i l l be apparent t h a t t h e r e i s p r o v i s i o n within
t h e model package f o r t h e e f f e c t s of t h e c a r sharing scheme t o be fed
back i n t o t h e t r a n s p o r t system d e s c r i p t i o n f i l e . This allows t h e c a r
s h a r i n g scheme t o become i t e r a t i v e . The p o s s i b l e e f f e c t of a scheme on
congestion l e v e l s and ( v i a patronage l e v e l s ) on public t r a n s p o r t s e r v i c e
p r o v i s i o n and performance, can t h u s be allowed t o influence modal choices
and decisions t o apply t o t h e c a r sharing scheme i n t h e next time period.
This feed-back loop i s p r e s e n t l y designed only t o include mode choice
d e c i s i o n s ( d e s t i n a t i o n / o r i g i n decisions being regarded a s longer term
phenomena). It must be s t r e s s e d t h a t t h e s e feed-back e f f e c t s a r e purely
s p e c u l a t i v e and should n o t be seen as an i n t e g r a l p a r t of t h e model design.
3. CALIBRATION OF TIIE DECISION MODELS
3.1
I n t r o d u c t i o nThe d i s c u s s i o n i n s e c t i o n
1 . 4
explained our d e c i s i o n t o c a l i b r a t eon s t a t e d i n t e n t i o n s r a t h e r than on revealed. preferences. The method
by which we gathered t h e s t a t e d i n t e n t i o n s d a t a i s q u i t e unique and was
developed i n o r d e r t h e t h e respondents might give a s ' a c c u r a t e ' r e p l i e s
a s p o s s i b l e and t h a t t h e d a t a be i n a form r e a d i l y input t o t h e microsimulation
models.
The c a l i b r a t i o n process involved s p e c i a l surveys w i t h i n our study
a r e a (Bonsall 1979a). These surveys e f f e c t i v e l y t r e a t e d t h e respondents
as a c t o r s w i t h i n a ' f i e l d simulation' running p a r a l l e l t o t h e microsimulation
model i t s e l f . The respondents were iliirrted t o r e a c t t o p r e c i s e l y t h e same
range of o p t i o n s and were given e x a c t l y t h e same information a s were our
A sample population were i n v i t e d t o r e a c t t o t h e p r o p o s i t i o n t h a t
they should j o i n an organised c a r sharing scheme and t h o s e respondents who
reacted p o s i t i v e l y were then asked t o express t h e i r r e a c t i o n t o a s e r i e s
of p o t e n t i a l p a r t n e r s ; t h i s r e a c t i o n t o be i n terms of t h e amount of money
t h a t t h e y would r e q u i r e i n compensation, o r would b e prepare4 t o pay as a
p r i c e , f o r p a r t i c i p a t i o n i n t h e arrangement a s proposed.
3.2 C a l i b r a t i o n of t h e decision t o .join a given c a r sharing scheme
3.2.1 The f i r s t element of t h e survey involved t h e d i s t r i b u t i o n t o -
10,000 randcanly s e l e c t e d households of p u b l i c i t y m a t e r i a l
similar
t o t h a twhich would accompany t h e establishment of an a c t u a l c a r sharing scheme.
This p u b l i c i t y m a t e r i a l i n v i t e d t h e public t o i n d i c a t e whether they
would l i k e t o make use of a c a r sharing information system and, if so,
what t y p e ( s ) o f c a r s h a r i n g arrangement would t h e y be i n t e r e s t e d i n .
Questions were a l s o asked of t h e i n d i v i d u a l i n r e s p e c t of h i s home and work
l o c a t i o n s and work hours
-
t h i s information being r e q u i r e d i n t h e matchingprocess. We took a p o s i t i v e r e a c t i o n t o t h i s p u b l i c i t y m a t e r i a l t o be
i n d i c a t i v e of l i k e l i h o o d t o make an a p p l i c a t i o n t o an a c t u a l c a r sharing
scheme.
Using t h e r e s u l t s of t h i s survey we were a b l e t o c r e a t e two d a t a
s e t s ; t h e f i r s t containing descriptions* of t h e respondents deemed t o
have made a p p l i c a t i o n s and d e t a i l s o f t h e t y p e ( s ) of a p p l i c a t i o n s t h a t
t h e y made ( d a t a s e t A). The second d a t a s e t contained a synthesised
sample of i n d i v i d u a l s
from
10,000 households on t h e b a s i s of t h e knownc h a r a c t e r i s t i c s of t h e o r i g i n a l sample ( d a t a
set
B ) . (For method ofs y n t h e s i s s e e Bonsall and Champernme 1979).
3.2.2 For each t y p e of a p p l i a t i o n ( s h m i n Figure 2.2)a b i n a r y l o g i t
model of t h e form shown i n equation 3.1 was evaluated t o give values of
ai t h a t would, f r o m t h e synthesised sample population on d a t a s e t B imply
t h e same expected number of a p p l i c a n t s and t h e same expected average
values of c h a r a c t e r i s t i c s of t h e a p p l i c a n t s as were observed i n t h e
survey ( i e . i n d a t a s e t A ) .
*
questions had been asked a s t o t h e i r previous mode of t r a n s p o r tThis process may be w r i t t e n a s :
C a . s . . i = O 1 13
Sij e
Oi = population
22 E
C. j
j=1 Z a . s . 1 i j
+ .i=O
where S . . i s t h e value of t h e i t h c h a r a c t e r i s t i c of t h e j t h 1J
synthesised person ( r e l e v a n t c h a r a c t e r i s t i c s were
l i s t e d i n t a b l e 2.2)
E
j i s 1 i f t h a t person i s e l i g i b l e t o apply (otherwise 0 ) 0.
1 i s t h e t o t a l of c h a r a c t e r i s t i c x. over a l l applicants 1
a .
1 i s t h e c a l i b r a t e d c o e f f i c i e n t .
The equation a c t u a l l y solved i s
C a i s i j i = O S . . e
1.1
0. = population
21 E .
+
a . = P i ( s w )....
( 3 . 2 ) 1Z J 1
j =1 C a . s . .
+ .i=O 1 1J
This modification ( t h e a d d i t i o n of t h e a. term) i s made t o avoid
1
api
p o s s i b l e s i n g u l a r i t y i n t h e matrix of d e r i v a t i v e s
-
.
I n a d d i t i o n t o , aa.1
t h e 2 1 c h a r a c t e r i s t i f f i l i s t e d i n t a b l e 2.2 each i n d i v i d u a l has a dummy
c h a r a c t e r i s t i c always s e t t o u n i t y which a c t s a s a 'balancing f a c t o r '
i n t h e c a l i b r a t i o n .
The parameters a . a r e c a l i b r a t e d by solving t h e equations Oi
=
P.1 1
using Newton Raphson i t e r a t i o n t o a maximum l i k e l i h o o d s o l u t i o n .
3.2.3 A s was i n d i c a t e d i n s e c t i o n 2.3.1, a p p l i c a n t s applying f o r
one of t h e a c t i v e modes ( i n c l u d i n g sane d r i v i n g ) a r e r e q u i r e d t o i n d i c a t e
t h e maximum number of passengers they would want i n t h e i r c a r . This
wish i s represented i n t h e simulation model on t h e b a s i s of two c o e f f i c i e n t s
c a l i b r a t e d on t h e survey d a t a i n much t h e same manner a s w a s done f o r