This is a repository copy of
Lateral phase separation in mixtures of lipids and cholesterol
.
White Rose Research Online URL for this paper:
http://eprints.whiterose.ac.uk/1956/
Article:
Komura, S., Shirotori, H., Olmsted, P.D. et al. (1 more author) (2004) Lateral phase
separation in mixtures of lipids and cholesterol. Europhysics Letters, 67 (2). pp. 321-327.
ISSN 1286-4854
https://doi.org/10.1209/epl/i2004-10057-1
eprints@whiterose.ac.uk https://eprints.whiterose.ac.uk/ Reuse
See Attached
Takedown
If you consider content in White Rose Research Online to be in breach of UK law, please notify us by
Europhys. Lett., (2), pp. 321–327 (2004)
DOI:10.1209/epl/i2004-10057-1
Lateral phase separation in mixtures of lipids
and cholesterol
S. Komura1(∗), H. Shirotori1, P. D. Olmsted2 and D. Andelman3 1
Department of Chemistry, Faculty of Science, Tokyo Metropolitan University Tokyo 192-0397, Japan
2 School of Physics and Astronomy, University of Leeds - Leeds LS2 9JT, UK 3 School of Physics and Astronomy, Raymond and Beverly Sackler Faculty
of Exact Sciences, Tel Aviv University - Ramat Aviv 69978, Tel Aviv, Israel
(received 10 February 2004; accepted in final form 5 May 2004)
PACS.87.16.Dg – Membranes, bilayers, and vesicles. PACS.64.70.Ja – Liquid-liquid transitions.
PACS.64.75.+g – Solubility, segregation, and mixing; phase separation.
Abstract. – In an effort to understand “rafts” in biological membranes, we propose phe-nomenological models for saturated and unsaturated lipid mixtures, and lipid-cholesterol mix-tures. We consider simple couplings between the local composition and internal membrane structure, and their influence on transitions between liquid and gel membrane phases. As-sumingthat the gel transition temperature of the saturated lipid is shifted by the presence of the unsaturated lipid, and that cholesterol acts as an external field on the chain melting transition, a variety of phase diagrams are obtained. The phase diagrams for binary mix-tures of saturated/unsaturated lipids and lipid/cholesterol are in semi-quantitative agreement with the experiments. Our results also apply to regions in the ternary phase diagram of lipid/lipid/cholesterol systems.
Introduction. – Biological membranes typically contain various components such as lipid mixtures, sterols, and proteins that are indispensable to cell functions [1]. Rather than being uniformly distributed in the membrane, there is growing evidence that some intra-membrane components are incorporated in domains arising from lateral lipid segregation in membranes. This phenomenon has attracted great interest in the context of “rafts” [2], i.e., liquid do-mains rich in cholesterol, saturated lipids (typically sphingomyelin lipids), and in some cases particular proteins [3]. Moreover, cholesterol-rich domains have been directly observed in model membranes composed of lipid mixtures and cholesterol, using advanced fluorescence microscopy [4–10].
Prior to the notion of “rafts” in biological membranes, the role of cholesterol was inves-tigated in binary lipid-cholesterol membranes [11–13], where phase separation was observed using NMR and calorimetry [14,15]. Lipid membranes undergo a freezing or gel-like transition, in which the hydrocarbon tails order. Addition of cholesterol has several effects. It suppresses the gel transition below physiologically relevant temperatures, and can lead to coexistence of two liquid phases with very different orientational order. It is now believed that model
(∗) E-mail:komura@comp.metro-u.ac.jp
c
322 EUROPHYSICS LETTERS
membranes containing two phospholipids (saturated and unsaturated) and cholesterol [4–10] exhibit “rafts” which are liquid-ordered (Lo) domains, coexisting with a surrounding
back-ground in aliquid-disordered (Ld) state [3].
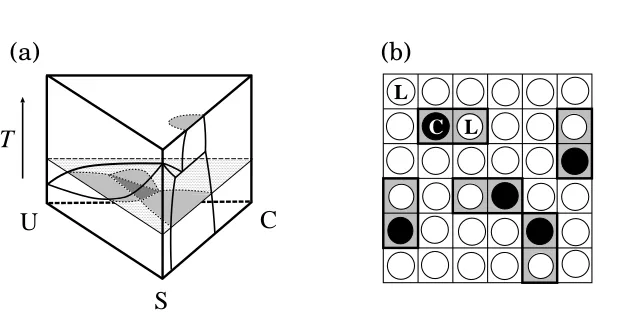
From a physical viewpoint, a strategy for understanding the basic structure of “rafts” in biological membranes is as follows [16]. First, it is necessary to have a simple model for binary mixtures of saturated and unsaturated lipids. Second, a minimal model describing binary lipid-cholesterol systems is required in order to understand the effects of lipid-cholesterol on membrane phase behavior. Finally, these two viewpoints could be combined to fully investigate three-component systems. Here we focus on the first two steps, and propose simple phenomeno-logical models for lipid-lipid and lipid-cholesterol binary mixtures. Such an approach is quite useful since we can predict, at least qualitatively, the complex phase behavior (shown,e.g., in fig. 2(a) below) of the ternary lipid-lipid-cholesterol system from the three binary sub-systems. It is generally believed that the gel phase transition is driven by the freezing of lateral motion as well as conformational ordering of lipids. However, because these two degrees of freedom are strongly coupled, the gel phase transition occurs at a single temperature for pure lipid systems. One of our major assumptions is that the membrane state, even for lipid mixtures, can be described by one internal degree of freedom, coupled to the lateral phase separation. Our main result is phase diagrams for two-component systems, which reproduce experimental ones, without specifying the detailed microscopic state of the lipids. Moreover, we shed light on recent phase diagrams obtained for ternary mixture [8, 9].
Model for saturated-unsaturated lipids systems. – If different lipids exhibit only a small difference in their gel transition temperature, their phase diagram in terms of temperature-composition parameters will include a “cigar-like” shape of liquid-gel coexistence (as in fig. 1(a)). As the gel transition temperature difference between the two lipids is increased, a gel-gel coexistence region appears below the liquid-gel coexistence. At even larger difference, the phase diagram becomes more complex as the two coexistence regions partially overlap [17].
0 0.2 0.4 0.6 0.8 1 x
280 300 320
T
[K]
D
D+O
O1
O1+O2
O2 (a)
0 0.2 0.4 0.6 0.8 1 x
280 300 320
T
[K]
D1+D2
D1+O2
O1+O2
Tr Tr
O1 O2
D1 D2
[image:3.516.38.405.440.585.2](b)
Fig. 1 – Calculated phase diagrams of binary mixtures of saturated and unsaturated lipids as a function of mole fraction of the saturated lipidxand temperatureT for (a)J= 4.0kBT∗
s, and (b)J= 5.0kBTs∗.
The other parameters are a′
2 = 174kB,a3 =−307kBTs∗,a4 = 613kBTs∗, Tu∗= 240 K, Ts∗ = 260 K
as estimated in [18]. The gel transition temperature is Tg = 291 K and 311 K for x = 0 (fully unsaturated) and 1 (fully saturated), respectively. The ordered (large ψ) and disordered (ψ = 0) phases are, respectively, denoted by O and D. The critical point is indicated by a filled circle, and the triple point by Tr. The critical points are located at (a) xc= 0.498,Tc= 280 K, and (b) xc= 0.5,
We consider a single bilayer membrane composed of x mole fraction of saturated lipid and (1−x) of unsaturated lipid. The two lipids are taken to have different gel transition temperatures originating from different chain length, degree of saturation, or hydrophilic head group. We assume the same area per molecule for both species, and ignore lipid exchange with the surrounding solvent. The total free energyfℓℓ
=fℓℓ 1 +f
ℓℓ
2 comprises i) the free energyf ℓℓ 1
of mixing and binary interactions, and ii) the “stretching” energyfℓℓ
2 , which controls changes
in bilayer thickness.
The free energy per sitefℓℓ
1 is the sum of the entropy of mixing and enthalpy. It can be
written within a Bragg-Williams (mean-field) theory as
f1ℓℓ(x) =kBT[xlogx+ (1−x) lo g(1−x)]−
1 2Jx
2
, (1)
wherekB is the Boltzmann constant,T is the temperature,J >0 is an attractive interaction
parameter that enhances demixing. Linear terms inxcan be disregarded because they merely shift the origin of the chemical potential.
To describe the gel transition, which involves chain ordering and stiffening, we introduce a rescaled membrane thickness ψ ≡ (δ−δ0)/δ0 as an order parameter, where δ is the
ac-tual membrane thickness andδ0 is the constant membrane thickness in the disordered phase
corresponding to the liquid phase [18]. Note that ψ summarizes changes in various degrees of freedom, including the conformations of the hydrocarbon chains and their inter-chain cor-relations. Since the gel transition is first order, an appropriate phenomenological Landau expansion of the “stretching” free energy per site in powers ofψ is [18]
fℓℓ
2 (x, ψ) =
1 2a
′
2
T−T∗(x)
ψ2+1
3a3ψ
3+1
4a4ψ
4, (2)
where a′
2 > 0, a3 < 0, and a4 > 0. For a single component membrane (i.e., x = 0 o r
1), T∗ is a reference temperature, and the first-order gel transition temperature is given by Tg = T∗+ 2a32/(9a′2a4). For a binary mixture, the transition temperature depends on
the compositionx; for convenience, we describe the reference temperature T∗(x) as a linear interpolation between the two pure limits:
T∗(x) =xT∗
s + (1−x)Tu∗, (3)
whereT∗
s andTu∗are the reference temperatures of the pure saturated and unsaturated lipids,
respectively. With all else the same (head group size, interactions, and chain length, etc.), we expect T∗
s > Tu∗, because unsaturated lipids break up the crystallizing tendencies. Note
that eq. (3) leads toa coupling termxψ2[19]. We have neglected a lower-order bilinear term
xψ, which induces a small temperature and composition dependence in δ0. Another possible
coupling termx2ψ simply renormalizes the interaction parameterJ.
Combining eqs. (1)-(3), we obtain the total free energyfℓℓ
. After minimizing with respect to ψ, the two-phase region is obtained by the Maxwell construction. In fig. 1, we show two typical phase diagrams of binary lipid mixtures. For small J (fig. 1(a)), which corresponds experimentally to mixtures with weak segregation tendency, a cigar-like coexistence region is obtained between a disordered phase (D) whereψ= 0 (liquid) and an ordered phase (O) whereψ >0 (gel). At temperatures below the cigar-shape region, there is another coexistence region between two ordered phases, O1 + O2, withψ1ψ2. This type of phase diagram was
324 EUROPHYSICS LETTERS
T
U
S
C
L
L C
(a)
(b)
Fig. 2 – (a) Schematic phase prism of a ternary system consisting of saturated lipid (S), unsaturated lipid (U), and cholesterol (C). The gray and black regions on the constant-temperature triangle plane are two-phase and three-phase coexistingregions, respectively. (b) Lattice model for a lipid-cholesterol mixture. Each cholesterol molecule (•) forms a dimer with a neighboring lipid molecule (◦).
two disordered phases and ordered phase (D1 + D2 + O2), or the disordered phase and two ordered phases (D1 + O1 + O2) coexist. Many features of this phase diagram can be seen for DEPC-DPPE lipid mixtures which have a stronger segregation tendency because both head and tail moieties are different [20].
Model for lipid-cholesterol systems. – Next we discuss the role of sterols, such as choles-terol and lanoscholes-terol, on the phase behavior. On the one hand, a small amount of cholescholes-terol destabilizes the gel phase in favor of a liquid-disordered (Ld) phase [14, 15]. Substantial
amount of cholesterol, on the other hand, stabilizes aliquid-ordered (Lo) phase in which the
lipid hydrocarbon tails are extended, but maintain high lateral mobility. This reflects the dual molecular mechanism of a cholesterol molecule: it can act i) as an “impurity” and weakens the inter-lipid interactions for ordering, or ii) as a “chain rigidifier” and induces conforma-tional order in neighboring lipid chains [13]. Moreover, recent experiments using atomic force microscopy showed that the cholesterol-rich domains are thicker than the cholesterol-poor re-gions [21, 22], supporting the assumption that the local membrane thickness can be taken as the order parameter.
Based on these observations, we propose a model for lipid-cholesterol binary mixtures. Consider a membrane with cholesterol mole fractionc and lipid mole fraction (1−c). There are three contributions to the total free energyfℓc=fℓc
1 +f ℓc 2 +f
ℓc
3 : i) the entropy of mixing
fℓc
1 (c) between lipid and cholesterol; ii) the “stretching” energyf ℓc
2 (ψ) of lipid molecules; and
iii) direct coupling terms between lipid and cholesterol,fℓc
3 (c, ψ), which take intoaccount the
effect of cholesterol on the bilayer thickness.
We note that the coexistence region in the lipid-cholesterol system is typically found only for c≤0.5 [8, 14, 15]. For cholesterol concentration above roughly 0.5, the entire bilayer be-comes unstable. To account for such observations we assume that each cholesterol molecule irreversibly dimerizes with a single lipid molecule forming a “condensed complex”, as has pre-viously been inferred from experiments [23] and simulation [24]. Since all cholesterol molecules are assumed to form dimers, as shown in fig. 2(b), the entropy of mixing is taken between lipid-cholesterol dimers and the remaining monomeric lipids, and is given by a Flory-Huggins form:
fℓc
[image:5.516.40.351.83.241.2]0 0.1 0.2 0.3 0.4 0.5 c 280 300 320 340 T [K] D D+O2 O1 O1+O2 O2 Tr (a)
[image:6.516.58.414.95.245.2]0 0.1 0.2 0.3 0.4 0.5 c 260 280 300 320 T [K] O D O+D (b)
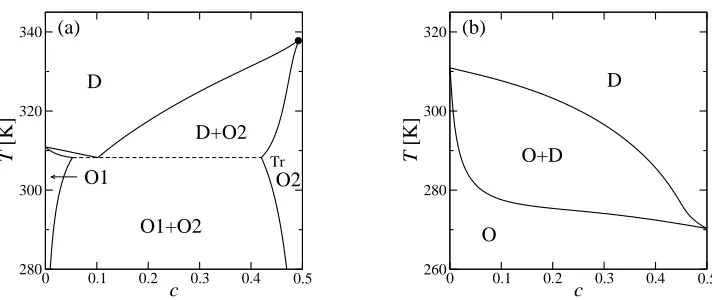
Fig. 3 – Phase diagrams of binary lipid-sterol mixtures as a function of mole fractioncof sterol and temperatureT for (a) cholesterol, Γ1 = 11kBT∗, Γ2 = 47kBT∗; and (b) lanosterol, Γ1 = 28kBT∗,
Γ2= 20kBT∗. The other parameters are the same as in fig. 1, exceptT∗= 260 K. The gel transition
temperature atc= 0 isTg = 311 K. The ordered (largeψ) and disordered (non-zero smallψ) phases are, respectively, denoted by O and D. The critical point indicated by a filled circle in (a) is located atcc= 0.492,Tc= 338 K.
This free energy is valid only for 0≤c ≤0.5, since each cholesterol molecule is paired with a neighboring lipid, and the monolayer loses its stability above aboutc= 0.5. The first term is the entropy of dimers having an area fraction of 2c, while the second term accounts for the entropy of lipid monomers of area fraction (1−2c). Although extensions of the model to include excess free cholesterol and/or formation of trimers, etc. is possible [25], the present situation is enough to describe the qualitative phase behavior.
The Landau free energy describing the structural phase transition of the membrane is given byfℓc
2 (ψ), and is the same asf ℓℓ
2 of eq. (2):
f2ℓc(ψ) =
1 2a
′
2(T−T∗)ψ 2
+1 3a3ψ
3
+1 4a4ψ
4
, (5)
where the order parameterψ is again the relative bilayer thickness, and T∗ is the reference temperature of the pure lipid system.
The simplest free energy to account for the previously mentioned dual effects of cholesterol can be expressed by the following phenomenological coupling terms:
f3ℓc(c, ψ) =
1 2Γ1cψ−
1 2Γ2c
2
ψ, (6)
where Γ1>0 and Γ2>0 are the coupling constants. The first term expresses the fact that
a small amount of cholesterol (c >0) acts as an “impurity”. It interferes with the crystalline ordering, and enhances disordered chains (smaller ψ). This term is necessary because, as shown in the experimental phase diagram [14,15], the gel-Ldcoexistence temperature decreases
upon adding cholesterol to the pure lipid system. The second term corresponds to the “chain rigidifying” effect reflecting the fact that a larger amount of cholesterol favors ordered tail states and hence largerψ. Meanwhile, this coupling induces lipid-cholesterol phase separation since it is proportional to c2 with a negative coefficient. In other words, the effective
lipid-cholesterol interaction depends on the conformational states of the lipid chains.
Adding eqs. (4)-(6), we first minimizefℓcwith respect to ψand then construct the phase
326 EUROPHYSICS LETTERS
values of the two parameters, Γ1 and Γ2. This can be seen in fig. 3, where twodifferent
sets of values are taken to model (a) lipid-cholesterol and (b) lipid-lanosterol interactions. In fig. 3(a), there are three different coexisting regions. Due to the Γ1coupling term in eq. (6),
the region of the disordered (D) phase, characterized by a non-zero small value ofψ, widens at the expense of the ordered (O1) phase, characterized by a large value of ψ, upo n the addition of a small amount of cholesterol (c <0.1). Note that D- and O1-phases, respectively, correspond to Ld and gel phases in the experiments. For largerc, however, the Γ2 coupling
term overcomes the first term, and the region of the D-phase narrows in favor of O2-phase (c >0.1), which corresponds to theLophase where the order parameterψtakes a value much
larger than that in the D-phase. The obtained phase diagram for lipid-cholesterol systems agrees semiquantitatively with the experimental one [14, 15]. The D- and O2-phases have the same symmetry and are continuously connected, with a critical point at cc = 0.492 < 0.5.
The appearance of the critical point can be understood by noticing that the coupling terms in eq. (6) are linear inψ, and act as an external field coupled toψ. In general, the first-order transition becomes continuous when the applied external field is strong enough.
For larger Γ1 and smaller Γ2 we obtain the phase diagram shown in fig. 3(b). In this
case, the effective external field is tooweak toeliminate the first-order transition, and the critical point does not exist. This phase diagram resembles that of binary lipid-lanosterol mixtures [26]. Compared to cholesterol, lanosterol has three additional methyl groups and has a structurally rougher hydrophobic part, leading to a weaker enhancement of lipid tail stretching (smaller Γ2). Moreover, an extra double bond in the lanosterol hydrocarbon tail
can be expected toinhibit crystallinity (larger Γ1). In fact, lanosterol is considered to be a
precursor to cholesterol in the evolutionary pathway [26]. Although cholesterol can stabilize the region of coexistence between the D- and O2-phases (i.e.,Ld+Lo) as shown in fig. 3(a),
such a coexistence has not been identified for the lipid-lanosterol mixtures [26]. The fact that the coexistence region ends atc= 0.5 is due only to the artificial truncation of the model at
c= 0.5. If free excess lanosterol were allowed, the phase boundaries would continue until the membrane loses its integrity. However, such a break-up of the membrane is not considered here. We note that although the values of the coupling constants are chosen in an attempt to reproduce the experimental phase diagrams, their order of magnitude is in agreement with that obtained from molecular level theory [27].
Discussion. – Within a few simplifying assumptions we have obtained phase diagrams that successfully mimic the experimental ones. A few points merit further discussion. We used only one order parameterψ(related tolocal membrane thickness) todescribe the membrane internal degrees of freedom of chain ordering and crystallinity. This assumption is well moti-vated for pure lipid membrane where both ordering and crystallization occur simultaneously. Although addition of cholesterol may separate the chain ordering and freezing transitions and stabilize theLophase, the thicknessψis sufficient here todistinguish between the gel (O1),Lo
(O2), andLd(D) phases. Note that the symmetry of the D- and O2-phases is the same (hence
the critical point), and differs from the solid-like and local crystalline order of the O1-phase. As an extension to the present model, it may be of interest to use two distinct order parameters. Finally, we discuss the qualitative behavior of the full ternary phase diagram for saturated (S) and unsaturated (U) lipids in the presence of cholesterol (C). The phase diagrams in figs. 1(a) and 3(a) correspond to the two side views of the schematic compositions-temperature phase prism in fig. 2(a), namely the US-T and the SC-T planes, respectively. A topologically similar phase diagram tofig. 3(a) is expected for the UC-T plane [26].
SC-T plane extend onto this triangle plane, and may form a three-phase coexisting region (D + O1 + O2,i.e.,Ld+ gel +Lo) when they meet each other. If the phase separation does not
occur between U and C for this temperature, a critical point between D and O2 is expected to appear. As the temperature is increased, the line of critical points may end when the three-phase region disappears. These arguments are consistent with recent experimental studies of the phase morphology inside the phase prism [6–9]. Further calculations of the full ternary phase diagrams are in progress. “Rafts”, reported to be in theLo(O2) phase, may correspond
tonm-µm sized domains similar to the macroscopic phase separation seen in ternary mixtures at biologically relevant temperatures and compositions [3]. The small length scales associated with “rafts”in vivo remain unexplained.
∗ ∗ ∗
We thankT. Kato for useful discussions, and the Isaac Newton Institute, University of Cambridge, for its hospitality. This work is supported by the Japan Society for the Promo-tion of Science, the Royal Society, the Ministry of EducaPromo-tion, Culture, Sports, Science and Technology, Japan under grant No. 15540395, the Israel Science Foundation (ISF) under grant No. 210/02, and the US-Israel Binational Foundation (BSF) under grant No. 287/02.
REFERENCES
[1] Lipowsky R. andSackmann E.(Editors), Structure and Dynamics of Membranes: Generic and Specific Interactions, Vol.1A(Elsevier, Amsterdam) 1995.
[2] Simons K.andIkonen E.,Nature,387(1997) 569.
[3] Brown D. A.andLondon E.,J. Biol. Chem.,275(2000) 17221. [4] Korlach J.et al.,Proc. Natl. Acad. Sci. USA,96(1999) 8461. [5] Dietrich C.et al.,Biophys. J.,80(2001) 1417.
[6] Silvius J. R., del Giudice D.andLafleur M.,Biochemistry,35(1996) 15198. [7] Feigenson G. W.andBuboltz J. T.,Biophys. J.,80(2001) 2775.
[8] Veatch S. L.and Keller S. L.,Phys. Rev. Lett., 89(2002) 268101; Biophys J., 85(2003) 3074.
[9] Baumgart T., Hess S. T.andWebb W. W.,Nature,425(2003) 821. [10] Gaus K.et al.,Proc. Natl. Acad. Sci. USA,100(2003) 15554.
[11] Bloom M.andMouritsen O. G., in ref. [1].
[12] Ipsen J. H.et al.,Biochim. Biophys. Acta,905(1987) 162. [13] Nielsen M.et al.,Phys. Rev. E,59(1999) 5790.
[14] Vist M. R.andDavis J. H.,Biochemistry,29(1990) 451.
[15] Sankaram M. N.andThompson T. E.,Proc. Natl. Acad. Sci. USA,88(1991) 8686. [16] Lipowsky R.andDimova R.,J. Phys. Condens. Matter,15(2003) S31.
[17] Sackmann E., in ref. [1].
[18] Goldstein R. E.andLeibler S.,Phys. Rev. A,40(1989) 1025.
[19] A similar model was proposed byPriest R. G.,Mol. Cryst. Liq. Cryst.,60(1980) 167. [20] Wu S. H.andMcConnell H. M.,Biochemistry,14(1975) 847.
[21] Yuan C., Furlong J., Burgos P.andJohnston L. J.,Biophys. J.,82(2002) 2526. [22] Lawrence J. C.et al.,Biophys. J.,84(2003) 1827.
[23] Radhakrishnan A.et al.,Proc. Natl. Acad. Sci. USA,97(2000) 12422. [24] Pandit S. A., Bostick D.andBerkowitz M. L.,Biophys. J.,86(2004) 1345. [25] Scott R. L.andMagat M.,J. Chem. Phys.,13(1945) 172.
![Fig. 1 – Calculated phase diagrams of binary mixtures of saturated and unsaturated lipids as a functionof mole fraction of the saturated lipidThe other parameters areTas estimated in [18]](https://thumb-us.123doks.com/thumbv2/123dok_us/8090511.231343/3.516.38.405.440.585/calculated-diagrams-saturated-unsaturated-functionof-saturated-parameters-estimated.webp)