This is a repository copy of
Regulatory motif discovery using a population clustering
evolutionary algorithm
.
White Rose Research Online URL for this paper:
http://eprints.whiterose.ac.uk/3419/
Article:
Lones, Michael A. and Tyrrell, Andy M. orcid.org/0000-0002-8533-2404 (2007) Regulatory
motif discovery using a population clustering evolutionary algorithm. IEEE/ACM
Transactions on Computational Biology and Bioinformatics. pp. 403-414. ISSN 1545-5963
https://doi.org/10.1109/tcbb.2007.1044
[email protected] https://eprints.whiterose.ac.uk/ Reuse
Items deposited in White Rose Research Online are protected by copyright, with all rights reserved unless indicated otherwise. They may be downloaded and/or printed for private study, or other acts as permitted by national copyright laws. The publisher or other rights holders may allow further reproduction and re-use of the full text version. This is indicated by the licence information on the White Rose Research Online record for the item.
Takedown
If you consider content in White Rose Research Online to be in breach of UK law, please notify us by
Universities of Leeds, Sheffield and York
http://eprints.whiterose.ac.uk/
White Rose Research Online URL for this paper:
http://eprints.whiterose.ac.uk/3419
Published paper
Lones, Michael A. and Tyrrell, Andy M. (2007)
Regulatory motif discovery using a
population clustering evolutionary algorithm.
IEEE - ACM Transactions on
Computational Biology and Bioinformatics, 4 (3). 403-414.
Regulatory Motif Discovery Using a Population
Clustering Evolutionary Algorithm
Michael A. Lones and Andy M. Tyrrell
Abstract—This paper describes a novel evolutionary algorithm for regulatory motif discovery in DNA promoter sequences. The algorithm uses data clustering to logically distribute the evolving population across the search space. Mating then takes place within local regions of the population, promoting overall solution diversity and encouraging discovery of multiple solutions. Experiments using synthetic data sets have demonstrated the algorithm’s capacity to find position frequency matrix models of known regulatory motifs in relatively long promoter sequences. These experiments have also shown the algorithm’s ability to maintain diversity during search and discover multiple motifs within a single population. The utility of the algorithm for discovering motifs in real biological data is demonstrated by its ability to find meaningful motifs within muscle-specific regulatory sequences.
Index Terms—Evolutionary computation, population-based data clustering, motif discovery, transcription factor binding sites, muscle-specific gene expression.
Ç
1
I
NTRODUCTIONA
motif, in the context of biological sequence analysis, is a pattern of nucleotide bases or amino acids which captures a biologically meaningful feature common to a group of nucleic acid or protein sequences. Examples of motifs include protein domains and binding sites within amino acid sequences, and regulatory, splicing and locali-zation signals within DNA and RNA sequences. Motif discovery is the process of identifying motifs within biological sequences.In this paper, we focus upon the problem of identifying regulatory motifs within the promoter sequences of coex-pressed genes. The identification of regulatory motifs is an important problem in contemporary biology since it under-lies efforts to understand and reconstruct the regulatory networks that are central to the functioning of biological organisms. However, it is also a particularly hard problem, made difficult by a low signal-to-noise ratio resulting from the poor conservation and short length of transcription factor binding sites when compared to the length of promoter sequences. Recent reviews have noted some important limitations of existing tools for regulatory motif discovery: notably, the limited applicability of current nucleotide background models [34], rapid failure with increasing sequence length [14], and a tendency to report false positives rather than true transcription factor binding sites [14], [34].
We describe a novel evolutionary computation algorithm for regulatory motif discovery. The algorithm uses popula-tion clustering to logically partipopula-tion the search space, thereby allowing weak motifs to be found in the presence
of stronger motifs and noise. Over a series of experiments, using both synthetic and real DNA sequences, we show how this approach allows biologically significant motifs to be found in relatively long promoter sequences of up to 5 kb, and multiple significant motifs to be found within a single run. The paper is organized as follows: Section 2 reviews relevant background material. Section 3 describes the population clustering evolutionary algorithm and its application to regulatory motif discovery. Experimental results are presented in Section 4 and discussed in Section 5. Section 6 concludes.
2
B
ACKGROUND2.1 Regulatory Motifs
Regulatory motifs capture the patterns of DNA bases responsible for controlling when and where a gene is expressed. Typically, regulatory motifs describe transcrip-tion factor binding sites (TFBSs) embedded in the DNA sequences upstream of a gene’s transcription start site (TSS). More rarely, regulatory signals may occur downstream of the TSS and even within coding sequences. Many well-characterized motifs, such as the TATA box and Sp1, occur proximal to the TSS. DNA bending allows transcription factors bound at TFBSs located kilobases from the TSS to interact with the transcription complex. Hence, regulatory motifs may be found large distances upstream or down-stream of the TSS. This also means that, for most TFBSs, there are few constraints upon their spatial location within a DNA sequence. Most TFBSs have a span of 5-8 bp, although the footprint of a transcription factor typically spans 10-20 bp, placing constraints upon the bases surrounding the binding site [38].
Well-conserved motifs, such as CCATT and TATA, are defined by their consensus sequences or, where variation exists, by simple regular expressions. For many regulatory motifs, however, there exists considerable sequence varia-tion both within and between species. Consequently, it is
IEEE/ACM TRANSACTIONS ON COMPUTATIONAL BIOLOGY AND BIOINFORMATICS, VOL. 4, NO. 3, JULY 2007 403
. The authors are with the Intelligent Systems Research Group, Department
of Electronics, University of York, Heslington, York YO10 5DD, UK. E-mail: {mal503, amt}@ohm.york.ac.uk.
Manuscript received 15 Mar. 2006; revised 30 Aug. 2006; accepted 23 Oct. 2006; published online 17 Jan. 2007.
For information on obtaining reprints of this article, please send e-mail to: [email protected], and reference IEEECS Log Number TCBB-0061-0306. Digital Object Identifier no. 10.1109/TCBB.2007.1044.
normal for regulatory motifs to be represented as position frequency matrices (PFMs, also known as profiles) or position weight matrices (PWMs), showing the likelihood of each base occurring at each position within the motif. Known regulatory motif profiles are cataloged in databases such as TRANSFAC [19] and JASPAR [24].
2.2 Motif Discovery
There have been a number of recent reviews of motif discovery techniques [14], [21], [26], [31], [34], [36]. Although it is difficult to categorize all the different techniques, a distinction is often made between enumera-tive and statistical approaches. The former attempt to enumerate the search space of possible motifs and test each for significance, while the latter attempt to optimize the parameters of a motif model by statistical analysis of the sequence data. Enumerative algorithms will find optimal solutions for discrete representations of relatively short motifs, but do not scale to larger motifs and continuous models due to the combinatorial growth in the search space. Nevertheless, more complex exhaustive search algorithms, such as TEIRESIAS [22], which uses information about the relative occurrences of substrings to reduce the search space, can be used to discover discrete representations of longer motifs. Statistical approaches, by comparison, are commonly used for finding continuous motif models such as position frequency matrices. By far the most common statistical approaches used in motif discovery tools are Expectation-Maximisation (EM) [1] and Gibbs Sampling [33] algorithms, which use an iterative procedure to optimize an initial estimate of the motif model’s parameters (see [31] for a review). MEME [1] is perhaps the best-known example of this approach.
The limitations of existing motif discovery tools have been highlighted in two recent comparative experimental studies [14], [34]. Tompa et al. [34] compared the abilities of 14 different tools to rediscover known motifs in both real and synthetic eukaryotic promoter sequences. While many of the tools performed well on yeast data sets, performance upon metazoan data sets was significantly poorer—leading the authors of the study to suggest that there is a need for better modeling of metazoan regulatory regions. In a complemen-tary study, Hu et al. [14] compared the performance of 5 prominent tools upon a number of prokaryotic promoter data sets. Notably, they found that sequence length is the main limiting factor, with performance of all the tools degrading rapidly as the sequence length was increased. They also noted the importance of being able to search for motifs of appropriate length since algorithms with fixed-sized solutions performed poorly with inappropriate para-meter settings. The authors of both reports also highlighted the fact that motifs with high significance scores are not necessarily of biological interest, suggesting a need for tools to generate multiple predictions.
The NestedMICA algorithm of Down and Hubbard [6] and the Deterministic Matrix Enumerator (DME) algorithm of Smith et al. [30] are two recent approaches that attempt to overcome some of the limitations of earlier motif discovery tools. NestedMICA combines a new statistical sampling algorithm with a multiclass nucleotide background model to improve sensitivity. The authors show that the algorithm
is able to find regulatory motifs in longer sequences than MEME. DME is an enumerative algorithm that uses levels of information content to discretize the search space and local search to optimize the results. Rather than using a probabilistic nucleotide background model, DME uses a set of sequences to explicitly capture the nucleotide back-ground. The authors believe that this is particularly appropriate for discovering tissue-selective regulatory motifs, where background sequence sets can readily be assembled from promoter sequences of genes known not to be expressed within a specified tissue. Their results suggest that DME carries out more sensitive motif discovery than a number of more common algorithms.
2.3 Motif Discovery Using Evolutionary Algorithms Evolutionary algorithms (EAs) are a family of stochastic population-based search algorithms that carry out an evolutionary search process loosely modeled upon biological evolution. Typically, the algorithm begins with a population of randomly generated candidate solutions to some problem. This population is then evolved over a succession of generations by iteratively removing the relatively poor solutions and introducing new solutions derived from the relatively fit members of the population. New solutions are created using heuristic operations that either randomly change (mutate) pieces of existing solutions or randomly recombine pieces of more than one existing solution ( cross-over). Evolutionary algorithms have been used to solve a number of problems in bioinformatics [8]. The main benefit of the approach is that it carries out global nonexhaustive search while requiring little knowledge of how the search space is structured.
There have been numerous applications of evolutionary computation to consensus biosequence discovery. Many of these have been concerned with multiple sequence align-ment, a problem for which EAs have been shown to outperform more conventional approaches in terms of alignment quality [18], [29]. Evolutionary algorithms have also been applied to the specific problem of motif discovery. The relative flexibility of evolutionary computation with regard to representation has allowed these approaches to use a variety of motif models. Regular expressions have been evolved by both Hu [15] and Heddad et al. [12] to describe protein motifs, producing results competitive with more conventional approaches. Ross [23] has described how an EA can be used to evolve probabilistic regular expres-sions which can effectively classify PROSITE families. A number of studies have looked at how EAs may be used in the design of Hidden Markov Models (HMMs) for use in biosequence applications [37], [39]. Evolutionary computa-tion approaches have also been used to evolve a number of unconventional structures for representing and recognizing sequence motifs [2], [13], often with higher classification accuracy than conventional approaches.
motifs within the 1 kb promoter regions of coexpressed genes. A notable feature of this approach is that the authors evolved both the content of the motif and its position within each sequence, making use of specialized crossover operators to achieve the latter. Solution diversity was preserved during evolution to discourage conver-gence to local optima by the use of an island model distributed population and the removal of duplicate solu-tions. The algorithm was able to discover consensus sequences corresponding to the binding sites of two known transcription factors. Another recent approach, by Congdon et al. [4], has shown the ability of genetic algorithms to find conserved sequence strings in situations where exhaustive methods would be intractable.
3
M
ATERIALS ANDM
ETHODS3.1 Objective
The objective of the algorithm is to identify regulatory elements common to groups of coexpressed genes. The algorithm is provided with a set of promoter sequences from the coexpressed genes and a second set of sequences specifying the nucleotide background. After processing, the algorithm outputs those motifs that it has identified as being most overrepresented in the promoter sequences relative to the background sequences. With the notable exception of DME, this use of a background sequence set is not commonplace within motif discovery tools, which, in general, either build a background model from the set of promoter sequences in which they are searching for motifs or are provided with a background model derived from a larger set of sequences. However, this approach is often used in evolutionary computation-based approaches, in which there is no explicit modeling of the nucleotide background.
3.2 Motif Representation and Evaluation
Regulatory motifs are represented as variable-length nor-malized position frequency matrices in order to capture the variation in both defining length and degree of conservation among TFBSs. The fitness of a motif is a measure of how well it differentiates between sequences in a specified data set and the set of background sequences. It is calculated as follows: Prior to fitness evaluation, the PFM is converted to a PWM with log-odds scores for more efficient matching. This is done by multiplying each entry in the PFM by 4 and then taking the natural logarithm (see Fig. 1 for an example). For each sequence in both the data set and the background set, the best match to the PWM is found by calculating the PWM match score at each offset in the sequence. This value is then normalized to the range [0, 1] by dividing by the maximum possible score for any PWM of equivalent size. The fitness of the motif is given by the difference between the mean best match score upon the coexpression data set and the mean best match score upon the background data set. This is mapped linearly to a value between 0 and 1, with values above 0.5 indicating a better match against sequences in the data set than the back-ground set.
Unlike standard scoring metrics, this measure of fitness does not use a cutoff value to classify matches as true or
false positives or negatives but, rather, uses a continuous function taking into account all partial matches. This is important from an evolutionary computation perspective since it gives more information about the search gradient than standard metrics. It is interesting to note that this fitness function has an implicit bias toward high information content motifs, since those capable of generating higher match scores per base can receive higher fitness scores. This is generally a useful feature since the conserved regions of regulatory motifs tend to have high information content [17].
Where evolved PFMs are compared to known motifs, we use the metric defined by Sandelin et al. [25], which uses a modified dynamic programming algorithm to find the best alignment between the two frequency matrices, allowing for a single gap. This is the same algorithm that is used for comparing motifs on the JASPAR Web server [24].
3.3 Population Clustering
Regulatory motif discovery involves finding biologically meaningful, not necessarily well-conserved, patterns within noisy data sets. These patterns are generally short and can occur anywhere within sequences up to about 10 kb in length. In most cases, the set of positive example sequences is small and contains many overrepresented patterns when compared to the nucleotide background. Gene expression is typically determined by the binding of multiple transcrip-tion factors and, consequently, there are likely to be multiple relevant patterns within a data set.
Two factors make this problem particularly difficult for standard evolutionary algorithms to solve: the need to find multiple solutions and the fact that biologically meaningless solutions may have a higher apparent fitness then those representing true regulatory sites. Standard evolutionary algorithms generally converge to either a single solution or a set of similar solutions. This convergence is due to loss of solution diversity during selection, since the level of selective pressure required to find good solutions also
[image:5.612.295.536.66.291.2]LONES AND TYRRELL: REGULATORY MOTIF DISCOVERY USING A POPULATION CLUSTERING EVOLUTIONARY ALGORITHM 405
tends to remove diversity from the population. Conse-quently, standard evolutionary algorithms cannot generally maintain multiple diverse solutions to a problem or solutions with a fitness level much below that of the population’s maximum fitness. To overcome these pro-blems, a number of techniques have been developed that attempt to maintain diversity within evolving populations. These include fitness sharing and crowding [27], speciation through limited mate choice [9], and the use of multiple subpopulations and spatially distributed populations [3].
In this work, we use population clustering [28], [32] to maintain solution diversity. Population clustering uses a data clustering algorithm to partition the population into subpopulations prior to mating. Mating then takes place solely within subpopulations. This explicit partitioning of the population is the primary advantage of population clustering over fitness sharing, crowding, and mating-based techniques—all of which achieve partitioning through indirect means—since it enables both selection and recom-bination to be carried out locally. In particular, selective pressure can be made high within partitions, promoting optimization of individual solutions, whilst remaining low between partitions, promoting solution diversity. Unlike distributed populations, which also have explicit partition-ing, this partitioning is determined by similarity between solutions rather than by evolutionary history, promoting better coverage of the search space.
3.3.1 Clustering Algorithm
There are a large number of data clustering algorithms which could be used for population clustering. In this work, we use a sequential leader clustering algorithm [11], a simple incremental clustering algorithm chosen predominantly for its low time complexity. The leader algorithm makes a single pass through the population, and depending upon the degree of similarity, either assigns each solution to an existing cluster or uses it to seed a new cluster. Pseudocode for our implementation is given in Algorithm 1. Sequential leader clustering is order-dependent, and we take advantage of this by processing the fittest solutions from the fittest clusters first (see Algo-rithm 3, line 22 onward for details). This means that the fittest solutions are more likely to be at the centre of clusters. The relative imprecision of leader clustering also means that clusters can vary significantly from one generation to the next, providing an opportunity for solutions to move between clusters and thereby allowing a degree of genetic flow and implicit intercluster mating.
Algorithm 1 Population Clustering 1: Clusters( ;
2: for allpfminfP opulationgdo
3: ifClusters¼ ;then
4: create a new cluster and insertpfm
5: else
6: smallestdistance( 1
7: fv~( feature vector forpfm
8: for allcinClustersdo
9: cfv~ ( mean feature vector forc
10: distance( Euclidean distance betweenfv~
andcfv~
11: ifdistance < smallestdistancethen
12: smallestdistance(distance
13: closest(c
14: end if
15: end for
16: ifðsmallestdistance > maxdistanceÞand ðkClustersk< maxclustersÞthen
17: create a new cluster and insertpfm
18: else
19: insert pfmintoclosest
20: end if
21: end if
22: end for
3.3.2 Clustering Metric
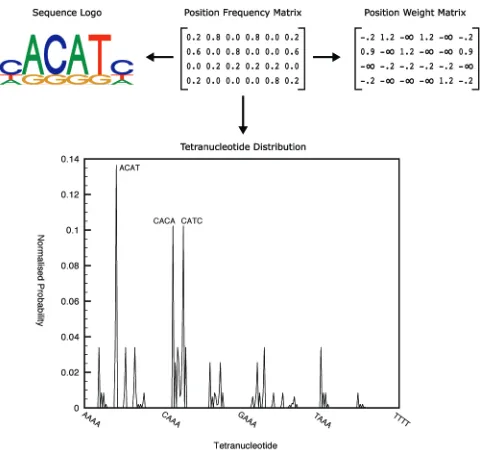
Useful population clustering is dependent upon a suitable choice of clustering metric. In this work, we have used the distance between the tetranucleotide distributions of PFMs as a clustering metric.1 An example of the tetranucleotide distribution corresponding to a PFM is shown in Fig. 1. This metric was successfully used in [10] to identify TFBS families within the TRANSFAC database. Pseudocode for generating a feature vector describing the tetranucleotide distribution of a PFM is given in Algorithm 2. Since the information content of solutions in the population will generally increase during search, the distances generated by this clustering metric will also increase. To compensate for this, the between-cluster distance parameter (maxdistance
in Algorithm 1) is set proportional to the average highest tetranucleotide probability among high scoring solutions using the following equation:
maxdistance¼kðvÞ4; ð1Þ
where v is the average highest column value among the fittest PFMs from each cluster, and k is a constant which indirectly affects the number of clusters in the final population.
Algorithm 2 Calculate Feature Vectorfv
for Position Frequency Matrixpfm
1: tn(0
2: for alltetranucleotideinfAAAA. . .T T T Tgdo
3: psum(0,count(0
4: fori¼0to number of columns inpfm4do
5: p(1
6: count(countþ1
7: for allresidues intetranucleotidedo
8: p(ppfmvalue for residue at columnðiþresidue positionÞ
9: end for
10: psum(psumþp
11: end for
12: fv½tn (psum=count## normalize probability to
avoid PFM length bias ## 13: tn(tnþ1
14: end for
3.4 Population Clustering Evolutionary Algorithm Pseudocode for the population clustering evolutionary algorithm (PCEA) is given in Algorithm 3. The algorithm
consists of an initialization stage followed by an iterative phase comprising clustering, mating, and evaluation. During initialization, the population is filled with randomly generated PFMs with uniformly distributed frequencies for each base. Following clustering of the population (see Section 3.3.1), mating takes place within each cluster, with the number of child solutions produced in each cluster proportional to the relative fitness of the solutions in the cluster. Every cluster produces at least one child solution, in order to preserve population diversity. New PFMs are generated using mutation and uniform crossover. A fitness-ranked selection strategy is used to select parents for mating. Mutation is applied with a given probability per nucleotide position and works by randomly changing the frequencies assigned to one or more residues and then normalizing the other frequencies so that the total still sums to unity. Uniform crossover selects crossover points with a given probability per nucleotide position and then swaps the groups of matrix columns occurring between every other pair of crossover points. Mutation and crossover are applied independently according to a specified mutation-crossover ratio. After creation, new PFMs are immediately evaluated using the fitness function described in Section 3.2.
Algorithm 3Population Clustering Evolutionary Algorithm 1: P opulation(initializeðÞ
2: evaluateðP opulationÞ
3: forgeneration¼1tomaxgenerationsdo
4: Clusters(clusterðP opulationÞ 5: orderClustersby fitness rank
6: ## carry out breeding within clusters ##
7: for allcinClustersdo
8: c0( new cluster
9: setkc0kinversely proportional to
fitness rank ofc
10: forchild¼1tokc0kdo
11: ifrandomðÞ< mutationcrossoverratio
then
12: c0½child (mutate(parent chosen by
rank selection)
13: else
14: c0½child (crossover(parents chosen
by rank selection)
15: end if
16: evaluateðc0½childÞ 17: end for
18: c(c0
19: end for
20: orderClustersby fitness rank 21: ## order population for clustering ##
22: formember¼1to size of largest clusterdo
23: for allcinClustersdo
24: ifmember kckthen
25: addc½membertoP opulation0
26: end if
27: end for
28: end for
29: P opulation(P opulation0
30: end for
3.5 Methodology
We are primarily interested in the ability of the algorithm to discover promoter elements that are common to groups of temporally or spatially coexpressed genes, such as those identified through microarray analysis. Since the locations of promoter elements are not necessarily conserved or constrained within promoter sequences and given that they are known to occur at considerable distances from the TSS [38], one behavior we are particularly interested in is the ability of the algorithm to identify motifs within relatively long promoter sequences (i.e., >1 kb). To test the algor-ithm’s capacity in this regard, we follow the approach described by Down and Hubbard [6], using synthetic data sets containing DNA sequences of various fixed lengths. These sequences are created by inserting known regulatory motifs from the JASPAR [24] database into intergenic DNA sequences. Since gene expression is typically the result of interactions between multiple transcription factors bound at different promoter elements, we are also interested in the ability of the algorithm to identify multiple motifs common to a group of sequences. To test this, we use both synthetic sequences with multiple embedded motifs, and a set of muscle-specific promoter sequences curated by Wasserman and Fickett [35] and known to contain multiple promoter elements.
3.6 Data Sets
Data sets used to test the PCEA’s behavior are described below. Where we use data sets provided by other authors, URLs for the original data files are given in footnotes. Our own data sets are in Appendix A (which can be found on the Computer Society Digital Library at http://computer.org/ tcbb/archives.htm).
3.6.1 Synthetic Test Data with Single Motifs
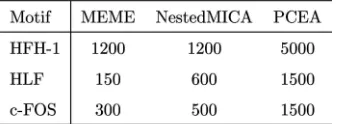
In a recent study, Down and Hubbard [6] used synthetic DNA sequences to compare the ability of MEME and NestedMICA to identify known regulatory motifs from the JASPAR transcription factor binding site database. These synthetic sequences were composed of intergenic DNA sequence fragments into which one or more known motifs had been inserted at random positions. The motifs were generated probabilistically from JASPAR position fre-quency matrices, with the probability of a particular nucleotide occurring at each offset in the motif directly proportional to its respective frequency in the PFM. To mimic the difficulty of real biological data sets, motifs were embedded in only 50 of the 100 sequences in each data set. To allow direct comparison with Down and Hubbard’s results for MEME and NestedMICA, we use the data sets they provide for the JASPAR motifs HFH-1, HLF and c-FOS2 (see Table 1). These are available in sequence lengths of up to 2 kb for HFH-1 and 1 kb for HLF and c-FOS. In particular, for each of these motifs, we use two of Down and Hubbard’s data sets: one for which NestedMICA was able to find the embedded motif, and one corresponding to the longest available sequence length, for which, in all cases,
LONES AND TYRRELL: REGULATORY MOTIF DISCOVERY USING A POPULATION CLUSTERING EVOLUTIONARY ALGORITHM 407
NestedMICA and MEME were not able to find the embedded motif.
For longer sequence lengths, we created new data sets using human promoter sequences from the Eukaryotic Promoter Database (EPD) [20], EMBL Release 85. All sequences covering a range of4;900toþ100bases relative to the TSS were extracted from the database. Where shorter sequences are used, they are cropped from the upstream end. All positive data sets comprise 100 randomly selected sequences, half of which have a known motif probabilisti-cally embedded using the procedure described by Down and Hubbard.
Background sequence sets are composed of a specified number of randomly selected EPD sequences with no embedded motifs. These sequences are cropped to the same length as those in the synthetic sequence data set with which they are used. For the longer sequence lengths, we ensure that the background sequences are not the same as those used to construct the synthetic sequences.
3.6.2 Synthetic Test Data with Multiple Motifs
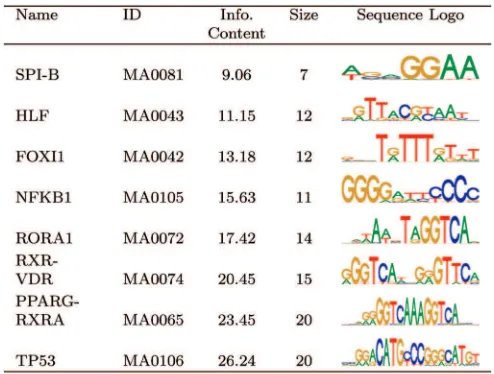
To test the ability of the PCEA to identify multiple known motifs, we constructed a data set containing multiple JASPAR motifs. These were chosen to cover a range of values for information content and defining length and are listed in Table 2. In particular, RORA1, RXR-VDR, and PPARG-RXRA were chosen in order to test the ability of the algorithm to correctly distinguish between similar motifs, since these are all members of the nuclear receptor family and each contains the conserved sequence GGTCA. As for
the single-motif data sets, the motifs were stochastically inserted into half the 100 sequences in the data set. A background sequence set of 1,000 sequences is used for this experiment. In order to avoid search biases introduced by unidentified motifs, random DNA sequences with the same single-nucleotide distribution as the EPD sequences are used rather than the EPD sequences themselves. Sequences in the data set and background set are both 1 kb in length.
3.6.3 Muscle-Specific Data Set
To test the applicability of the PCEA to real biological data, we have applied the algorithm to Wasserman and Fickett’s collection of 43 muscle-specific promoter sequences [35]. Following the approach of Smith et al. [30], who applied the Discriminating Matrix Enumerator (DME) algorithm to this data set, we use the 2,348 nonmuscle entries in the EPD as a background set, and use the 28 muscle-specific promoter sequences in the EPD as a test set.3 The latter is used to
determine which motifs discovered in the Wasserman and Fickett data set have more general significance within muscle promoter sequences and are therefore likely to have biological meaning. Sequences in Wasserman and Fickett’s data set have lengths between 197 bp and 802 bp, those in the test set have lengths between 268 bp and 600 bp, and those in the background set have lengths between 91 bp and 600 bp.
3.7 Parameter Settings
For the synthetic data sets, motifs in the initial generation were generated with lengths in the range 5-50 bases to test the algorithm’s ability to find appropriately sized solutions. For the muscle data set, bounds of 8-40 were used, since interesting motifs are unlikely to be found outside this range. During evolution, new solutions are generated using mutation and uniform crossover in the ratio 7:3. Mutation is applied with a probability of 8 percent per base for new solutions generated by mutation. Two forms of mutation are used. Gaussian mutation selects a new frequency value for a single residue using a Gaussian distribution centerd on the current value and covering one standard deviation in the range0:5. Values outside the range [0, 1] are rejected. Gaussian mutation is applied during 90 percent of mutation events.
A more disruptive mutation operator, which randomizes then normalizes all the residue frequencies in the selected matrix column, is applied during the remaining mutation events. There is also a 4 percent likelihood of adding a new column with random frequencies to either the start or end of a motif during mutation. Uniform crossover selects crossover points according to a probability of 15 percent per base. These operators were chosen to provide a variety of exploratory mechanisms for evolutionary search, and suitable parameter settings were determined experimen-tally. The number of clusters is limited to a maximum of 200 for efficiency reasons. A value of 0.3 is used for the parameterkin (1). We have found that this value maintains the number of clusters at or near the limit of 200. Larger values reduce the number of clusters but, generally, at the 3. These data sets are available from http://www.pnas.org/cgi/
[image:8.612.291.538.98.285.2]content/full/0406123102/DC1.
TABLE 1
[image:8.612.26.270.98.186.2]JASPAR Motifs Embedded in Single Motif Synthetic Data Sets
TABLE 2
expense of solution diversity. Parameter values were selected for overall performance and have not been tuned for individual experiments.
4
R
ESULTS4.1 Synthetic Data with Single Motifs
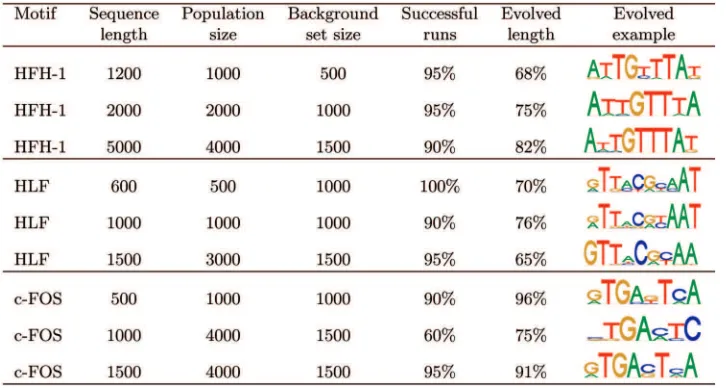
We carried out 20 runs of the PCEA on each of the synthetic data sets containing a single embedded motif in each sequence. Each run had a maximum of 200 generations. Table 3 shows the proportion of runs in which the correct motif was found, the average length of motifs discovered by the algorithm, and an example of an evolved solution for each data set. For a run to be classified as successful, the final population must contain a motif with a high level of similarity to the target motif and have a length at least 50 percent of that of the target motif. Population and background set sizes were determined experimentally and generally represent suitable values for most runs to be successful. Longer sequences required larger populations and background set sizes in order to handle the larger number of patterns present in the sequences and to sufficiently distinguish them from the nucleotide back-ground. The only low success rate is for the c-FOS data set with sequences of length 1,000, for which the PCEA had only a 60 percent success rate despite having the same population size as the c-FOS data set with sequences of length 1,500, which has a high success rate. This is likely to be due to the composition of the sequences underlying the Down and Hubbard data sets, which are general intergenic sequences rather than specifically promoter sequences. Consequently, the EPD sequences in the background set may less accurately capture the background distribution of these data sets than those constructed from promoter sequences.
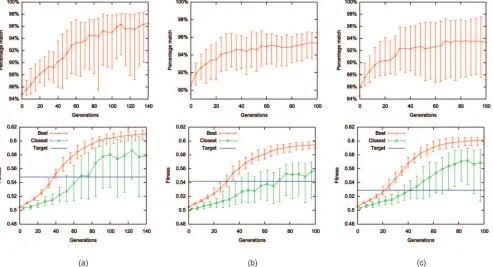
Fig. 2 plots trends in solution fitness and the match to the target motif during evolution when the PCEA is applied to
the data sets with the longest sequence length for each motif. Match to the target motif is measured according to the dynamic programming method of Sandelin et al. [25] (see Section 3.2). From these plots, it is evident that solutions with a reasonable match to the target motif but with low fitness are usually found in the initial population and that, during evolution, both match and fitness increase in the majority of cases. On average, at the end of a run, the fitness of the closest match is at least as high as that of the target motif. In general, throughout evolution, the closest match to the target motif has lower fitness than the fittest motif found within the population.
4.2 Synthetic Data with Multiple Motifs
We carried out 40 runs of 150 generations on the synthetic data set containing eight embedded motifs, using a population size of 2,000. Table 4 gives the results from five of these runs, showing motifs in the final populations which bore the closest resemblance to the embedded motifs. In most cases, there is a good match between the discovered motifs and the embedded motifs in all of the runs. SPI-B has a relatively poor match, though this is unsurprising due to its low information content and short defining length. RXR-VDR is the only high information content motif which is not well characterized. This may be due to interference from the other nuclear receptor motifs. In general, there is a tendency to capture only the most significant regions of the long, high information content motifs, possibly because the full length is not required to differentiate between the data set and the background sequences. With the exception of low information content flanking regions, the defining lengths of the shorter motifs—HLF, FOXI1, and NFKB1—are generally well characterized.
These observations are reflected in Fig. 3, which shows the mean target matches and fitnesses across all 40 runs. It can be seen that, with the exception of SPI-B, on average, both the match to the embedded motifs and the fitness of
[image:9.612.104.467.119.313.2]LONES AND TYRRELL: REGULATORY MOTIF DISCOVERY USING A POPULATION CLUSTERING EVOLUTIONARY ALGORITHM 409
TABLE 3
Results for Synthetic Data Sets with Single Embedded Motifs Evolved with Given Population and Background Sequence Set Sizes, Showing Percentage of Successful Runs, Mean Length of Evolved Motif
Fig. 2. Evolution of motifs for synthetic data sets. (a) HFH-1 length 5,000. (b) HLF length 1,500. (c) c-FOS length 1,500. The top row shows mean closest match to the target motif during evolution. The bottom row shows mean fitness during evolution of fittest motif in population (“best”) and motif with closest match to the target motif (“closest”), also showing the fitness of the target motif (“target”). Error bars show standard deviation.
TABLE 4
Motifs Discovered in the Synthetic Data Set with Multiple Embedded Motifs during Five Consecutive Runs of the PCEA
The embedded JASPAR motifs are shown in column headers.
the closest matching solution increases during evolution. Fig. 3 also shows how the clustered population supports a wide range of fitness levels during evolution. This diversity is depicted in Fig. 4, which shows the clusters within the population of one of the runs at generation 60. Even at this stage, the population still displays a wide diversity in terms of both solution content and solution fitness, with the fittest clusters mostly containing versions of the JASPAR motifs, whereas other clusters generally contain suboptimal var-iants of the fittest solutions.
4.3 Muscle-Specific Data Set
We carried out 20 runs of 150 generations upon Wasser-man and Fickett’s muscle-specific data set with a population size of 4,000. Motifs discovered in each run were then scored against the test set. Any which scored poorly against these sequences were rejected, since such motifs are more likely to reflect spurious overrepresented patterns in Wasserman and Fickett’s data set rather than true muscle-specific TFBSs. The remaining motifs were then manually grouped by similarity and the best examples of each (measured by test set score) were kept, leaving the most significant motifs found by the algo-rithm. Appendix A (which can be found on the Computer Society Digital Library at http://computer.org/tcbb/ archives.htm) gives examples of motifs discovered in this fashion for the first five runs. Table 5 gives examples of each kind of motif discovered during the runs. Motifs 1-5 in Table 5 bear a clear resemblance to known instances of the five regulatory motifs identified by Wasserman and Fickett as occurring within this data set [30], [35]. Motif 6 closely resembles the binding site for MyoD, another known
muscle-specific transcription factor which has also been previously identified within Wasserman and Fickett’s data set. Motif 7 bears a limited resemblance to the binding site for TEF, although it may be unrelated, and Motif 8 bears little resemblance to any well known muscle-specific TFBS. Of the 20 total runs, binding sites for MEF2, Sp1 and motif 8 were found in all 20 runs, those for MyoD and motif 7 were found in 19 runs, SRF was found in 18 runs, and Myf was found in 15 runs. The relative difficulty of finding the binding site for Myf may be due to its similarity to that of MyoD, which has a comparatively well-conserved central region.
5
D
ISCUSSIONThese results demonstrate that the PCEA is able to discover motifs in relatively long DNA promoter sequences of up to 5 kb and discover multiple motifs, both strongly and weakly conserved, within a single run. The former is shown by Table 6, which compares the results from Section 4.1 with those of Down and Hubbard [6] when using the data sets described in Section 3.6.1. For each of the three motifs, the PCEA is able to find embedded motifs in data sets which NestedMICA and MEME (with standard parameter settings for this kind of problem) failed to solve and within data sets comprising sequences of significantly longer lengths. In the case of HFH-1, which has relatively high information content, the PCEA was able to consistently discover motifs in sequences more than four times longer than those solvable by NestedMICA and MEME.
Results from the experiments using synthetic sequences with multiple embedded motifs (Section 4.2) illustrate the
[image:11.612.97.475.70.337.2]LONES AND TYRRELL: REGULATORY MOTIF DISCOVERY USING A POPULATION CLUSTERING EVOLUTIONARY ALGORITHM 411
PCEA’s ability to maintain a diverse population of solutions yet still optimize individual solutions. This is also demon-strated by results from the muscle-specific data set (Section 4.3) in which the PCEA discovered instances of most of the well-known muscle TFBSs in most of the runs. This compares well against DME, which Smith et al. [30] report to have discovered three well-known muscle regulatory motifs within the Wasserman and Fickett data set. These are reproduced in Table 7, which also gives match statistics using the same metric as the PCEA results in Table 5. It is notable that there is a high degree of resemblance between the versions of MEF2 and SRF discovered by the PCEA and DME. Although the version of MyoD discovered by the PCEA appears to offer better descrimination of the EPD test set from the background set, it should be noted that this difference may be heightened by our choice of scoring metric, which differs from that used by Smith et al.
Repeatability is an important issue for stochastic algo-rithms. In general, we have found that, with a sufficiently large population size, there is a high degree of similarity between runs. This is demonstrated by the high success rates for most of the experiments in Section 4.1 and the self-similarity between discovered motifs in experiments invol-ving multiple motifs (e.g., Table 4). However, in practice it would be harder to determine a suitable population size
unless some knowledge of a regulatory motif’s information content was available in advance. As such, we would recommend using the largest population size possible (taking into account constraints on time and computational resources) in order to reduce the likelihood of missing poorly conserved motifs. Execution time is dominated by solution evaluation and, consequently, grows linearly with each of population size, number of generations, motif length, sequence length, and data set sizes. For example, on an Intel 2 GHz core duo machine (running Mac OS, with the algorithm implemented in Java and using multithreaded evaluation) execution time was approximately 2 hours per run for the multiple motif synthetic data set, approximately 1 day per run for the muscle data set, and approximately 4 days per run for the HFH-1 data set with sequences of length 5,000 and a population of 4,000.
[image:12.612.91.479.93.274.2] [image:12.612.93.478.95.274.2]An interesting property of the PCEA approach is its ability to identify multiple motifs within a single run. With more conventional approaches, identification of multiple motifs is typically done over a succession of runs, masking those motifs found in earlier runs from the data sets of later runs. One advantage of the PCEA’s parallel motif discovery approach is that it removes the need to run the algorithm an unknown number of times in order to filter out strong
TABLE 5
Summary of Results from Running the PCEA upon the Muscle Data Sets
[image:12.612.69.238.695.757.2]W&F, EPD, and bg indicate percentage of sequences matched in the Wasserman and Fickett, EPD muscle, and background sets, respectively. A match was determined by a value above 80 percent of the corresponding PWM’s best possible match value. Right-hand columns show similarity to known muscle TFBSs, showing transcription factor name, database ID, and sequence logo. IDs of the form MAxxxx refer to JASPAR records, and those of the form Mxxxxx refer to entries in the transfac matrix database.
TABLE 6
Maximum Sequence Lengths for which Motifs Could Be Identified
TABLE 7
motifs and their variants before weak motifs can be identified. However, it also introduces the potential to make use of cooccurrence information during search in order to identify motifs that are too weak to be identified individually. In future work, we plan to look at how the PCEA may form the basis of a combinatorial motif discovery system, using coevolution to search for regula-tory motifs and rules describing their interactions.
6
C
ONCLUSIONSWe have described an evolutionary algorithm that applies data clustering between generations to partition the population into demes for mating purposes. This approach is designed to maintain solution diversity within the population, avoiding premature convergence while search-ing for multiple solutions in parallel. Such behavior is particularly appropriate for the kind of multimodal search spaces found in motif discovery problems.
Through a series of experiments, we have shown how this evolutionary algorithm can be applied to the problem of regulatory motif discovery in DNA sequences. Our results demonstrate that the algorithm is able to find and characterize motifs in relatively long promoter sequences when compared to other algorithms. The results also show that the algorithm is able to discover multiple motifs within a single run while accurately characterizing motifs found in real biological data sets. We have speculated how this inherent parallel discovery might form the basis for a combinatorial motif discovery system.
In a recent paper [18], we suggested that evolutionary algorithms have three characteristics that make them suitable for motif discovery: global search that is neither exhaustive nor biased by specific heuristics, representational flexibility, and no dependence between the way in which solutions are derived and the way in which they are scored. In this paper, we have concentrated on the first of these, showing how an evolutionary algorithm with suitable population manage-ment can be used to effectively discover motifs in biological sequences. In future work, we plan to look at how the representational flexibility of evolutionary algorithms may allow the development of more accurate motif and regula-tory models for motif discovery.
A
CKNOWLEDGMENTSThe authors would like to thank Finn Drabløs, Osman Abul, and the anonymous reviewers for their helpful comments, as well as Albin Sandelin for providing code for the matrix comparison algorithm. The clustering diagram in Fig. 4 was generated using JUNG, the Java Universal Network/Graph Framework, available at http://jung.sourceforge.net/.
R
EFERENCES[1] T.L. Bailey and C. Elkan, “Fitting a Mixture Model by Expectation Maximization to Discover Motifs in Biopolymers,”Proc. Int’l Conf. Intelligent Systems for Molecular Biology,vol. 2, pp. 28-36, 1994.
[2] M. Brameier, J. Haan, A. Krings, and R. MacCallum, “Automatic Discovery of Cross-Family Sequence Features Associated with Protein Function,”BMC Bioinformatics,vol. 7, p. 16, 2006.
[3] E. Cantu´-Paz, “Designing Efficient and Accurate Parallel Genetic Algorithms,” PhD dissertation, Univ. of Illinois at Urbana-Champaign, 1999.
[4] C.B. Congdon, C. Fizer, N.W. Smith, H.R. Gaskins, J. Aman, G.M. Nava, and C. Mattingly, “Preliminary Results for GAMI: A Genetic Algorithms Approach to Motif Inference,” Proc. IEEE Symp. Computational Intelligence in Bioinformatics and Computational Biology (CIBCB ’05),pp. 97-104, 2005.
[5] D. Corne, A. Meade, and R. Sibly, “Evolving Core Promoter Signal Motifs,” Proc. Congress Evolutionary Computation (CEC ’01), pp. 1162-1169, May 2001.
[6] T.A. Down and T.J.P. Hubbard, “NestedMICA: Sensitive Inference of Over-Represented Motifs in Nucleic Acid Sequence,”Nucleic Acids Research,vol. 33, no. 5, pp. 1445-1453, 2005.
[7] G. Fogel, D. Weekes, G. Varga, E. Dow, H. Harlow, J. Onyia, and C. Su, “Discovery of Sequence Motifs Related to Coexpression of Genes Using Evolutionary Computation,”Nucleic Acids Research, vol. 32, no. 13, pp. 3826-3835, 2004.
[8] Evolutionary Computation in Bioinformatics, G.B. Fogel and D.W. Corne, eds. Morgan Kaufmann, 2002.
[9] R. Fry, S. Smith, and A. Tyrrell, “A Self-Adaptive Mate Selection Model for Genetic Programming,” Proc. IEEE Congress Evolu-tionary Computation (CEC ’05),vol. 3, pp. 2707-2714, 2005.
[10] K. Grote, R. Schneider, and T. Werner, “Kohonen Maps Are Suitable for a Biologically Meaningful Classification of Transcrip-tion Factor Binding Site Matrices,”Proc. German Conf. Bioinfor-matics (GCB ’99),1999.
[11] J. Hartigan,Clustering Algorithms.John Wiley & Sons, 1975.
[12] A. Heddad, M. Brameier, and M. MacCallum, “Evolving Regular Expression-Based Sequence Classifiers for Protein Nuclear Loca-lisation,”Applications of Evolutionary Computing, Proc. EvoWork-shops ’04,pp. 31-40, Apr. 2004.
[13] D. Howard and K. Benson, “Evolutionary Computation Method for Pattern Recognition of Cis-Acting Sites,”Biosystems,vol. 72, nos. 1-2, pp. 19-27, Nov. 2003.
[14] J. Hu, B. Li, and D. Kihara, “Limitations and Potentials of Current Motif Discovery Algorithms,” Nucleic Acids Research, vol. 33, no. 15, pp. 4899-4913, 2005.
[15] Y.-J. Hu, “Biopattern Discovery by Genetic Programming,”Proc. Genetic Programming Conf.,J.R. Koza et al., ed., pp. 152-157, 1998.
[16] T. Kamada and S. Kawai, “Automatic Display of Network Structures for Human Understanding,” Technical Report 88-007, Dept. of Information Science, Univ. of Tokyo, 1988.
[17] K.J. Kechris, E. van Zwet, P.J. Bickel, and M.B. Eisen, “Detecting DNA Regulatory Motifs by Incorporating Positional Trends in Information Content,”Genome Biology,vol. 5, no. 7, p. R50, 2004.
[18] M.A. Lones and A.M. Tyrrell, “The Evolutionary Computation Approach to Motif Discovery in Biological Sequences,” Proc. Genetic and Evolutionary Computation Conf. (GECCO) Workshop Program, Workshop Biological Applications of Genetic and Evolutionary Computation,F. Rothlauf, ed., pp. 1-11, June 2005.
[19] V. Matys, E. Fricke, R. Geffers, E. Gssling, M. Haubrock, R. Hehl, K. Hornischer, D. Karas, A.E. Kel, O.V. Kel-Margoulis, D.-U. Kloos, S. Land, B. Lewicki-Potapov, H. Michael, R. Mu¨nch, I. Reuter, S. Rotert, H. Saxel, M. Scheer, S. Thiele, and E. Wingender, “TRANSFAC: Transcriptional Regulation, from Patterns to Pro-files,”Nucleic Acids Research,vol. 31, no. 1, pp. 374-378, Jan. 2003.
[20] R. Prier, V. Praz, T. Junier, C. Bonnard, and P. Bucher, “The Eukaryotic Promoter Database (EPD),” Nucleic Acids Research, vol. 28, pp. 302-303, 2000.
[21] P. Qiu, “Recent Advances in Computational Promoter Analysis in Understanding the Transcriptional Regulatory Network,” Bio-chemical and Biophysical Research Comm.,vol. 309, no. 3, pp. 495-501, Sept. 2003.
[22] I. Rigoutsos and A. Floratos, “Combinatorial Pattern Discovery in Biological Sequences: The TEIRESIAS Algorithm,”Bioinformatics, vol. 14, no. 1, pp. 55-67, 1998.
[23] B.J. Ross, “The Evolution of Stochastic Regular Motifs for Protein Sequences,”New Generation Computing,vol. 20, no. 2, pp. 187-213, Feb. 2002.
[24] A. Sandelin, W. Alkema, P. Engstro¨m, W.W. Wasserman, and B. Lenhard, “JASPAR: An Open-Access Database for Eukaryotic Transcription Factor Binding Profiles,” Nucleic Acids Research, vol. 32, pp. D91-D94, Jan. 2004.
[25] A. Sandelin, A. Ho¨glund, B. Lenhard, and W.W. Wasserman, “Integrated Analysis of Yeast Regulatory Sequences for Biologi-cally Linked Clusters of Genes,” Functional and Integrative Genomics,vol. 3, no. 3, pp. 125-134, July 2003.
[26] G.K. Sandve and F. Drabløs, “A Survey of Motif Discovery Methods in an Integrated Framework,” Biology Direct, vol. 1, no. 11, 2006.
[27] B. Sareni and L. Kra¨henbu¨hl, “Fitness Sharing and Niching Methods Revisited,”IEEE Trans. Evolutionary Computation,vol. 2, pp. 97-106, 1998.
[28] L. Schnitman and T. Yoneyama, “A Clustering Method for Improving the Global Search Capability of Genetic Algorithms,” Proc. Sixth Brazilian Symp. Neural Networks (SBRN ’00), F.M.G. Franc¸a and C.H.C. Ribeiro, eds., pp. 32-37, 2000.
[29] C. Shyu, L. Sheneman, and J.A. Foster, “Multiple Sequence Alignment with Evolutionary Computation,”Genetic Programming and Evolvable Machines,vol. 5, no. 2, pp. 121-144, 2004.
[30] A.D. Smith, P. Sumazin, and M.Q. Zhang, “Identifying Tissue-Selective Transcription Factor Binding Sites in Vertebrate Promo-ters,” Proc. Nat’l Academy Sciences of the USA, vol. 102, no. 5, pp. 1560-1565, Feb. 2005.
[31] G. Stormo, “DNA Binding Sites: Representation and Discovery,” Bioinformatics,vol. 16, no. 1, pp. 16-23, Jan. 2000.
[32] F. Streichert, G. Stein, H. Ulmer, and A. Zell, “A Clustering Based Niching Method for Evolutionary Algorithms,”Proc. Genetic and Evolutionary Computation Conf. (GECCO ’03), E. Cantu´-Paz, J.A. Foster, K. Deb, D. Davis, R. Roy, U.-M. O’Reilly, H.-G. Beyer, R. Standish, G. Kendall, S. Wilson, M. Harman, J. Wegener, D. Dasgupta, M.A. Potter, A.C. Schultz, K. Dowsland, N. Jonoska, and J. Miller, eds., pp. 644-645, July 2003.
[33] W. Thompson, E.C. Rouchka, and C.E. Lawrence, “Gibbs Recursive Sampler: Finding Transcription Factor Binding Sites,” Nucleic Acids Research,vol. 31, no. 13, pp. 3580-3585, July 2003.
[34] M. Tompa, N. Li, T.L. Bailey, G.M. Church, B.D. Moor, E. Eskin, A.V. Favorov, M.C. Frith, Y. Fu, W.J. Kent, V.J. Makeev, A.A. Mironov, W.S. Noble, G. Pavesi, G. Pesole, M. Rgnier, N. Simonis, S. Sinha, G. Thijs, J. van Helden, M. Vandenbogaert, Z. Weng, C. Workman, C. Ye, and Z. Zhu, “Assessing Computational Tools for the Discovery of Transcription Factor Binding Sites,” Nature Biotechnology,vol. 23, no. 1, pp. 137-144, Jan. 2005.
[35] W.W. Wasserman and J.W. Fickett, “Identification of Regulatory Regions which Confer Muscle-Specific Gene Expression,” J. Molecular Biology,vol. 278, no. 1, pp. 167-181, Apr. 1998.
[36] T. Werner, “The State of the Art of Mammalian Promoter Recognition,” Briefings Bioinformatics, vol. 4, no. 1, pp. 22-30, Mar. 2003.
[37] K.-J. Won, A. Pru¨gel-Bennett, and A. Krogh, “Training HMM Structure with Genetic Algorithm for Biological Sequence Analy-sis,”Bioinformatics,vol. 20, no. 18, pp. 3613-3619, Dec. 2004.
[38] G.A. Wray, M.W. Hahn, E. Abouheif, J.P. Balhoff, M. Pizer, M.V. Rockman, and L.A. Romano, “The Evolution of Transcriptional Regulation in Eukaryotes,”Molecular Biology and Evolution,vol. 20, no. 9, pp. 1377-1419, Sept. 2003.
[39] T. Yada, M. Ishikawa, H. Tanaka, and K. Asai, “Extraction of Hidden Markov Model Representations of Signal Patterns in DNA Sequences,”Proc. Pacific Symp. Biocomputing,pp. 686-696, 1996.
Michael A. Lonesreceived the MEng (honors) degree in computer systems and software engineering in 1999 from the Department of Computer Science, University of York. He went on to receive the PhD degree from the Depart-ment of Electronics in 2004. In 2004, he received an ERCIM fellowship to carry out research in the bioinformatics group of the Faculty of Medicine, Norwegian University of Science and Technol-ogy (NTNU). Since 2005, he has been a research associate within the Intelligent Systems research group of the Department of Electronics, University of York. His research interests include biologically motivated models of computation, evolutionary algorithms, bioinformatics, and the study of evolvability. He is a member of the IEEE and the IEEE Computational Intelligence Society.
Andy M. Tyrrellreceived the first class honors degree in 1982 and the PhD degree in 1985, both in electrical and electronic Engineering. He joined the electronics Department at York University in April 1990, and he was promoted to the Chair of Digital Electronics in 1998. Prior to that, he was a senior lecturer at Coventry Polytechnic. Between August 1987 and August 1988, he was a visiting research fellow at Ecole Polytechnic Lausanne, Switzerland, where he researched the evaluation and performance of multiprocessor systems. From September 1973 to September 1979, he worked for STC at Paignton Devon on the design and development of high frequency devices. His main research interests are in the design of biologically inspired architectures, artificial immune systems, evolvable hardware, FPGA system design, parallel systems, fault tolerant design, and real-time systems. In particular, over the last six years, his research group at York University has concentrated on bioinspired systems. This work has included the creation of embryonic processing array, intrinsic evolvable hardware systems, and the immunotronics hardware architecture. He is the head of the Intelligent Systems Research Group at York University and a department head. He was general program chair for ICES ’03 and program chair for IPCAT ’05. He has published more than 180 papers in these areas and has attracted funds in excess of 2.1 million British pounds. He is a senior member of the IEEE and a fellow of the IET.
![Fig. 4. Clusters within a population. Clusters are represented by their fittest motif, relative fitness is shown by motif size, and the layout is amultidimensional scaling of intercluster distances, produced by the Kamada-Kawai force-directed method [16]](https://thumb-us.123doks.com/thumbv2/123dok_us/8082446.229230/11.612.97.475.70.337/clusters-population-clusters-represented-relative-amultidimensional-intercluster-distances.webp)