V4
R&D, Innovation and Exporting: Evidence from UK new
technology based firms
By
Panagiotis Ganotakis and James H Love
RP 0922
Panagiotis Ganotakis and James Love Aston Business School
Aston University Birmingham B4 7ET
ganotap1@aston.ac.uk j.h.love@aston.ac.uk
October 2009
ISBN No: 978-1-85449-762-8
Aston Academy for Research in Management is the administrative centre for all research activities at Aston Business School. The School comprises more than 70 academic staff organised into thematic research groups along with a Doctoral
Programme of more than 50 research students. Research is carried out in all of the major areas of business studies and a number of specialist fields. For further information contact:
The Research Director, Aston Business School, Aston University, Birmingham B4 7ET
Telephone No: (0121) 204 3000 Fax No: (0121) 204 3326 http://www.abs.aston.ac.uk/
Aston Business School Research Papers are published by the Institute to bring the results of research in progress to a wider audience and to facilitate discussion. They will normally be published in a revised form subsequently and the agreement of
Abstract
We examine the relationship between R&D, innovation and exporting for a sample of new technology based firms (NTBFs) in the UK. Allowance is made for selection bias and for endogeneity between innovation and exporting. Innovators are more likely to export, but conditional on entering export markets successful innovation does not increases subsequent export intensity. Lagged productivity is strongly associated with exporting, supporting the view that efficient firms are better able to overcome the barriers to entering export markets. We also find strong evidence of the importance of internal R&D and of supply-chain collaborations in fostering innovation, and that formal commercial collaborations can be important in overcoming the (information) sunk costs of entering export markets. The use of e-commerce does nothing to boost entry into export markets, but the intensity of its use is associated with increased export intensity.
Key words: R&D, innovation, exporting, e-commerce, sample selection
JEL classification: F14, L25, O32
Acknowledgements
1. Introduction
There are sound reasons for expecting a positive association between innovation and export performance. From early product-cycle models in which (exogenous)
innovation as a key driver of exports (Vernon 1966) to more recent models which consider the possibility of the reverse effect in an endogenous growth framework (Grossman and Helpman 1991a,b), theorists have predicted a positive association between innovation and exporting at the macro level. Internationally, there is also evidence of a link between international activity and innovation at the firm level. For example, using data gained from innovation surveys in many countries, the OECD Innovation Microdata project shows that the proportion of firms which are innovative is substantially higher for firms operating in international markets than for firms operating in domestic markets only (Onodera 2008). This suggests that exposure to international markets is strongly linked to innovation, but of course says nothing about the direction of causality.
Recent empirical work has considered the microeconomics of the interaction between innovation activity and exporting. While this has become increasingly sophisticated, partly as a result of the availability of better firm-level datasets, the empirical
literature generally regards R&D and innovation as interchangeable, and typically considers the relationship between R&D and exporting rather than between
innovation and exporting (Aw et al 2007; Girma et al 2008; Harris and Li 2009)1. By contrast we consider the relationship between innovation output and exporting, while allowing for the role of R&D in determining innovation. We consider this to be more appropriate conceptually; what really matters for exporting is innovation rather than R&D, because the ability to compete in international markets is ultimately influenced by the firm’s capacity to successfully market new and improved products, rather than its investment in research activity. This may be especially true for SMEs, where formal R&D measures markedly under-report their research activity and degree of innovativeness (Kleinknecht 1987).
We use data derived from a survey of UK new technology based firms (NTBFs). These are relatively young, independently-owned SMEs operating in high technology sectors (Tether and Storey, 1998). This is a particularly interesting group to consider in terms of the innovation-exporting relationship. NTBFs are firms that operate mainly in highly innovative (high-tech) sectors, and tend to be high-growth firms for which overseas markets play an important role (Acs and Audretsch, 1987; Lynskey, 2004). They also tend to be at the forefront of the use of new technology such as e-commerce, a potentially major issue for small firms seeking to overcome the sunk costs of exporting. Although the dataset is relatively small, it has the advantage of having indicators for several dimensions of interest in the exporting-innovation nexus, such as the technical and commercial linkages with outside agencies (a proxy for information sunk costs), and the firms’ use of the internet in sales activity.
Specifically, we are able to differentiate between two forms of external knowledge linkages: technical ones linked specifically to innovation, and more general
commercial linkages related to sales activity generally, and so by implication to export activity
In the empirical analysis we first estimate the determinants of innovation allowing for internal and external R&D and external collaborations. This is followed by
estimating innovation’s effect on exporting allowing both for endogeneity of innovation and sample selection in exporting, as well as the effects of e-commerce and collaborative agreements on both exporting and its extent. We find that innovators are substantially more likely to export. Lagged productivity is strongly associated with exporting, supporting the view that efficient firms are better able to overcome the barriers to entering export markets. We also find strong evidence of the importance of internal R&D and of supply chain collaborations in fostering
innovation, and that formal commercial collaborations can be important in
overcoming the (information) sunk costs of entering export markets. The use of e-commerce does nothing the boost entry into export markets, but the intensity of its use is strongly associated with increased export intensity.
.
2. Background to the R&D/Innovation-Exporting Relationship
2.1 Theory
Two main conceptual approaches exist to modelling the determinants of export performance, (Wakelin, 1998). ‘neo-endowment’ models in which firms' competitive advantage is based on factor endowments and, 'technology-based' models in which competitive advantage derives from the quality of firms' products or services. Both of these imply a positive link between R&D or innovation and exporting. Studies in the neo-endowment tradition argue that factor-based advantages may be important if the firm has either a natural monopoly of a particular factor or is, for example, located in a particular region where a factor is plentiful. Extending the more traditional range of factors included in such models beyond labour and capital to include different
dimensions of human and organisational resources, emphasises the parallels between this type of explanation and resource-based models of company competitiveness.
Technology-based models of export performance focus primarily on firms’
investments or achievements in implementing new technologies, or the development of new products or processes. This capability will depend on the internal strengths of the plant, where applicable its links to other group companies, and on the support available from the regional or national innovation system within which the firm is operating (Nelson, 1993; Metcalfe, 1997). The presence of an R&D function within a plant, for example, may stimulate innovation through the type of technology-push process envisaged in linear models of innovation. R&D staff may also, however, contribute to firms’ creativity as part of multi-functional groups, or may allow firms to utilise extra-mural networks or information sources more effectively (Veugelers and Cassiman, 1999; Love and Roper, 2001). Braunerhjelm (1996), for example, provides evidence from Sweden that R&D expenditures and investment in skilled labour both have a positive effect on firms’ export intensity, while more conventional cost factors have no effect.
Helpman (1991a,b) recognise the possibility of causality running from exporting to R&D and innovation. The channels for this are threefold. First, the stronger
competition in foreign markets forces firms to invest in R&D in order to improve both products and processes and thus remain competitive. This may also include the need for a firm to undertake R&D (especially development work) in order to adapt to a different set of requirements in a foreign country, such as different technical standards. Second, there is the possibility of ‘learning by exporting’, principally involving being exposed to superior foreign knowledge and technology which also helps to boost the productivity of exporting firms (Kobrin 1991; Grossman and Helpman 1991a). Policymakers frequently regard this as an important element of the benefits of exporting: indeed, the World Bank regards the transmission of tacit and (occasionally) proprietary knowledge from customers and suppliers to exporters as an important dimension of export-led growth for developing economies (World Bank, 1993). Finally, scale effect may be important. Exporting extends the market over which margins may be earned, and since R&D costs are largely fixed, such
investments may be recouped over a larger sales volume. This aids productivity, and provides greater incentives to invest in R&D and innovation.
2.1 Empirical literature: effect of R&D/innovation on exports
Empirical studies of the link between R&D, innovation and export performance are dominated by manufacturing, and the majority implicitly assume causality running from innovation to exports. Several early time-series studies for the UK at the
industry level found positive links between R&D and patent counts to industry export performance (Buxton et al 1991; Greenhalgh 1990; Greenhalgh et al 1994).
Subsequent firm-level studies have maintained this orientation, and have the advantage of being able to allow for heterogeneity between exporters and non-exporters. Generally such studies find that there are indeed significant differences between manufacturing exporters and non-exporters, and generally find a positive link between innovation and exporting in a variety of countries including the UK, Canada, Italy, Ireland and Germany (Wakelin 1998; Lefebvre and Lefebvre 2001; Sterlacchini 1999; Bleaney and Wakelin 2002; Roper and Love 2002; Lachenmaier and Wößmann 2006; Roper et al 2006).
Direct evidence on the link between R&D/innovation and exports in services is much more restricted. Gourlay et al (2006) study the determinants of export behaviour for a panel of over 1000 UK service firms for the period 1988 to 2001. They use R&D intensity (R&D expenditure as a percentage of sales) as an indicator of innovation i.e. an input rather than an output measure of innovation, and find that R&D intensity has strong positive effect on both the probability and intensity of exporting. By contrast, Love and Mansury (2009) employ a direct measure of innovation (whether the firm has produced at least one new service) in their study of exporting in US business services. They also find that innovation has a strong positive effect on the probability of exporting, but unlike Gourlay et al, they find a negative effect on export intensity, conditional on being an exporter.
981 manufacturing firms in Germany, and use a set of ‘impulses’ (i.e. push factors) and impediments to innovation as instruments to perform IV estimation of exporting with innovation as an endogenous determinant. They find that innovators have an export share on average 12.6 percentage points higher than those of non-innovators, and that slightly more than half of this can be attributed to the effect of innovation on exports. By using careful controls for industry sectors, they conclude that “..being innovative causes firms to have substantially larger export shares than non-innovative firms in the same sector.” (p. 346).
Harris and Li (2009) take a different approach to the endogeneity issue, employing a two-stage Heckman approach coupled with simultaneous estimation to allow for joint endogeneity of exports and R&D. They combine data from the UK element of the CIS3 and the ARD, and perform estimations for both manufacturing and services. The key findings are that (endogenous) R&D plays a substantial role in helping
establishments become exporters, but conditional on entering export markets, R&D expenditure does not increase export intensity. Harris and Li also find that absorptive capacity (i.e. the ability to absorb externally generated knowledge) plays an important role in overcoming entry barriers to internationalization, mainly through
complementarity with R&D.
However, not all firm-level studies find a positive association running from R&D/innovation to exporting. Specifically, a number of studies have found an insignificant relationship between R&D investment and export intensity (e.g.
Lefebvre et al 1998; Sterlacchini; 2001). This leads to the suggestion that what really matters for exporting is innovation (both product and process) rather than R&D,
because the ability to compete in international markets is ultimately influenced by the firm’s capacity to compete internationally, rather than its investment in research activity. This may be especially true for SMEs, where formal R&D measures markedly under-report their research activity and degree of innovativeness (Kleinknecht 1987).
2.2 Empirical literature: effect of exporting on innovation/R&D
Some early studies of the determinants of innovation simply used exporting as a conditioning variable without consideration of any degree of endogeneity between them (e,g, Veugelers and Cassiman 1999). While this can be taken as an indication of positive association, more recent studies have tended to be couched in terms of
endogenous innovation and growth theories, and have either explicitly or implicitly allowed for some degree of two-way interaction.
Many of these studies involve emerging or developing economies, which may be hypothesised as those which have most to gain technological catch-up and learning-from-exporting effects. For example, the technology-gap model used by Hobday (1995) in a study of latecomer firms in the context of East Asian electronics illustrates how innovation rates are accelerated by foreign consumer demand and a firm's
exporting activities. He shows that knowledge is cumulative and its progression pushes forward a firm's growth trajectory. And in a study of the Taiwanese electronics industry, Aw et al (2007) find that exporting significantly boosts productivity,
firm investing in R&D. They conclude that exporters need to produce effective R&D or training in order to generate efficiency gains: exporting alone is not enough. Zhao and Li (1997) also find a two-way relationship between export intensity and R&D expenditure in a sample of Chinese firms.
Empirical studies from Western economies are relatively few. An exception is Girma, Gorg and Hanley (2008), who examine the two-way relationship between R&D and exports using British (BERD, ONS) and Irish firm-level data (Forfás) as comparison. They initially adopt a bivariate probit framework that permits modelling of the export and R&D decisions simultaneously, and subsequently replace the dichotomous export and R&D variables with their truncated counterparts (i.e. intensities) and estimate simultaneously using 3SLS. The key findings are: first, exporting stimulates R&D for Irish firms, but not for British firms. Second, exporting status matters, not exporting intensity.
Girma et al explain the differences between the UK and Irish findings in three ways. First, firms in the two countries have different starting points: Irish firms export at an earlier stage than British firms, so have more to learn from becoming exporters Second, the destinations of outputs are different: Irish firms export to more
(relatively) advanced economies, hence have more to learn from exporting. Finally, being an exporter is what appears to matter for enhancing a firm's knowledge, not the extent to which a firm exports. Potentially another reason for the different results is that the study compares two quite different datsets, and the issue of BERD data including only firms believed to be engaged in R&D activity.
As with the innovation-exporting research reviewed above, service sector studies are very few. Blind and Jungmittag (2004) examine the effect of exporting on innovation in German services . Their cross-sectional analysis of 2,019 service firms finds evidence that being an exporter is strongly correlated with the probability both of being a product innovator and of being a process innovator. Love et al (2010) examine how Northern Ireland service firms’ innovation activity relates to
productivity and export behaviour. Their analysis is based on matched data from the 2005 UK Innovation Survey – the UK component of the Fourth Community
Innovation Survey – and the Annual Business Inquiry for Northern Ireland. Echoing some of the findings of Aw et al (2007) and Girma et al (2008) they find that R&D, firm size, newness and innovation-related training and investment increase innovation outputs. Relationships between innovation, exporting and productivity prove complex but suggest that innovation itself is not sufficient to generate productivity
improvements: only when innovation is combined with increased export activity are productivity gains evident.
3. Data and Method
3.1 Dataset
firms, as well as performance data including exporting behaviour and finally
information on the backgrounds of the founders. Export data were obtained for 2004, with innovation data for the period 2001-04.
For a number of reasons NTBFs are a particularly interesting set of companies with which to examine the relationship between R&D, innovation and exporting. First, NTBFs achieve high rates of growth mainly due to their ability successfully to introduce often radically innovative products and services to the market (Acs and Audretsch, 1987; Lynskey, 2004) which can even lead to the creation of new industries (Shearman and Burrell, 1998; Oakey, 2003). Innovation is thus often central to their survival and competitive advantage. Second, like many SMEs generally, standard measure of innovation input such as R&D expenditure may understate their level of research activity and innovativeness (Kleinknecht 1987). Methodologically, this suggest that the effects of innovation outputs on exporting is
central, and that allowance should be made for other sources of knowledge inputs in estimating the determinants of innovation (Roper et al 2008).
Finally, NTBFs can also be expected to be at forefront of using new technology in business operations, especially the use of the internet. This is a major issue for
relatively small firms entering export markets, because geographical distance seems to matter even in the digital age: Blum and Goldfarb (2006) find that distance matters even for digitally-traded goods such as music and games. The adoption and wider usage of e-commerce should assist SMEs in gaining instant access to international markets at a cost effective way, while at the same time increasing their share at the domestic but also local markets (Fillis et al., 2003; 2004). This allows SMEs to overcome some of the cost advantages that larger companies enjoy (Santarelli and Altri, 2003) and compete with them directly in both domestic and foreign markets by bypassing some of the intermediary linkages and reducing therefore the need to invest for the development of expensive marketing and distribution channels or to use the services of a specialized dealer (Molla and Licker, 2005). Using a cost-effective method to reach customers from a single location is especially important for NTBFs, as they usually operate in specialist markets which means that their potential
customers are likely to be spread all over the globe (Santarelli and Altri, 2003).
In order to identify the UK high technology sectors an approach similar to that used by Butchard (1987)2 was followed, based on the twin criteria of firms with high R&D intensity (measured as R&D expenditure over the amount of sales or value added) and firms with a high proportion of scientists and engineers who spend the majority of their time in R&D activities. By using the OECD STAN indicators and the ‘Research & Development in the UK’ (2002) published by the Office of National Statistics, the expenditure over sales as well as the R&D expenditure over value added criterion was
used, for each sector according to the UK SIC classification3. The ratio of scientists and engineers who spend the majority of their time in R&D activities over total employment was also calculated by using the ONS MA_14 reports and the STAN indicators. The categorization of companies according to the independence criterion was done by using FAME (Financial Analysis Made Easy), a database that contains contact details of all the limited UK companies and their directors, which can also be used to isolate the companies where individual owners own more than 50% equity.
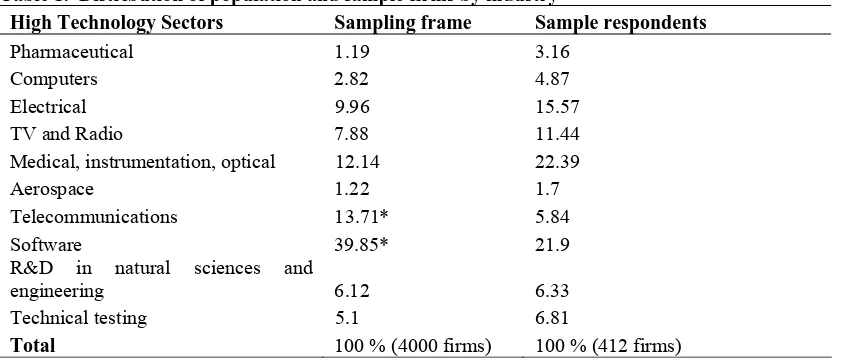
The second step in the sampling frame involved the stratification of companies according to age and size for each high-tech sector4. This led to an initial calibrated semi-proportional random sample of 4000 companies selected from the high-tech sector population5 (see Table 1 column 1). Data were collected by postal
questionnaires between April and July 2005, following interviews with five entrepreneurs (five companies) in order to receive feedback on the clarity of the questions included in the questionnaire and a pilot study of 100 NTBFs. Of the original sample of 4000 companies 412 companies took part in the survey. All questionnaires were answered by one of the firms’ founders.
The distribution of the response rate across the industries identified as high-tech is illustrated in Table 1. On initial examination a chi-square test appears to show that the distribution of the original population and the sample significantly differ (χ2(9)= 31.546 and p=0.000238). However, this is due to the high incidence of consultants in the lowest employment band-size of just two sectors. The ONS data do not distinguish between consultants and (genuine) R&D-intensive businesses within the software and telecommunication sectors. Consultants in these sectors could not be excluded ex-ante from the population count provided by the ONS, but were excluded from the survey. As the study concentrates exclusively on R&D intensive businesses, any comparisons between the ONS figures and the study’s sample proportions for these sectors would be misleading. When they are omitted from the count, the relative distribution provided by the ONS and that of the respondents to the survey does not significantly differ (χ2(9)= 4.049 and p=0.77) confirming the representativeness of the study’s survey.
Table 2 provides the summary statistics and describes the variables used in this study. Innovation is defined as the introduction of at least one new-to-market product or service in the previous three years. Using this definition, 56% of the firms in the sample innovated over the period 2001-04, and on average 20.3% of firms’ sales were derived from the introduction of new to the market products, a figure that captures the ability of firms not only to introduce but also to successfully commercialize new products (innovation success). In terms of export behaviour and performance, 53.1%
3
The latter was also compared with the DTI innovation report: ‘Competing in the global economy: The innovation challenge’ (December 2003).
4 We are grateful to the ONS for providing the table for each sector according to companies’ size and age.
5
of the sampled firms exported in 2004, with an average of 19.56% of the sales in the same year derived from exports.
Collaboration of a technical and commercial nature and the use of e-commerce are also shown in Table 2. Collaborative agreements were undertaken by a relatively small minority of firms, with commercial collaborations more common than technical collaborations geared towards innovation. On average, firms reported that almost 11% of sales were derived from e-commerce, suggesting that the internet is a key tool for this sample of firms6.
Table 3 compares the innovative activity, internal R&D expenditure, size and productivity for those firms that exported in 2004 and those that did not. Consistent with previous research, there are statistically significant differences between exporters and non exporters for all variables. These differences are also consistent with the view that high levels of product sophistication and R&D intensity assist a firm in entering foreign markets while higher levels of resources (larger firms) and previous
productivity can assist in overcoming the sunk costs of exporting. However, while suggestive of a self-selection effect, these data by themselves tell us nothing of the nature of the causal links between innovation and exporting.
3.2 Method
In estimating the R&D-innovation-exporting relationship we have to allow for the likelihood of endogeneity between innovation and exporting suggested by the theoretical and empirical literature reviewed above, as well as for selection effects. The conceptual discussion above suggests a recursive model of the general form:
INNi = φ0 + φ1R&Di + φ2S0i + ε1i (1a)
X i = δ0 + δ1S1i + δ2 INNi + ε2i (1b)
EX*i = γD + μ (1c)
⎩ ⎨
⎧ >
=
otherwise EX if
EX i
i
, 0
0 ,
1 *
Where INNi is a measure of new-to-market innovation, R&Di is a measure of R&D
input, X i is an indicator of exporting, S0i, S1i are measures of firm resources relevant
to innovation and exporting respectively, EX*i is a dummy exporting variable and D
is a vector of the determinants of exporting.
There are two key econometric issues to address within the context of a cross-sectional dataset. The first is endogeneity between innovation and exporting: there may be unobserved effects that influence both innovation and exporting, and therefore in estimation the respective error terms may be correlated. The second is the
possibility of self-selection among exporters.
In common with recent studies of innovation and exporting using cross-sectional data (Lachenmaier and Wößmann, 2006; Harris and Li 2009), we employ a form of IV estimation to model the relationship between innovation and exporting. We first estimate equation 1a using probit or tobit, depending on how the dependent
innovation variable is defined. We then use a Heckman (1979) estimator for equations 1b and 1c to allow for the possibility of selection effects arising from the fact that exporters are not a random subset of all NTBFs, as indicated by Table 3. We also allow for endogeneity between exporting and innovation by estimating a reduced-form probit equation of innovation using exogenous variables in the system as
instruments, and using the predicted values in the exporting equation to yield unbiased estimates of the effect of innovation on exporting.
This allows us to go beyond the analysis of both Lachenmaier and Wößmann (2006) and Harris and Li (2009) in a key respect. We are able to estimate a model of the determinants of innovation outputs which allows both for R&D inputs and other sources of knowledge inputs. This is important, because we are ultimately concerned with the impact of innovation outputs on exporting behaviour. We compare the results
of the Heckman estimation with a version in which selection is allowed for but endogeneity is not considered. A key element of the Heckman procedure is identification of the model, involving the exclusion restriction of variables which appear in the initial probit selection equation but not in the export intensity equation. We have chosen suitable variables on the basis of theory, and tested for their
exclusion empirically. The selected variables are proxies for the sunk costs involved in entering export markets.
The first variable is productivity. Recent theoretical work on exporting in the
economics literature starts from the recognition that there are fixed costs involved in entering export markets, and therefore only the more productive firms are able to do so. Roberts and Tybout (1997), Clerides et al (1998) and Helpman et al (2004) all develop formal theoretical models of exporting with sunk costs of entry, and in all cases the models suggest that the sunk costs of market entry favour larger, more productive firms. Similar results are found in the Ricardian model of heterogeneous plants and trade of Bernard et al (2003). The rationale behind these models is that firms contemplating entry to foreign markets have to engage in market research, set up new distribution networks, negotiate with potential new partners, and may have to modify their product range, all of which incur costs. Only those with sufficiently low marginal costs have the profits large enough to cover these fixed costs of entry. Thus exporters are more productive than non-exporters not specifically because of benefits derived from exporting, but because they are more productive firms to begin with, and can therefore overcome the fixed costs of entering foreign markets. Note that this fixed cost argument suggests that the productivity effect is not likely to persist among exporters i.e. productive firms are not necessarily likely to export more than less
productive firms once they are over the fixed cost hurdle of becoming exporters.
This suggests that highly productive firms are systematically more likely to become exporters than their less productive counterparts. One would therefore expect to see strong evidence of self selection into export markets, and this is indeed borne out by the empirical evidence. This is one of the most studied areas in international
overwhelming support for the existence of this self-selection mechanism. We therefore include a measure of lagged (labour) productivity in the selection equation but not in the exporting equation.
The second set of variables to be treated this way are the dummy variables for commercial linkages with outside agencies, a proxy for information sunk costs. Information costs can be a major element of exporting sunk costs, especially for small firms (Love and Mansury 2009). This is especially true for service sectors: many of these sectors are unlikely to face the same sunk cost entry barriers as capital intensive manufacturing sectors, and so they may enter international markets at lower levels of output. However, if sunk costs are primarily informational in nature, one might expect them to apply with equal force to both manufacturing and services. One way in which firms can overcome the information barriers is to form commercial links with other enterprises which have more overseas experience, and so we include dummy variables for the existence of commercial agreements both with supply-chain and non-supply-chain partners in the selection equation.
4. Estimation and Results
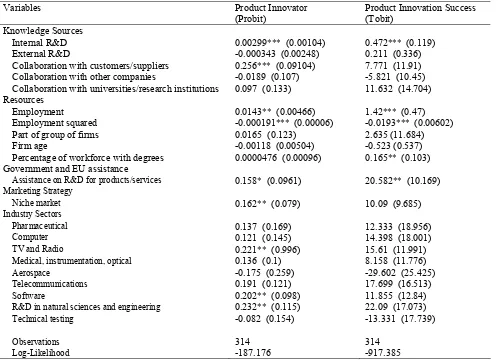
The estimation of innovation determinants (equation 1a) draws on recent literature on the ‘innovation value chain’ (Roper et al 2008; Ganotakis and Love 2009), and its emphasis on both internal (i.e. R&D) and external knowledge sources, as well as the internal resources of the firm arising from size, employee skills etc. This is modelled using an innovation or knowledge production function (e.g. Geroski, 1990; Harris and Trainor, 1995) in which the effectiveness of a firm’s knowledge transformation activities is influenced by enterprise characteristics, the strength of the firm’s resource base, as well as the firm’s managerial and organisational capabilities (Griliches, 1992, 1995; Love and Roper, 1999). In addition to internal and external R&D expenditure by the firm, we anticipate that knowledge from different sources may have differential product innovation effects. Joshi and Sharma (2004), for example, suggest the
importance of knowledge of customers’ preferences in shaping firms’ innovation success, while Roper et al. (2008) emphasise the greater value of backwards and horizontal knowledge linkages for some aspects of innovation. We therefore include dummy variables indicating whether or not the firm had research collaboration with customers and suppliers, other (non-supply chain) firms, and with universities.
Estimation results are shown in Table 4. The first column shows results for a probit equation on a dummy dependent innovation variable, and the second column shows results for a tobit regression of ‘product innovation success’ i.e. new-to-market products as a proportion of sales. Results indicate that internal R&D has a strong positive association with innovation, however measured. For example, a one
intensity of innovation but not its probability. Firms specializing in a niche market are more likely to innovate, but are not more innovation intensive.
The next stage of the empirical analysis is to estimate the determinants of exporting allowing for selection effects and endogeneity between innovation and exporting (equations 1b and 1c). In common with recent micro-based models of exporting (Wakelin, 1998; Roper and Love, 2002; Gourlay et al, 2005; Roper et al 2006), we estimate a model using several indicators of the firm’s internal resources (S1
i), plus its
performance in terms of lagged productivity. We also allow for the use of
e-commerce and commercial collaborations with other companies, both of which may help overcome the sunk costs of exporting.
We estimate two versions of the Heckman model of export determinants. In one we allow for the endogeneity of innovation, and use a predicted value obtained from a reduced-form model of innovation determinants (models 1 and 2). In the other, and for comparison, we take no account of endogeneity between innovation and exporting, and the innovation variables enter the estimation in their actual values (models 3 and 4). The results are shown in Table 5 (determinants of exporting) and Table 6
(determinants of export intensity) respectively. The use of the Heckman procedure is clearly justified as shown by the diagnostics in Table 6, with a high correlation between the error terms of the respective equations, and the rejection of the null hypothesis of independent equations. In both the exporting and exporting intensity estimations the Smith-Blundell tests rejects the null hypothesis that innovation is exogenous to exporting, and the Sargan test fails to reject the null hypothesis of no over-identification, indicating the validity of the instruments.
In terms of the determinants of exporting (Table 5), an NTBF undertaking new-to-market product innovation is around 40% more likely to export in 2004 as a non-innovator once the endogeneity of innovation is allowed for (model 1). The strong positive effect of innovating persists when innovation is expressed in terms of innovation success, that is the proportion of sales accounted for by products new to the market (model 2). In both cases the marginal effect of innovating is substantially higher in the endogenous estimation than when innovation enters exogenously (models 3 and 4), an effect also noted by Lachenmaier and Wößmann (2006).
Other determinants of exporting are broadly as expected. NTBFs with commercial collaborative agreements are more likely to export once endogeneity of innovation is allowed for, but only where these collaborations occur outside the supply-chain. Firms with higher skill levels are also more likely to export. As anticipated, lagged productivity has a substantial positive effect on the probability of exporting, in common with the bulk of the literature (Wagner 2007). The positive effect of
(employment) size disappears once endogeneity is accounted for. The use of internet e-commerce is anticipated both to help firms overcome the hurdle of entering export markets, and to allow them to penetrate such markets at lower costs, and so a measure of its use is included in both parts of the Heckman estimation. However, the
coefficient on this variable is insignificant on the exporting equation, indicating that for this group of firms the use of e-commerce has no effect on becoming an exporter.
innovator has no effect on exporting intensity. The extent of sales achieved through e-commerce is positively associated with export intensity; calculated at the respective means, a one percent increase in internet sales intensity raises export intensity by around 0.1%. In common with the exporting equation (Table 5), internal resources such as size and age have no impact on the extent of exporting. However, firms with higher graduate skill levels are more export intensive as well as being more likely to export. NTBFs which target a niche market are no less export intensive than those pursuing a wider market strategy. Since these firms are also no less likely to export (Table 5), this suggests that pursuing a niche market does not limit the scope for export sales among this sample of firms.
5. Conclusions
The purpose of this paper is to examine the relationship between R&D, innovation and exporting for a set of high-growth, high-technology and relatively small firms. We use a narrowly defined definition of product innovation, and allow both for endogeneity between innovation and exporting and for selection effects in exporting. Both theory and (to some extent) the empirical literature suggests a
mutually-reinforcing relationship between innovation and exporting, but few studies have considered this relationship among relatively small firms, and fewer still have allowed for the effect of R&D to be moderated through innovation outputs.
Estimating a recursive system of the R&D-innovation-exporting relationship, we find that innovators are indeed more likely to export, even after allowing for endogenetity and sample selection. However, conditional on entering export markets, there is no evidence that the extent of successful innovation increases subsequent export intensity. Lagged productivity is strongly associated with exporting, supporting the view that efficient firms are better able to overcome the barriers to entering export markets, and skills are positively linked to exporting and its intensity. However, once innovation’s endogeneity is allowed for, there is no evidence that size (measured by employment) aids exporting or export intensity.
Perhaps surprisingly, the use of e-commerce does nothing the boost entry into export markets, but the extent of its use is positively associated with increased export intensity. We also find strong evidence of the importance of internal R&D and of supply chain collaborations in fostering innovation, and that formal commercial collaborations can be important in overcoming the (information) sunk costs of entering export markets.
Our results show some strong similarities with, for example, Harris and Li (2009), but also some differences. They also find that innovation (or rather R&D) positively affects exporting but not export intensity once endogeneity is allowed for, and that productivity has a similar pattern of effects. However, one key difference between our results and those of this earlier study is in the effects of firm size. Harris and Li find a strong positive effect of size in overcoming export barriers, but a significant negative relationship between size and export intensity, conditional on entering export markets. By contrast, we find that size is strongly positively associated with
innovation, but there is no size effect on exporting once endogeneity is taken into
that employment has a significant and positive sign on exporting when endogeneity is not allowed for (Table 5 models 3 and 4) suggests that in part the difference with Harris and Li arises because we are able to allow for the influence of size through its effect of innovation outputs.
Overall, the results of the analysis suggest that innovation and efficiency are just as important for overcoming barriers to exporting for high-tech SMEs as they are for firms in general. In addition, formal commercial collaborations can also be an important method of overcoming the (information) sunk cost of exporting for this group of firms. Once exporting, however, what matters for increased penetration of export markets is not scale or innovation, but appropriate skill levels and the use of e-commerce. Results also show that governmental support for R&D has a significant effect not only on the initial introduction to the market of new products and services but also on their subsequent success, both of which in turn have an effect on the probability of exporting. However, some care is necessary in interpreting the policy implications of this result, as the coefficient on the policy support variable – which is essentially a treatment term – reflects the combination of ‘assistance’ and ‘selection’ effects7.
Some more general policy observations can be made, however. The positive links between e-commerce and export intensity and between commercial agreements and export propensity suggest that policy should be geared towards allowing high-tech SMEs easier access to appropriate commercial skills and assistance in an effort both to decrease the information sunk cost of entering foreign markets and to increase the commercial success of innovative products overseas. Assistance for the development of dynamic websites capable of accepting orders and payments online might be one way forward, as it allows foreign customers to identify innovative products, view their description and pricing, get information about the commercial background of the firm and finally either enquire about a product or place an order online. The finding that employee skills affect not only innovation success but also export propensity and intensity indicates that programmes which assist high-tech SMEs to recruit and keep suitably qualified graduates and professionals with the technical skills for the
development of innovative products and the commercial skills for the foreign market success of such products might be a suitable area for public policy support. Finally, commercial information sharing and collaborations between NTBFs and successful exporters can be encouraged.
Table 1. Distribution of population and sample firms by industry
High Technology Sectors Sampling frame Sample respondents
Pharmaceutical 1.19 3.16
Computers 2.82 4.87
Electrical 9.96 15.57
TV and Radio 7.88 11.44
Medical, instrumentation, optical 12.14 22.39
Aerospace 1.22 1.7
Telecommunications 13.71* 5.84
Software 39.85* 21.9
R&D in natural sciences and
engineering 6.12 6.33
Technical testing 5.1 6.81
Table 2. Summary Statistics and variable description
Variable description Mean S.D.
Exporting Performance
Exports in 2004 – Whether a firm was an exporter in 2004 (0/1) 0.531 0.499 Percentage of exports in 2004 – Amount of export sales in relation to total sales in 2004 (%) 19.56 29.51 Innovation variables
Product Innovation – New to the market product in the last 3 years (0/1) 0.56 0.49 Innovation success – Percentage of new to the market products sales (%) 20.3 29.8 Knowledge sourcing activities of a technical nature
Percentage Internal R&D – R&D undertaken within the firm (R&D expenditure in relation to total expenditure – (%))
22.53 31.99
Percentage External R&D – R&D undertaken outside the firm in the form of totally outsourced contracts (% of R&D expenditure in relation to total expenditure – (%))
3.43 11.72
Formal collaborative agreements of a technical nature with customers/suppliers (0/1) 0.12 0.314 Formal collaborative agreements of a technical nature with other companies (0/1) 0.11 0.317 Formal collaborative agreements of a technical nature with universities/public research
institutions (0/1)
0.08 0.26
Commercial collaborations
Formal collaborative agreements of a commercial nature with customers/suppliers (0/1) 0.157 0.365 Formal collaborative agreements of a commercial nature with other companies (0/1) 0.182 0.387 Resources
Employment (number) 16.07 26.37
Part of a group (other company owns less than 50 % equity or firm is head of group, 0/1)) 0.08 0.273
Firm age (years) 10.57 6.76
Percentage of workforce with degree (%) 41.62 36.3
Lagged productivity – sales per employee in 2001 (£) 73350 75478
IS adoption
Percentage of sales derived from Internet E-Commerce (%) 10.83 23.61
Government and EU assistance
Government assistance on R&D for product/process (0/1) 0.12 0.329 Market strategy
Specific – Products are made to a serve a specialist niche market (0/1) 0.83 0.377
Table 3. Comparison of exporters and non-exporters: means (standard deviations)
Variables Exporters Non-exporters p-values (two-tailed t-test)
Table 4. Determinants of Innovation
Variables Product Innovator
(Probit) Product Innovation Success (Tobit)
Knowledge Sources
Internal R&D 0.00299*** (0.00104) 0.472*** (0.119)
External R&D -0.000343 (0.00248) 0.211 (0.336)
Collaboration with customers/suppliers 0.256*** (0.09104) 7.771 (11.91)
Collaboration with other companies -0.0189 (0.107) -5.821 (10.45)
Collaboration with universities/research institutions 0.097 (0.133) 11.632 (14.704) Resources
Employment 0.0143** (0.00466) 1.42*** (0.47)
Employment squared -0.000191*** (0.00006) -0.0193*** (0.00602)
Part of group of firms 0.0165 (0.123) 2.635 (11.684)
Firm age -0.00118 (0.00504) -0.523 (0.537)
Percentage of workforce with degrees 0.0000476 (0.00096) 0.165** (0.103)
Government and EU assistance
Assistance on R&D for products/services 0.158* (0.0961) 20.582** (10.169)
Marketing Strategy
Niche market 0.162** (0.079) 10.09 (9.685)
Industry Sectors
Pharmaceutical 0.137 (0.169) 12.333 (18.956)
Computer 0.121 (0.145) 14.398 (18.001)
TV and Radio 0.221** (0.996) 15.61 (11.991)
Medical, instrumentation, optical 0.136 (0.1) 8.158 (11.776)
Aerospace -0.175 (0.259) -29.602 (25.425)
Telecommunications 0.191 (0.121) 17.699 (16.513)
Software 0.202** (0.098) 11.855 (12.84)
R&D in natural sciences and engineering 0.232** (0.115) 22.09 (17.073)
Technical testing -0.082 (0.154) -13.331 (17.739)
Observations 314 314
Log-Likelihood -187.176 -917.385
Table 5. Determinants of exporting
Variables Endogeneity treated Endogeneity not treated
(1) (2) (3) (4)
Innovation activity
Product innovator 0.412* (0.219) - 0.154** (0.0663) -
Innovation Success - 0.00414** (0.00183) - 0.00204* (0.0012)
Formal commercial collaborative agreements
Agreements with customers/suppliers -0.0051 (0.122) -0.000243 (0.119) 0.0885 (0.1118) 0.103 (0.11)
Agreements with other companies 0.208** (0.0967) 0.254*** (0.0952) 0.107 (0.10337) 0.119 (0.101)
IS adoption
Internet E-Commerce (% sales) 0.00262 (0.00166) 0.00129 (0.00183) 0.002 (0.00151) 0.00178 (0.00153)
Resources
Employment 0.00482 (0.0054) 0.0031 (0.00563) 0.0062** (0.00312) 0.006336** (0.00311)
Employment squared 0.000031 (0.00005) 0.0000725 (0.00006) -0.0000246** (0.00001) -0.0000241** (0.00001)
Part of group of firms 0.154 (0.135) 0.147 (0.135) 0.0997 (0.139) 0.0882 (0.1378)
Firm age 0.008 (0.00559) 0.00975* (0.0056) 0.01** (0.0055) 0.0118** (0.00551)
Percentage of workforce with degrees 0.00279** (0.00109) 0.00224** (0.00113) 0.00237** (0.00105) 0.00222** (0.00105)
Productivity 2001 0.0979** (0.0429) 0.103** (0.0431) 0.119*** (0.0427) 0.115*** (0.0427)
Marketing Strategy
Niche market -0.082 (0.0997) 0.0772 (0.09885) -0.035 (0.09229) -0.025 (0.0921)
Industry Sectors
Pharmaceutical 0.00577 (0.252) -0.028 (0.256) 0.112 (0.249) 0.089 (0.251)
Computer -0.234 (0.166) -0.263 (0.161) -0.208 (0.165) -0.196 (0.163)
TV and Radio -0.196 (0.136) -0.181 (0.132) -0.165 (0.125) -0.137 (0.125)
Medical, instrumentation, optical -0.05 (0.125) -0.0511 (0.123) -0.000885 (0.116) 0.007 (0.115)
Aerospace 0.0213 (0.262) 0.0432 (0.261) -0.028 (0.235) -0.0183 (0.243)
Telecommunications -0.483*** (0.0733) -0.505*** (0.0634) -0.475*** (0.0779) -0.471*** (0.08)
Software -0.439*** (0.0998) -0.424*** (0.0965) -0.412*** (0.0918) -0.386*** (0.0927)
R&D in natural sciences and engineering -0.381*** (0.11) -0.39*** (0.105) -0.327*** (0.114) -0.309*** (0.115)
Technical testing -0.203 (0.154) -0.162 (0.161) -0.27** (0.129) -0.26** (0.131)
Observations 260 260 272 272
Table 6. Determinants of exporting intensity
Variables Endogeneity treated Endogeneity not treated
(1) (2) (3) (4)
Innovation activity
Product innovator 16.753 (15.295) - 3.968 (4.849) -
Innovation Success - 0.06 (0.13) - -0.0807 (0.0851)
IS adoption
Internet E-Commerce (% sales) 0.222* (0.116) 0.2117* (0.122) 0.218** (0.111) 0.265** (0.11)
Resources
Employment 0.185 (0.325) 0.255 (0.354) 0.186 (0.183) 0.206 (0.184)
Employment squared -0.00123 (0.00276) -0.00188 (0.00363) -0.0006 (0.0061) -0.00066 (0.00061)
Part of group of firms -4.337 (8.084) -3.959 (8.187) -1.026 (8.0377) -2.695 (8.05)
Firm age -0.439 (0.373) -0.45 (0.383) -0.524 (0.364) -0.568 (0.356)
Percentage of workforce with degrees 0.164* (0.0846) 0.155* (0.0911) 0.196** (0.811) 0.22*** (0.0789)
Marketing Strategy
Niche market -9.69 (6.648) -7.88 (6.688) -8.15 (6.49) -6.512 (6.538)
Industry Sectors
Pharmaceutical -6.455 (10.745) -4.933 (11.096) -2.674 (10.507) -2.313 (10.351)
Computer -14.218 (10.326) -12.124 (10.613) -8.608 (9.751) -6.997 (9.22)
TV and Radio 2.555 (10.275) 5.939 (9.851) 9.099 (8.636) 10.252 (8.35)
Medical, instrumentation, optical 7.952 (8.573) 10.06 (8.625) 11.982 (8.008) 12.837 (7.865)
Aerospace -13.01 (11.38) -13.581 (11.273) -11.931 (9.652) -9.764 (9.465)
Telecommunications -6.7 (12.195) -5.761 (12.757) 2.501 (12.296) 5.28 (12.699)
Software 0.441 (9.9) 3.957 (9.547) 5.305 (9.216) 5.374 (8.987)
R&D in natural sciences and engineering 38.411** (16.115) 42.67*** (15.714) 47.627*** (14.056) 49.126*** (13.436)
Technical testing -3.924 (12.523) -2.599 (12.06) -4.745 (9.72) -6.234 (10.215)
ρ / σ / λ (standard errors)
-0.603 / 28.95 / -17.46 (0.129) / (2.25) / (4.87)
-0.63 / 29.45 / -18.56 (0.126) / (2.332) / (4.936)
-0.59 / 28.75 / -16.98 (0.112) / (2.189) / (4.254)
-0.526 / 28.345 / -14.937 (0.106) / 2.037) / (3.79)
Log pseudo-likelihood -773.846 -773.796 -818.72 -821.21
Wald test of independent equations χ²(1) 11.71 / p-value = 0.0006 12.56 / p-value = 0.0004 15.45 / p-value = 0.0001 15.85 / p-value = 0.0001
Smith-Blundell test of exogeneity χ2(1) Smith-Blundell test of exogeneity F(1,235)
2.917 / p-value = 0.0876
5.991 / p-value = 0.015
Sargan test for overidentification χ²(2) p-value = 0.5548 p-value = 0.5585
Observations 134 134 142 142
References
Acs Z J and Audretsch D B (1987) ‘Innovation, market structure and firm size’, Review of Economics and Statistics, 69, 567-574.
Aw B Y, Roberts M J and Winston T (2007) ‘Export market participation, investments in R&D and worker training, and the evolution of firm productivity’, The World Economy,
30, 83-104.
Bernard A B, Eaton J, Jensen J B, and Kortum S (2003) ‘Plants and productivity in international trade’, American Economic Review, 93, 1268-1290.
Bleaney M and Wakelin K (2002) ‘Efficiency, innovation and exports’ Oxford Bulletin of Economics and Statistics, 64, 3-15.
Blind, K, and A Jumgmittag. (2004) ‘Foreign direct investment, imports and innovations in the service industry’, Review of Industrial Organisation 25, 205-227.
Blum, B., and A. Goldfarb (2006) ‘Does the Internet Defy the Law of Gravity?’, Journal of International Economics, 70, 384–405.
Braunerhjelm P (1996) ‘The relation between firm-specific intangibles and exports’,
Economics Letters, 53, 213-219.
Butchard R (1987) ‘A new definition of high technology industries’, Economic Review 400, 82-88.
Buxton T, Mayes D and Murfin A (1991) ‘UK trade performance and R&D’ Economics of Innovation and New Technology, 1, 243-256.
Clerides S K, Lach S and Tybout J R (1998) ‘Is learning-by-exporting important? Micro-dynamic evidence from Colombia, Mexico and Morocco’, Quarterly Journal of
Economics, 113, 903-947.
Department of Trade and Industry (2003) ‘Innovation Report’, London.
Fillis I, Johansson U and Wagner B (2003) ‘A conceptualization of the opportunities and barriers to e-business development in the smaller firm’, Journal of Small Business and Enterprise Development 10, 336-344.
Fillis I, Johansson U and Wagner B (2004) ‘A qualitative investigation of smaller firm e-business development’ Journal of Small Business and Enterprise Development 11,
Ganotakis P and Love J H (2009) ‘The innovation value chain in new technology based firms: evidence from the UK’, Research Paper 0916, Aston Business School,
Birmingham.
Geroski, P.A., (1990) ‘Innovation, Technological Opportunities, and Market Structure’
Oxford Econonomic Papers, 42, 586-602.
Girma S, Gorg H and Hanley A (2008) ‘R&D and exporting: A comparison of British and Irish firms’,Review of World Economics, 144, 750-773.
Gourlay A, Seaton J and Suppakitjarak J (2005) ‘The determinants of export behaviour in UK service firms’, Service Industries Journal, 25, 879-889.
Greenhalgh C (1990)’Innovation and trade performance in the United Kingdom’,
Economic Journal, 100, 105-118.
Greenhalgh C, Taylor P and Wilson R (1994) ‘Innovation and export volumes and prices: a disaggregated study’ Oxford Economic Papers, 46, 102-134.
Griliches, Z.,(1992). ‘The Search for Research-And-Development Spillovers’,
Scandinavian Journal of Economics, 94, S29-S47.
Griliches, Z., 1995. R&D and Productivity: Econometric Results and Measurement Issues. In Stoneman, P., (Ed.), Handbook of the Economics of Innovation and Technological Change, Blackwell, Oxford, 52-89.
Grossman, G.M. and Helpman, E. (1991a) ‘Trade, Knowledge Spillovers, and Growth’.
European Economic Review, 35, 517-526..
Grossman, G, and Helpman, E (1991b) Innovation and Growth in the World Economy
(Cambridge, MA: MIT Press).
Harris R I D and Li Q C (2009) ‘Exporting, R&D, and absorptive capacity in UK establishments’ Oxford Economic Papers, 61, 74-103.
Harris R I D and Trainor M (1995) ‘Innovations and R&D in Northern Ireland manufacturing: a Schumpeterian approach’, Regional Studies, 29, 593-604.
Heckman, J J. (1979) ‘Sample Selection Bias as a Specification Error’, Econometrica 47,
153-161.
Helpman, E., Melitz, M., Yeaple, S., (2004) ‘Export versus FDI with heterogeneous firms’, American Economic Review, 94, 300–316.
Hobday, M. (1995) East Asian latecomer firms: Learning the technology of electronics.
Kleinknecht A (1987) ‘Measuring R&D in Small Firms: How Much are we Missing?’,
Journal of Industrial Economics, 36, 253-256.
Kobrin S J (1991) ‘An empirical analysis of the determinants of global integration’,
Strategic Management Journal, 12, 17-37.
Lachenmaier S and Wößmann L (2006) ‘Does innovation cause exports? Evidence from exogenous innovation impulses and obstacles using German micro data’, Oxford
Economic papers, 58, 317-350.
Lefebvre, E. and Lefebvre, L. (2001) Innovative Capabilities as Determinants of Export Behaviour and Performance: A Longitudinal Study of Manufacturing SMEs. In:
Kleinknecht, A. and Mohnen, P.(eds.) Innovation and Firm Performance, Econometric Exploration of Survey data, London: Palgrave.
Lefebvre, E., Lefebvre, L.A., and Bourgault, M. (1998) ‘R&D-Related Capabilities as Determinants of Export Performance’ Small Business Economics, 10(4), 365-377.
Love J H and Mansury M A (2009) ‘Exporting and Productivity in Business Services: Evidence from the United States’, International Business Review, forthcoming.
Love J H and Roper S (2001) “Location and network effects on innovation success: evidence for UK, German and Irish manufacturing plants”, Research Policy, 30, 643-661.
Love J.H. and Roper, S. (1999) ‘The determinants of innovation: R & D, technology transfer and networking effects’, Review of Industrial Organization 15, 43-64.
Love J H, Roper S and Hewitt-Dundas N (2010) ‘Service Innovation, Embeddedness and Business Performance: Evidence from Northern Ireland’, Regional Studies, forthcoming.
Lynskey M J (2004) ‘Determinants of innovative activity in Japanese technology-based start-up firms’, International Small Business Journal 22, 159-196.
Maddala, G (1973) ‘Limited Dependent and Qualitative Variables in Econometrics’,
Cambridge University Press, New York.
Metcalfe S (1997) ‘Technology Systems and Technology Policy in an Evolutionary Framework’, in Technology, Globalisation and Economic Performance, Archibugi D and
Michie J (eds), Cambridge University Press.
Molla A and Licker P S (2005) ‘eCommerce adoption in developing countries: a model and instrument’ Information & Management 42, 877-899.
Nelson R R (1993) ‘National Innovation Systems: A Comparative Analysis’, Oxford
Oakey R P (2003) ‘Technical entrepreneurship in high technology small firms: some observations on the implications for management’, Technovation 23, 679-688.
Onodera O (2008) ‘Trade and investment project: a synthesis paper’, OECD Trade Policy Working Papers No 72, OECD, Paris.
Office of National Statistics (2002) ‘Research and Development in the UK’, London
Office of National Statistics (2003) ‘Press Release Unique Reference Number 03/92’, London.
Roberts M and Tybout J R (1997) ‘The decision to export in Colombia: an empirical model of entry with sunk costs’, American Economic Review, 87, 545-564.
Roper S, Du J and Love JH (2008) ‘Modelling the innovation value chain’, Research Policy, 37, 961-977.
Roper S, Hewitt-Dundas N (2001) ‘Grant assistance and small firm development in Northern Ireland and the Republic of Ireland’, Scottish Journal of Political Economy, 48,
99-117.
Roper S and Love J H (2002) ‘Innovation and Export Performance: Evidence from UK and German Manufacturing Plants’, Research Policy, 31, 1087-1102.
Roper, S, Love, J H and Añon Hígon, D (2006) ‘The Determinants of Export Performance: Evidence for Manufacturing Plants in Ireland and Northern Ireland’,
Scottish Journal of Political Economy, 53, 586-615.
Salomon R M and Shaver J M (2005) ‘Learning by exporting: new insights from examining firm innovation’, Journal of Economics and Management Strategy, 14,
431-460.
Santarelli E and D’Altri S (2003) ‘The diffusion of E-commerce among SMEs: Theoretical implications and empirical evidence’, Small Business Economics 21,
273-283.
Shearman C and Burrell G (1998) ‘New technology-based firms and the emergence of new industries: some employment implications’, New Technology Work and Employment
3, 87-99.
Sterlacchini A (1999) ‘Do innovative activities matter to small firms in non-R&D-intensive industries? An application to export performance’, Research Policy, 28,
819-832.
Tether B and Storey D (1998) ‘Smaller firms and Europe’s high technology sectors: a framework for analysis and some statistical evidence’, Research Policy 26, 947-971.
Veugelers R and Cassiman B (1999) ‘Make and buy in innovation strategies: evidence from Belgian manufacturing firms’, Research Policy, 28, 63-80.
Vernon R (1966) ‘International investment and international trade in the product cycle’,
Quarterly Journal of Economics, 80, 190-207.
Wagner J (2007) ‘Exports and productivity: a survey of the evidence from firm-level data’, The World Economy, 30, 60-82.
Wakelin K (1998) ‘Innovation and Export Behaviour at the Firm Level’, Research Policy, 26, 829-841.
World Bank (1993) The East Asian Miracle (New York: Oxford University Press).
Zhao, H. and Li, H. (1997) R&D and Export: An Empirical Analysis of Chinese Manufacturing Firms. Journal of High Technology Management Research, 8(1), 89-