City, University of London Institutional Repository
Citation
:
Nadimi, S. & Fonseca, J. (2017). On the tensile strength of soil grains in
Hertzian response. Paper presented at the Powders and Grains 2017 – 8th International
Conference on Micromechanics on Granular Media, 3-7 July 2017, Montpellier, France.
This is the published version of the paper.
This version of the publication may differ from the final published
version.
Permanent repository link:
http://openaccess.city.ac.uk/17731/
Link to published version
:
http://dx.doi.org/10.1051/epjconf/201714007001
Copyright and reuse:
City Research Online aims to make research
outputs of City, University of London available to a wider audience.
Copyright and Moral Rights remain with the author(s) and/or copyright
holders. URLs from City Research Online may be freely distributed and
linked to.
On the tensile strength of soil grains in Hertzian response
Sadegh Nadimi1,* and Joana Fonseca1
1City, University of London, London, UK
Abstract. The breakage initiation of soil grains is controlled by its tensile capacity. Despite the importance of tensile strength, it is often disregarded due to difficulties in measurement. This paper presents an experimental and numerical investigation on the effect of tensile strength on Hertzian response of a single soil grain. Hertz theory is commonly used in numerical simulation to present the contact constitutive behaviour of a purely elastic grain under normal loading. This normal force:displacement comes from stress distribution and concentration inside the grain. When the stress reaches the tensile capacity, a crack initiates. A series of numerical tests have been conducted to determine the sensitivity of Hertzian response to the selected tensile strength used as an input data. An elastic-damage constitutive model has been employed for spherical grains in a combined finite-discrete element framework. The interpretation of results was enriched by considering previous theoretical work. In addition, systematic experimental tests have been carried out on both spherical glass beads and grains of two different sands, i.e. Leighton Buzzard silica sand and coarse carbonate sand from Persian Gulf. The preliminary results suggest that lower tensile strength leads to a softer response under normal loading. The wider range of responses obtained for the carbonate sand, are believed to be related to the large variety of grain shape associated with bioclastic origin of the constituent grains.
1 Introduction
1.1 Single grain breakage
The importance of grain breakage in granular assemblies has been well documented [1-4]. This is of interest to geotechnical, mineral, chemical, food and transportation industries. Recent research advances have been obtained by focusing on the response of a single grain [5, 6]. The elastic normal force:displacement response of a grain under compression is called Hertzian response due to pioneering work by German physicist, Hertz [7]. Soil grains are brittle material and break under loading. They will ideally follow a Hertzian response up to the grain strength has been reached. The breakage of a grain is believed to be a tensile phenomenon (cracking) rather than be related to compressive strength (crushing) of the material.
Russell & Muir Wood [8] proposed an approximate expression for compressive and tensile strength of an ideal grain (sphere) under diametrically-compression. They adopted Christensen multiaxial failure criterion [9] which has two parameters for brittle materials: (1) intrinsic strength, κ and (2) microstructure factor, χ. The latter parameter (χ) which was described as the microstructural deviations from the ideal is further investigated in this paper by means of numerical and experimental investigation. The theoretical model is presented in the first part of the paper. This is followed by a numerical investigation presented in the second part
and finally the experiment is described in part three and compared with the numerical investigation.
1.2 Theoretical consideration
The internal stress field propagation in a single spherical grain subjected to the contact forces was presented in [8]. This has been linked to failure criterion in [9] which states a material is not at failure as long as the following condition is compiled:
1 ) 1 ( 3
2
2 2
1 J
I (1)
2
2 1 2
3 I
I
J (2)
where I1 and I2 are the first and second invariants of stress tensor. J2 is the second invariant of the deviatoric stress tensor. Here, for unconfined compression, I1=σc, I2=0, J2=(σc)2/3 and σ
c is the uniaxial compressive
strength.
The intrinsic strength, κ and the microstructure factor, χ are defined as follows:
1
t c
and c
3 1
(3)
According to Christensen [9] κ is the strength of the material with no microstructural damage and is associated to atomic scale properties. The unconfined compressive and tensile strengths of the material are:
1 3
c and 2
) 1 ( 3
t (4)
The approximate expressions for compressive and tensile strength of an elastic sphere under compression are [8]:
2 2 sin R aF
c and
2 2 sin R aF
t (5)
whereR is radius,F is the contact force at failure, θis the contact area in degrees and a is defined as:
) 1 )( 2 2 ( 3 2 2 1 4 1 12 2 24 2 32 3 3 2
a (6)
whereµis the coefficient of friction.
In Eq. (5), the contact area θ can be derived by considering the Hertz solution, Eq. (7):
2 3 2 1 3 4 n n R E F (7)
whereFnis the normal force, Eis the elastic modulus, ʋ is the Poisson ratio and δnis the normal displacement.
Therefore, θ can be computed using Eq. (8):
3 2 2 1 4 ) 1 ( 3 1 cos 2 ER F (8)
To the best knowledge of the authors, the microstructural origin of κ and χ has not been supported by any atomic scale studies. In approximate solution for strength of sphere, σc is unaffected by the value of χ (Eq. 5).
According to literature, the parameter χ varies from 10 to 170 for a range of rock types [8, 10]. Russell & Muir Wood [8] considered four values for χ = 19, 49, 99, 199 in their parametric study. In this paper, the effect of χon the normal force:displacement behaviour of a sphere under compression is presented.
2 Numerical investigation
The problem is investigated in the framework of combined finite-discrete element framework [11, 12]. The interaction of two contacting spheres is simplified to interaction of a sphere with rigid plate, due to symmetry. The effect of χ on the normal force:displacement is investigated by means of an elastic-damage constitutive model. This model uses isotropic damage elasticity in combination with isotropic tensile and compressive plasticity. The constitutive model, numerical model and results are presented in this section.
2.1 Constitutive model
The response of the material is modelled using damage plasticity based on two failure mechanisms: (1) tensile cracking and (2) compressive crushing [13, 14]. Damage states are characterised by two hardening parameters: the equivalent plastic strain in tension, εtpl, and in compression, εcpl. The stress:strain relation is governed by scalar damage elasticity as defined as follows: ) ( : ) ( : ) 1
( d D0el pl Del pl
(9)
where d is a scalar describing the amount of isotropic damage. D0el is the initial elastic stiffness, Del is the
damaged elastic stiffness, ε is the total strain εplis the
plastic strain.
The states of failure and damage are determined using a yield surface in the effective stress space. The yield condition proposed by [13] and modified by [14] has been incorporated to model both tensile and compressive behaviour. The flow potential surfaces are not described here, as it is out of scope of this paper. The typical uniaxial tensile stress strain is shown in Fig. 1a. The degradation of stress depends on the formulation of d. Similarly, for the compressive stress:strain curve, the degradation is controlled by the value of d after the ultimate compressive strength (Fig. 1b). The material hardens from yield compressive strength to the ultimate strength and then softens.
(a)
(a) (b)
Fig. 1. Response of the material under uniaxial loading (a) in tension and (b) in compression.
This constitutive model is attractive, as it can represent a different failure mechanism for cracking and for crushing. Thus, enabling investigating the effect of χ by changing σt for constant σc.
Compressive stress
σcu
εcpl εcel Compressive strain
σc
Tensile stress
σt
εtpl εtel Tensile strain
2.2 Numerical Model
[image:4.595.325.518.102.227.2]The model sphere has a diameter of 2.2mm and is represented by a mesh formed by 60,743 elements and 18,112 nodes. The material parameters used in the simulation are listed in Table 1. Explicit time discretization was employed. The property of hard contact was defined between the sphere and the plate. Using ‘hard contact’ behaviour means that all the force is transmitted through the contact. The relation of normal force:displacement with hard contact assumption follows exactly the Hertzian theory for pure elasticity, due to the deformability of bodies [12]. A series of six simulations were conducted. Different values of χ were considered which is listed in Table 2 with corresponding tensile and compressive strengths.
Table 1. Physical and mechanical parameters used
Elastic modulus E (GPa) 63
Poisson ratio ʋ (-) 0.3
Density ρ (gr/mm3) 2.5
[image:4.595.308.515.266.347.2]Diameter D (mm) 2.2
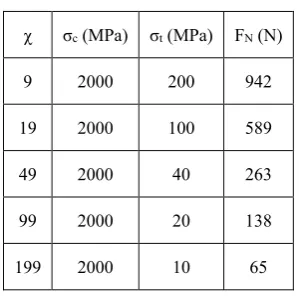
Table 2. Compressive and tensile strengths for different value of parameter χ and the maximum normal force obtained
corresponds to the onset of breakage
χ σc(MPa) σt(MPa) FN(N)
9 2000 200 942
19 2000 100 589
49 2000 40 263
99 2000 20 138
199 2000 10 65
2.3 Results
Figure 2 shows the results of the simulations. The pure elastic model is also presented to observe the deviation of the elastic-damage simulations from pure elasticity. The increase in the value of χ shows the decrease in the normal force which corresponds to the onset of breakage. The exact value of the normal force,FN, for different χ values is listed in the last column of Table 2.
3 Experimental investigation
Single grain experiments are presented in this section on the three type of grains, including glass bead, silica sand and carbonate sand. The schematic of the set-up is shown in Fig. 3. A strain controlled machine ‘Instron 5969’ was used over a range of force applications up to
2kN. The instrumentation accuracy was <1μm for displacement and <0.1N for load measurements.
0 300 600 900 1200
0 20 40 60
Norm
al
Force , N
Normal Displacement, μm Elastic model
χ=9 χ=19 χ=49 χ=99 χ=199
Fig. 2. Response of a spherical grain under compression for different tensile strengths.
Fig. 3. Schematic of the single grain test under normal load.
3.1 Glass bead
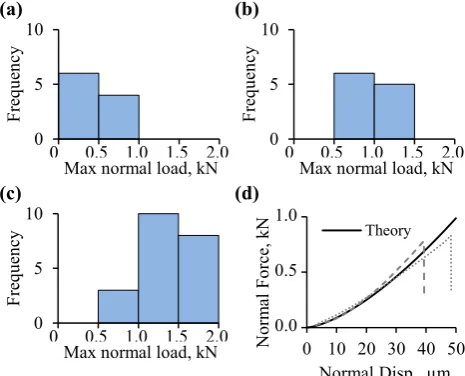
Forty single grain tests were carried out on glass beads. They are commercially supplied by Sigmund Lindner GmbH as type S beads with specific gravity of 2.57. Three range of diameters were chosen, including 1.1 to 1.4mm, 2.0 to 2.4mm, and 3.6 to 4.1mm. In previous experimental work, the tensile strength of a grain has been defined as the maximum normal force over the squared grain diameter [1]. In order to show the variation of tensile strength, the histograms of maximum normal loads applied on the grains are presented. Figs 4.a, b and c show the variation of the maximum normal force applied to the glass beads with the different diameters mentioned above. The Standard Deviation (SD) and median values (Med) are also presented in Fig. 4 caption. McDowell & Bolton [1] proposed a relationship between tensile strength and grain diameter as follows:
m t D3/
(10)
They reported the value of m is in the range of 5-10 for silica sand, and limestone aggregates. Here, the value of m was obtained from power regression to be 2.89 (R2=0.75) for glass beads. This will be further discussed
in the next Section. According to Fig 3.b and numerical simulation, a low value of χ (approximately 9) is expected for glass beads. Fig. 4.d shows the comparison of a typical experimental response observed with the Hertzian response.
3.2 Silica sand
Forty grains of Leighton Buzzard sand, from England, with median diameter of 0.84mm were randomly picked.
Built in load cell and displacement transducer
[image:4.595.99.246.278.375.2] [image:4.595.97.247.415.563.2]Fig 5.a and 5.b show the typical response of silica sand grain under compression. It comprises an initial plateau associated with grain rotation and asperity damage, followed by inelastic Hertzian type of hardening and finally breakage. Fig. 6.a shows the variation of maximum normal force for silica grains with a standard deviation of 6.1N and a median value of 15.5N, excluding 8 grains with capacity from 40N to 80N, for better visualisation. Despite the similarity in mineralogy and elastic modulus between glass beads and silica sand, the tensile strength is significantly different which suggests different value for χ.
(a) (b)
0 5 10
10 20 30 40
F
req
u
en
cy
Max normal load, kN 0 0.5 1.0 1.5 2.0 0
5 10
10 20 30 40
F
req
u
en
cy
Max normal load, kN 0 0.5 1.0 1.5 2.0
(c) (d)
0 5 10
10 20 30 40
Fr
eque
nc
y
Max normal load, kN
0 0.5 1.0 1.5 2.0 0
500 1000
0 10 20 30 40 50
Norm
al Fo
rc
e,
k
N
Normal Disp., μm Theory 1.0
0.5
0.0
Fig. 4. Distribution of the maximum normal load applied on the glass beads of a) 1.1-1.4mm (SD=123, Med=459), b) 2.0-2.4mm (SD=136, Med=979), c) 3.6-4.0mm diameter (SD=357, Med=1290); d) comparison between the typical normal force: displacement response of glass beads and Hertzian theory.
(a) (b)
0 5 10 15
0 100 200
Norm
al Fo
rc
e,
N
Normal Disp., μm
0 20 40 60 80 100
0 200 400 600
Norm
al Fo
rce,
N
Normal Disp., μm
Fig. 5. Typical normal force:displacement response of silica sand.
3.3 Carbonate sand
Forty grains of a shelly carbonate sand from the Persian Gulf with median diameter of 2mm were randomly picked. Fig. 6.b shows the histogram of maximum normal load carried by carbonated sand grains with a standard deviation of 7.9N and a median value of 9.2N, excluding 10 grains with very wide capacity from 40N to 384N, for better visualisation. Although the majority of grains can bear less than 10N, this diversity in response can be attributed to the various shape found in this bioclastic material [15].
4 Closing remarks
The numerical and experimental tests presented here show that the failure of a single grain under compression is a tensile (cracking) phenomenon. We can observe that the lower the tensile capacity, the softer the Hertzian response. The low value of χ for glass beads in comparison with the high value for silica grains can be related to geological history and weathering of the sand grains. There might be a direct relation between the parameter m in [1] and χ in [8], which needs further investigation. Carbonate sand bearing capacity can be categorised by considering grain morphology and intergranular void ratio.
(a) (b)
0 5 10 15 20
F
req
u
en
cy
Max normal load, N 0 10 20 30 40
0 5 10 15 20
Fre
que
nc
y
Max normal load, N 0 10 20 30 40
Fig. 6. Distribution of maximum normal load applied on the grains of, a) silica sand, b) carbonate sand.
The authors would like to thank City, University of London for the doctoral scholarship of the first author and EPSRC for the financial support (EP/N018168/1).
References
1. G.R. McDowell, M.D. Bolton, Géotechnique, 48 (1998)
2. Y. Nakata, A.F.L. Hyde, M. Hyodo, H. Murata, Géotechnique,49 (1999)
3. G. Marketos, M. D. Bolton, Journal of the Mechanics and Physics of Solids,55 (2007)
4. F.N. Altuhafi, M. R. Coop, Géotechnique, 61 (2011) 5. B. Zhao, J. Wang, M.R. Coop, G. Viggiani, M.
Jiang, Géotechnique,65 (2015)
6. W. Wang, M.R. Coop, Géotechnique
http://dx.doi.org/10.1680/jgeot.15.P.247
7. H. Hertz, Journal für die reine und angewandte Mathematik, 92 (1882)
8. A.R. Russell, D. Muir Wood, International Journal of Rock Mechanics & Mining Sciences, 46(2009) 9. R.M. Christensen, Mathematics and Mechanics of
Solids, 5 (2000)
10. R.E. Goodman, Introduction to rock mechanics. 2nd
Ed. New York: Wiley (1989)
11. A. Munjiza, The Combined Finite-Discrete Element
Method, London: Wiley (2004)
12. S. Nadimi, J. Fonseca, Géotechnique (under review, February 2017).
13. J. Lubliner, J. Oliver, S. Oller, E. Onate, Inter. Journal of Solids and Structures, 25 (1989)
14. J. Lee, G.L. Fenves, ASCE Journal of Engineering Mechanics, 124 (1998)
15. J. Fonseca, et al. In Deformation characteristics of
geomaterials: Buenos Aires, Argentina (2015).