City, University of London Institutional Repository
Citation
:
Bharadwaj, P., Pai, M. M. and Suziedelyte, A. (2017). Mental health stigma. Economics Letters, 159, pp. 57-60. doi: 10.1016/j.econlet.2017.06.028This is the accepted version of the paper.
This version of the publication may differ from the final published
version.
Permanent repository link:
http://openaccess.city.ac.uk/19148/Link to published version
:
http://dx.doi.org/10.1016/j.econlet.2017.06.028Copyright and reuse:
City Research Online aims to make research
outputs of City, University of London available to a wider audience.
Copyright and Moral Rights remain with the author(s) and/or copyright
holders. URLs from City Research Online may be freely distributed and
linked to.
Mental Health Stigma
∗
Prashant Bharadwaj
†Mallesh M. Pai
‡Agne Suziedelyte
§Abstract
Comparing self-reports to administrative records, we find that survey
respon-dents are significantly more likely to under-report mental illnesses compared to
other health conditions. This behavior is consistent with the existence of stigma of
mental illnesses. We show that stigma can play a role in determining health-seeking
behavior.
∗This research is funded by an ARC Discovery Project Grant (DP110100729). It was completed
using data collected through the 45 and Up Study (www.saxinstitute.org.au). The 45 and Up Study is managed by the Sax Institute in collaboration with major partner Cancer Council NSW; and partners: the National Heart Foundation of Australia (NSW Division); NSW Ministry of Health; beyondblue; NSW Government Family & Community Services for Carers, Ageing and Disability Inclusion; and the Australian Red Cross Blood Service. We thank the many thousands of people participating in the 45 and Up Study. This project was undertaken by the University of Technology Sydney and utilized Pharmaceutical Benefit Schedule (PBS) and Medicare Benefits Schedule (MBS) data supplied by the Commonwealth Department of Human Services (DHS) and linked to the 45 and Up Study by the Sax Institute using a unique identifier that was provided to the DHS. The 45 and Up Study has the approval of the University of NSW Health Research Ethics Committee; this project has ethics approval from the NSW Population and Health Services Research Ethics Committee and the Department of Health Departmental Ethics Committee. The study’s findings are those of the authors and do not necessarily represent the views of the Department of Health, or the Department of Human Services. Mallesh Pai gratefully acknowledges support from NSF Grant CCF-1101389. We have benefited from discussions with Kate Antonovics, Victoria Baranov, Jeff Clemens, Julie Cullen, Gordon Dahl, Mitch Downey, Matthew Gibson, David Johnston, Hanming Fang, Anu Sansi, and Charlie Sprenger. Drs. Ram Krishnamoorthi, and Akshta Pai patiently answered questions regarding drug prescription protocols.
†University of California San Diego & NBER. ‡Rice University
§City, University of London. Corresponding author: Department of Economics, Northampton Square,
1
Introduction
The fear of being stigmatized or socially sanctioned and disgraced governs many aspects of human behavior. In many cases, the fear of stigma does not result in actual behavior change but rather leads individuals to simply hide certain behaviors or actions (for ex-ample, smoking in secrecy). This is in line with the definition of stigma in the seminal work on the topic by Goffman (1963).
We show the existence and consequences of stigma in an important area of public health concern: mental health.1 We compare survey self-reports on diagnoses and mental health
drug use to administrative data on prescription drug use in a sample of more than 250,000 individuals. While there could be various drivers for the differences between survey self-reports and administrative data, our leading explanation is that if mental illnesses were not stigmatized, the difference between self-reported survey responses and objective administrative records should be statistically similar to other diseases.
While a large literature in psychology and psychiatry has examined the existence of stigma in mental health (see examples inCorrigan (2000)) the approach of using relative
misreporting of mental health in a heterogenous sample of about a quarter of a million individuals, is novel.2 Our work also complements a recent set of papers that focus on
stigma in the case of Human Immunodeficiency Virus (HIV) (Thornton 2008, Derksen et al. 2014,Hoffmann et al. 2014,Ngatia 2011) and papers that match self-reported health measures to administrative health records (seeHarlow & Linet(1989),Baker et al.(2004), andJohnston et al.(2009)). These papers however, do not focus on mental health report-ing. Hence, while it may be intuitive and taken for granted that there is stigma in mental health, empirically documenting its existence using a large administrative database is novel.
2
Methods and data
For the empirical analysis, we use a unique data set from Australia. The 45 and Up Study is a survey of more than 250,000 individuals 45 years of age or older residing in New South Wales (NSW), the most populous state of Australia. The survey, with the
1In the working paper version (Bharadwaj et al. 2015), we construct a simple model of stigma and
choices in the face of stigma.
2Some recent work examines misreporting in mental health related visits to general practitioners
consent of all the participants, is linked to the individuals’ administrative health records, including prescription drugs and doctor visits. We use the data covering the period of 2007-2010 (233,081 observations). Panel A of TableB.1presents the descriptive statistics of demographic and socioeconomic variables in our analysis sample.
We investigate the extent of under-reporting of mental illness by matching self-reported mental health information in the 45 and Up Study to the administrative records of filled prescriptions for mental health disorders. The drugs for depression and other conditions are identified using the Anatomical Therapeutic Chemical (ATC) codes, listed in Ap-pendixA.1. We use two types of self-reported measures of mental health from the 45 and Up study - self reports of diagnosis and self reports of prescription drug use.
First, individuals are asked whether a doctor has ever told them that they have a list of health conditions, including mental disorders (see Appendix Figure B.1). In the ad-ministrative records, we can observe whether an individual has filled any prescriptions for depression drugs from September 2005 until the survey date. To evaluate the extent of under-reporting of mental illness, we calculate the proportion of individuals observed filling prescriptions for depression drugs who do not report that they have been diag-nosed with depression or anxiety.3 We also compute the under-reporting rates of other
health conditions: cardiovascular diseases (hypertension, heart disease, and stroke) and diabetes.
Second, in the 45 and Up Study, individuals are asked about their use of selected pre-scription drugs in the past four weeks (see Appendix Figure B.2). We calculate the under-reporting rate of depression drugs as a proportion of the individuals observed fill-ing a prescription for any of the three depression drugs4 who do not report using any of these drugs in the survey. We also estimate the under-reporting rates of drugs used for treatment of the following other conditions: cardiovascular and blood diseases (hyper-tension, congestive heart failure, high blood cholesterol, and thrombosis), diabetes, and other diseases (heartburn, gout, and thyroid disease).
3
Results
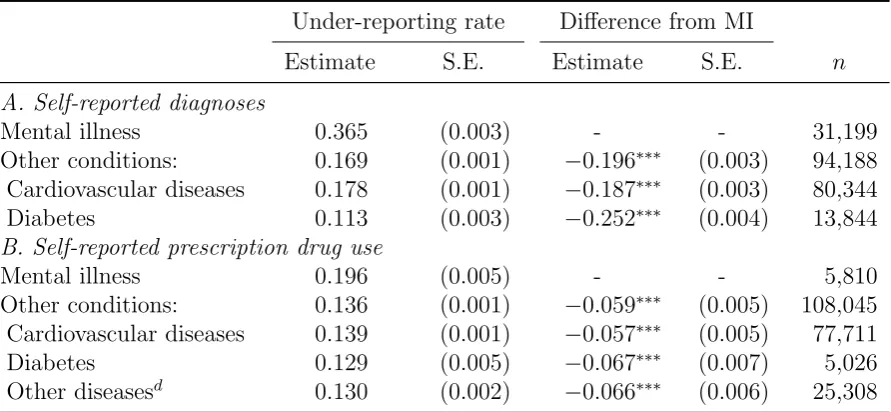
Table1presents the estimated under-reporting rates of mental disorders and other condi-tions. Panel A of Table1 shows that 36.5% of people observed using depression drugs in the administrative data do not report that they have been diagnosed with either depres-sion or anxiety. The average under-reporting rate of all other diagnoses is substantially lower at 17%. Diabetes has the lowest under-reporting rate (11%). Panel B of Table
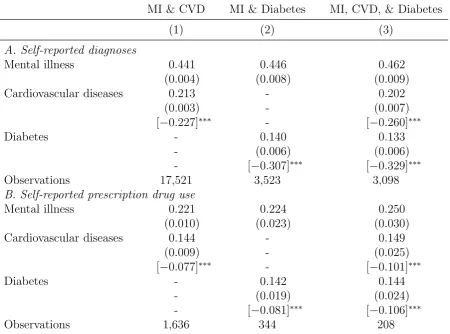
1 reports the under-reporting rates of prescription drugs. The under-reporting rate of depression drugs is equal to 20%. The under-reporting rates of the other drugs are lower (13%-14%). Table 2 examines under-reporting for a subset of people who use multiple drugs. This analysis is akin to an individual fixed-effects model. For example, we take an individual observed as taking drugs for both depression and diabetes, and examine the relative excess under-reporting of mental illness for the same individual. Column 2 in Ta-ble2shows that among people who take both drugs, mental illness diagnosis and drug use is under-reported 45% and 22% of the time, respectively, whereas diabetes diagnosis or drug use is under-reported only 14% of the time. Overall, the results presented in Tables
[image:5.595.78.524.303.509.2]1and 2 suggest that the stigma of mental illness can lead to substantial under-reporting of mental disorders in the survey data.
Table 1: The under-reporting rates of mental illness (MI) and other conditions
Under-reporting rate Difference from MI
Estimate S.E. Estimate S.E. n
A. Self-reported diagnoses
Mental illness 0.365 (0.003) - - 31,199 Other conditions: 0.169 (0.001) −0.196∗∗∗ (0.003) 94,188 Cardiovascular diseases 0.178 (0.001) −0.187∗∗∗ (0.003) 80,344 Diabetes 0.113 (0.003) −0.252∗∗∗ (0.004) 13,844
B. Self-reported prescription drug use
Mental illness 0.196 (0.005) - - 5,810 Other conditions: 0.136 (0.001) −0.059∗∗∗ (0.005) 108,045 Cardiovascular diseases 0.139 (0.001) −0.057∗∗∗ (0.005) 77,711 Diabetes 0.129 (0.005) −0.067∗∗∗ (0.007) 5,026 Other diseasesd 0.130 (0.002) −0.066∗∗∗ (0.006) 25,308
Notes: Standard errors (clustered at the individual level) in parentheses. ∗∗∗ indicates that the under-reporting rate of the condition is different from the under-reporting rate of mental illness at the 1% significance level.
Table 2: Within-individual differences in the under-reporting rates of mental illnesses (MI)
and other conditions
MI & CVD MI & Diabetes MI, CVD, & Diabetes
(1) (2) (3)
A. Self-reported diagnoses
Mental illness 0.441 0.446 0.462 (0.004) (0.008) (0.009) Cardiovascular diseases 0.213 - 0.202
(0.003) - (0.007) [−0.227]∗∗∗ - [−0.260]∗∗∗ Diabetes - 0.140 0.133
- (0.006) (0.006) - [−0.307]∗∗∗ [−0.329]∗∗∗ Observations 17,521 3,523 3,098
B. Self-reported prescription drug use
Mental illness 0.221 0.224 0.250 (0.010) (0.023) (0.030) Cardiovascular diseases 0.144 - 0.149
(0.009) - (0.025) [−0.077]∗∗∗ - [−0.101]∗∗∗ Diabetes - 0.142 0.144
- (0.019) (0.024) - [−0.081]∗∗∗ [−0.106]∗∗∗ Observations 1,636 344 208
Notes: The sample consists of individuals who take drugs for mental illness as well as cardiovascular disease and/or diabetes. MI stands for mental illness, and CVD for cardiovascular disease. Standard errors in parentheses. The differences between the under-reporting rates of respective condition and mental illnesses in square brackets.
∗∗∗ indicates that the reporting rate of the condition is different from the
Second, individuals may not recall that they have been diagnosed with a mental illness. This is unlikely in our setting as we only focus on recent treatments for depression. Moreover, if we only use the data on the prescription drug use in the past 12 months, the under-reporting rates of depression and other conditions change only slightly (32% and 15%, respectively). Another way of addressing this is shown in Figure B.3. Figure
B.3shows that among individuals who have been treated for depression for short periods of time, the under-reporting rate of mental illness diagnosis is higher than 50%. Among those who have been treated for depression for relatively long periods of time, the under-reporting rate of mental illnesses is close to 20%. Importantly, individuals are more likely to under-report mental illness compared to other conditions, irrespective of treatment intensity.5
Finally, we examine whether characteristics associated with mental illness under-reporting also predict health-seeking behavior. Appendix Table B.2 shows that males, individu-als without university degree, and those from Asian, African, or Middle Eastern eth-nic backgrounds are significantly more likely to under-report mental illness. We first identify individuals who are deemed to be in “need” of mental health treatment accord-ing to the Kessler Psychological Distress Scale (K10), as explained in Appendix A.2
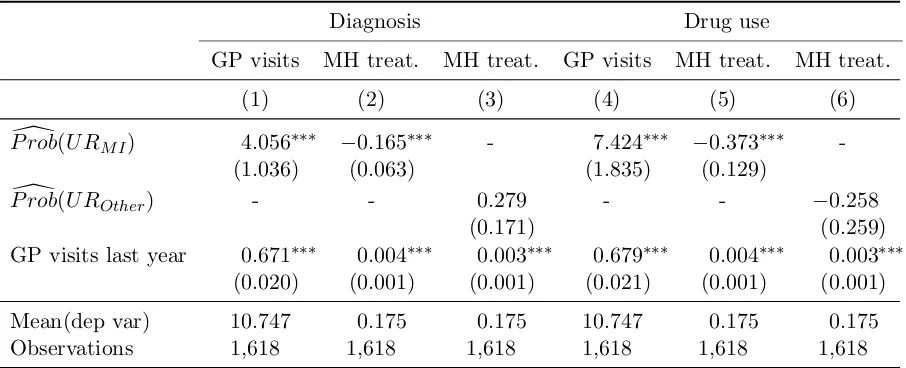
(n = 1,620). We then use the results from Appendix Table B.2 to predict the proba-bilities of under-reporting mental illness diagnosis and mental health drug use for these individuals. In the final step, we examine whether these predicted probabilities are cor-related with treatment-seeking behavior in the subsequent 12 months.6 Table 3 presents
the results. Consistent with our initial hypothesis that stigma might play a role in pre-venting health care seeking, we find that individuals with a higher predicted probability of under-reporting are also less likely to seek mental health care (even though they are more likely to seek care from a GP).
4
Concluding remarks
Conditional on taking prescription medication, we find that individuals are significantly more likely to under-report mental health ailments, compared to other conditions. We interpret the additional misreporting in mental health conditions as evidence of the stigma of mental health. Our interpretation of misreporting as evidence of stigma is based on a broad definition of stigma. Since we only observe individual agents’ reporting choices, we are unable to separate misreporting directly due to social discrimination concerns from misreporting due to the agent’s intrinsic motivations such as guilt, shame, self-image issues, etc. In our context, therefore, stigma is an amalgam of these forces. We posit
that these intrinsic motivations also arise indirectly from the same basic force—in the absence of discrimination concerns, there is nothing to feel shameful/guilty about. We do, however, attempt to separate this notion of stigma from concerns about labor market discrimination—since a large portion of our sample is retired, we can assume that for this subsample there is no labor market based statistical discrimination motive in their responses. In future work, we hope to shed light on the more nuanced differences between discrimination concerns and the related intrinsic motivations mentioned above.
Table 3: Variation in health care seeking by predicted probability of under-reporting of mental
illness and other conditions
Diagnosis Drug use
GP visits MH treat. MH treat. GP visits MH treat. MH treat.
(1) (2) (3) (4) (5) (6)
[
P rob(U RM I) 4.056∗∗∗ −0.165∗∗∗ - 7.424∗∗∗ −0.373∗∗∗
-(1.036) (0.063) (1.835) (0.129)
[
P rob(U ROther) - - 0.279 - - −0.258
(0.171) (0.259)
GP visits last year 0.671∗∗∗ 0.004∗∗∗ 0.003∗∗∗ 0.679∗∗∗ 0.004∗∗∗ 0.003∗∗∗ (0.020) (0.001) (0.001) (0.021) (0.001) (0.001)
Mean(dep var) 10.747 0.175 0.175 10.747 0.175 0.175
Observations 1,618 1,618 1,618 1,618 1,618 1,618
Notes: See AppendixA.2for the details on the sample. In Columns (1) and (4), the dependent variable is the number of GP visits in the next 12 months from the survey date and presented figures are OLS coefficients. In Columns (2), (3), (5), and (6), the dependent variable takes the value 1 if an individual took prescription drugs for depression/anxiety or visited a mental health professional in the next 12 months from the survey date and the value 0 otherwise and presented figures are probit average marginal effects. P rob[(U RM I) is the predicted probability of under-reporting mental illness diagnosis (in columns 1-2) or mental health drug use (in columns 4-5), calculated using the estimates presented in Appendix TableB.2. P rob[(U ROther) is the predicted probability of under-reporting other illness diagnosis (in column 3) or other drug use (in column 6). Standard errors (presented in parentheses) are calculated using bootstrap method with 250 replications. ∗∗∗denotes statistical significance at the 1% level.
References
AMH (2015), Australian Medicines Handbook. Australian Medicines Handbook : Ade-laide, S.Aust.
Baker, M., Stabile, M. & Deri, C. (2004), ‘What do self-reported, objective, measures of health measure?’, Journal of Human Resources39(4), 1067–1093.
Corrigan, P. W. (2000), ‘Mental health stigma as social attribution: Implications for research methods and attitude change’, Clinical Psychology: Science and Practice
7(1), 48–67.
Derksen, L., Muula, A. & van Oosterhout, J. (2014), ‘Love in the time of hiv: Theory and evidence on social stigma and health seeking behavior’. http://sites.google.com/ site/lauraderksen/files/DerksenJMP.pdf.
Goffman, E. (1963), Stigma: Notes on the management of spoiled identity, Simon and Schuster.
Harlow, S. D. & Linet, M. S. (1989), ‘Agreement between questionnaire data and med-ical records: the evidence for accuracy of recall.’, American Journal of Epidemiology
129(2), 233–48.
Hoffmann, V., Fooks, J. R. & Messer, K. D. (2014), ‘Measuring and mitigating hiv stigma: A framed field experiment’,Economic Development and Cultural Change 62(4), 701– 726.
Johnston, D. W., Propper, C. & Shields, M. A. (2009), ‘Comparing subjective and objec-tive measures of health: Evidence from hypertension for the income/health gradient’,
Journal of health economics28(3), 540–552.
Ngatia, M. (2011), ‘Social interactions and individual reproductive decisions’. http:// www.econ.yale.edu/conference/neudc11/papers/paper 335.pdf.
Palin, J., Goldner, E. M., Koehoorn, M. & Hertzman, C. (2011), ‘Primary mental health care visits in self-reported data versus provincial administrative records’, Health Rep
22(2), 41–7.
Rhodes, A. E., Lin, E. & Mustard, C. A. (2002), ‘Self-reported use of mental health ser-vices versus administrative records: should we care?’,International journal of methods in psychiatric research11(3), 125–133.
Thornton, R. L. (2008), ‘The demand for, and impact of, learning hiv status’,The Amer-ican economic review98(5), 1829.