City, University of London Institutional Repository
Citation
:
Alderman, J., Rolston, S., Gaster, M. & Atkin, C.J. (2016). A method of reducing
the drag of transport wings. Paper presented at the 34th AIAA Applied Aerodynamics
Conference, 13-17 June 2016, Washington D. C., USA.
This is the submitted version of the paper.
This version of the publication may differ from the final published
version.
Permanent repository link:
http://openaccess.city.ac.uk/16587/
Link to published version
:
https://arc.aiaa.org/doi/10.2514/6.2016-3115
Copyright and reuse:
City Research Online aims to make research
outputs of City, University of London available to a wider audience.
Copyright and Moral Rights remain with the author(s) and/or copyright
holders. URLs from City Research Online may be freely distributed and
linked to.
City Research Online:
http://openaccess.city.ac.uk/
[email protected]
American Institute of Aeronautics and Astronautics 1
A Method of Reducing the Drag of Transport Wings
James Alderman, Stephen Rolston
Airbus Group Innovations, Filton, BS34 7QW, UK
and
Michael Gaster, Chris Atkin
City University, London, EC1 V0HB, UK
The paper describes research work that has been carried out to reduce the viscous drag of transport aircraft wings by controlling the turbulent contamination on the attachment line. Laminar leading edges will reduce the boundary layer thickness downstream and thus reduce drag. This scenario was postulated by M. Gaster in a paper presented to the AIAA Seattle conference in 2008. The effect of maintaining a laminar attachment line on the overall flow on a wing has been modeled and drag reductions calculated. These values are compared with wind tunnel measurements of viscous drag of a wing with both laminar and turbulent attachment lines.
Nomenclature
CDv = Viscous drag coefficient
CDcfx = x component of skin friction drag
Cp = Pressure coefficient
Δ = Increment
Λ = Leading edge sweep (degrees) r = Leading edge nose radius (m)
Ue = Velocity component normal to leading edge (m/s)
U∞ = Free stream velocity (m/s)
t/c = Airfoil thickness to chord ratio ν = Kinematic viscosity (m2/s)
Ve = Velocity component along attachment line (m/s)
x = distance from attachment line normal to leading edge (m/s)
I.
Introduction
E discuss the potential drag reduction of transport aircraft wings so as to reduce fuel burn. The experiments describe the use of a small leading edge device, 'Gaster Slot', designed to inhibit leading edge contamination that causes the attachment line outboard of a swept wing to be wholly turbulent when the flow is above some critical Reynolds number. It is hypothesized that a laminar attachment line would enable some small local regions of chord wise laminar flow to exist close to the attachment line. It is conjectured that even a small amount of chord wise laminar flow would be beneficial and lead to some drag reduction. Modeling the flow over an airfoil with laminar leading edges followed by transition to turbulence shows limited overall skin-friction reduction compared with a fully turbulent flow, presumably because the boundary layers close to the nose, though laminar, are very thin. However, the wake thickness was found to be reduced significantly leading to a lower viscous drag. The current experiments used the Gaster slot on a swept wing wind tunnel model to test this hypothesis and to check whether any useful drag saving could indeed be obtained by a passive add-on device.
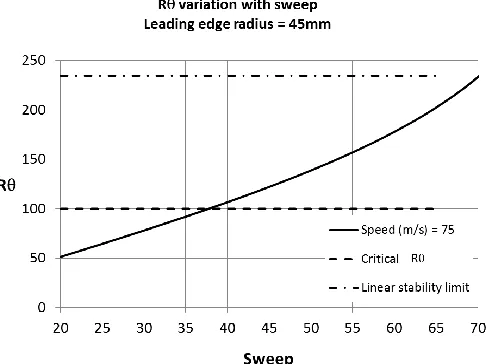
Figure 1 Sensitivity of R to sweep
II.
The Experiment
A low speed wind tunnel test in the Filton 12ft x 10ft wind tunnel was planned to investigate viscous drag reductions due to small extents of laminar flow. It is necessary to design the experiment to ensure the attachment line is naturally turbulent, requiring the leading edge Reynolds number Rθ to be above the critical value Rθ≈100. The attachment line Rθ can be calculated as shown in Equation 1 with knowledge of the attachment line velocity distribution.
Equation 1 Attachment line Rθ
It is convenient to use Rθ based on a simple expression for the swept laminar attachment line Hiemenz flow on the nose of the airfoil Equation 2. It is reasonably accurate to model the airfoil nose by a circular cylinder to provide an approximation that is a guide as to the state of the flow along the attachment line.
Equation 2 Swept Hiemenz approximation for Rθ
From the Hiemenz flow assumption it can be seen that Rθ increases with increased velocity, sweep and leading edge radius. Given that the maximum velocity of the proposed low speed atmospheric test facility is ≈ 87 m/s then sweep and leading edge radius can be used to
American Institute of Aeronautics and Astronautics 3
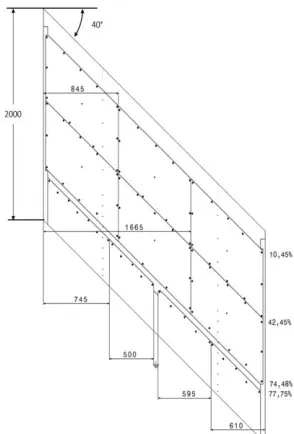
Figure 3 Plain wing attachment line state Figure 2 Plan view of wind tunnel model (sweep 40°)
The model was constructed with a solid aluminium leading edge of 10% chord with a surface finish better than 0.75 µm. The aerofoil profile aft of this section had a much relaxed surface finish requirement and was formed from 10 ‘Modulan’ panels attached to the aluminium substructure. Figure 2 shows a schematic of the model Λ=40°. The model was equipped with 3 rows of surface pressures taps with a high density of points around the attachment line and a single surface hot-film mounted far outboard on the leading edge. The model was mounted on an underfloor 6 component balance via 3 struts onto the turntable allowing the wing sweep to be varied. Additionally a large pitot wake rake was mounted downstream from the trailing edge to monitor sectional drag. To ensure the flow on the wing was nominally 2D in nature the wing had washout and endplates fitted. Additional 5 degree wedges were manufactured to allow the endplates if fitted to be mounted line of flight for 2 leading edge sweeps of 40° and 45°. The requirement for the nominally 2D flow was predominately for investigating the sectional drag increments from small regions of laminar flow, the endplates being removed when not using the wake rake since the endplates make the model harder to work on and limits the test envelope that can be achieved due to model stress.
(a)Tests on plain wing (sweep 45°)
[image:4.612.379.532.456.649.2]Figure 6 Gaster Slot devices tested
Figure 4 Gaster bleeding slot installed on wind tunnel model
Figure 5 Gaster slot key parameters
Clean wing
With device
[image:5.612.366.540.85.227.2]75m/s
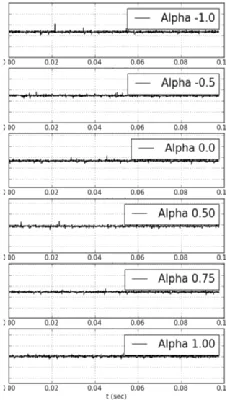
Figure 7 Attachment line state
(b) Gaster’s slot
The anti-contamination device used here is the ‘Gaster slot’
(Airbus Group Patent WO2008075106 A1). The device can be seen attached to the leading edge of the wind tunnel model in Figure 4. The device works by ingesting and diverting the incoming turbulent attachment line (red streamlines lines) into the Gaster slot and allows a fresh un-contaminated laminar attachment line (green streamlines lines) to grow from the lip of the device.
The Gaster Slot has some key geometric parameters that are shown in Figure 5. Calculations ahead of the wind tunnel test suggested that the attachment line would move less than
20mm for the expected test conditions. This effectively sets the “slot width” since the slot must cover the attachment line to operate correctly. The “lip height” must be large enough to ingest the turbulent attachment line with the remaining
parameters of “slot length” and “device length” selected to smoothly blend the lip into the leading edge surface. The Gaster slot devices used in these tests were fabricated using rapid prototyping techniques in both nylon and Titanium 6AL-4V using laser sintering machines. The devices were hand finished to a surface finish of Ra≈0.7μm. The use of rapid prototyping techniques allowed many devices to be “grown” for little additional cost allowing a systematic variation in geometric parameters to be investigated, Figure 6 shows some of the tested devices.
The Gaster slot is derived from the ‘Bump’2 that was used some 50 years ago on the Handley-Page wing mounted on a Lancaster bomber. That wing had turbulent contamination from the root that prevented the wing from performing properly. The ‘Bump’ shaped device was used to contain the contamination and allow the wing to operate as designed. However, the Bump’s operation was limited in alpha and for some reason it’s Reynolds number range and it became increasing difficult to devise a shape that would work at large values of Rθ close to the critical value for linear instability. The Gaster slot does not suffer these problems, indeed the device has been proven to re-laminarise attachment lines up to the stability limit and the alpha range of operation can be selected by selecting a suitable slot width.
[image:5.612.69.182.503.703.2]
American Institute of Aeronautics and Astronautics 5
Figure 8 Setup of Microphone Stethoscope
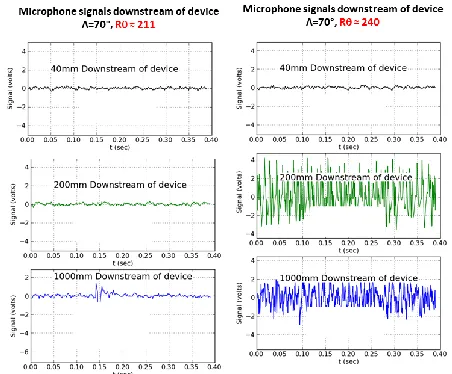
Figure 9 Microphone signals at high Rθ
with the device smoothly blended into the leading edge with fine modelling clay taking care to avoid steps.
Figure 7 presents typical hot-film signals for an alpha polar Λ≈45°, 75m/s with a device fitted where it is seen that the attachment line remains laminar for the range of incidences tested. The reason for the limited alpha range was the combined effects of model stress limitations (end plate rolling moment) and exceeding the under floor balance load limits (pitching moment).
(c) Gaster’s slot at high
RθIt has been seen that the Gaster slot can re-laminarise a turbulent attachment for Rθ≈120. This section will show how the attachment lines close to and exceeding the stability limit Rθ≈230 can also be re-laminarised with the Gaster slot. For these tests the wing endplates were removed and the wing sweep increased to Λ≈70° allowing Rθ above the stability limit to be achieved. To determine the attachment line state a microphone stethoscope was fixed to the leading edge at distances downstream of the Gaster slot lip as shown in Figure 8. Figure 9 show a summary of these speed polars (Rθ
variation) for Rθ = 211 and 240 left & right side of figure 8 respectively which is just below and above the stability limit Rθ≈230. Microphone signals are shown at distances of 40, 200
[image:6.612.309.535.322.509.2]Figure 10 Transition front visualised by china clay technique
Figure 11 linear eN stability analysis
III.
Laminar Flow Extent
It has been shown that the addition of the Gaster Slot allows the attachment line outboard of the device to be laminar when Ris between 100 to 230. Clearly when
Ra Gaster slot is not required since the attachment line will naturally re-laminarise. This section details how the laminar flow extent is determined for both upper and lower surfaces so that drag increments can be computed in subsequent sections. To visualise the extent of laminar flow on the wing the china-clay3 technique was utilised. The method relies on the differential rate of evaporation between laminar and turbulent boundary layers of a liquid absorbed into a solid. A solid layer of china-clay is sprayed onto the wing surface to form a white surface. The china clay surface is wetted with a liquid of the same refractive index and in this case Methyl Salicylate (Oil of
wintergreen) to form a transparent coating. When exposed to airflow the liquid evaporates revealing the white china-clay when the flow is turbulent due to the higher mixing in a turbulent boundary layer. Figure 10 shows a representative china clay image of a transition front, the transition front is spikey which is characteristic of cross flow dominated transition as would be expected with a Λ=45° swept wing. This result is confirmed using linear eN stability analysis methods available at Airbus: CoDS4 & LiLo5 with the CoDS method calculating both stationary and travelling cross flow modes. It is expected that the turbulence levels within the wind tunnel means travelling cross flow modes dominate in causing transition. Figure 11 shows a representative stability analysis for Λ=45°, V=75m/s, α=0.0°, this shows the pressure distribution and a NCF-NTS plot with the
American Institute of Aeronautics and Astronautics 7
Figure 12 Sectional drag increments
Figure 13 boundary layer θ development
IV.
Drag Measurements
We have seen that it is possible to have laminar flow at R above the critical level and that the leading edge maintains a proportion of laminar flow ≈ x/c 0.03 to 0.05 on the upper surface as measured in the wind tunnel. This section will continue to discuss how the drag increments were obtained and compared with a computational method.
The experimental procedure for evaluating the drag increments from a small run of laminar flow is to compare integrated wake rake profile drag with laminar flow and with a fully turbulent attachment line. For these tests the Gaster slot is installed onto the inner wing and an outboard mounted wake rake recorded over an alpha polar to give the CDv sectional drag polar. To obtain a fully turbulent reference a small 0.2mm diameter trip wire was added to
the Gaster slot to trip the laminar attachment line, since for the attachment line with Rθ > 100 this ensured the flow was fully turbulent as confirmed by the tip mounted hot-film. The repeatability of this test methodology was excellent with sectional drag increments repeated to ≈ 0.15 drag counts.
The computed viscous drag increments were evaluated for cases with a fully turbulent attachment line as well as for the situation when the attachment line was laminar
with transition set at the experimentally determined locations. The method chosen to evaluate the drag increments was the Airbus CALLISTO6 Lag-entrainment swept-tapered boundary layer solver that allows the viscous drag build up to be evaluated based on the sectional geometry, pressure distribution and transition location. Figure 12 presents sectional drag increments defined as the difference in viscous drag from a fully turbulent boundary layer to a part laminar boundary layer ΔCD = CDlaminar - CDturbulent for the
experimental wake rake derived CDv increments(black
squares) and for the Lag-entrainment CDv increments
(red circles). It can be seen that the magnitude and shape of ΔCD distribution are in good agreement across
the alpha range tested. The differences between these
two calculations were considered as the change in viscous drag due to thinning the boundary layer over the aft part of the wing arising from a laminar attachment line and limited chord wise laminar flow extent. Since the attachment line is thinner the boundary layer is thickened less by strong adverse pressure gradients found through a shock wave on a transonic wing and in the pressure recovery to the trailing edge. For comparison the lag-entrainment CDcfx increment is also shown (green
triangles) indicating that short runs of laminar flow give drag reduction in excess of that from skin friction alone. The good agreement between experiment and the Lag-entrainment method gives confidence in the computational method to go on to predict aircraft level drag increments with limited extents of laminar flow.
[image:8.612.73.300.477.626.2]Conclusions
Experiments were carried out to verify that laminar flow could be re-established on a swept attachment lines up to the stability limit outboard of a turbulent root flow and that the resulting laminar attachment line and small amount of laminar flow provided some reduction in drag above that due to skin friction. All geometries of the ‘Gaster Slot’ worked well which indicates that the detail design is not that fussy. The drag reduction arises because the boundary layers are slightly thinner over the upper surface of the wing section when they develop from a thin laminar attachment line since they are magnified less by adverse pressure gradients. The reduction in drag measured agreed very well with the computational model. This is important since it allows predictions to be made at realistic flight Reynolds numbers to compute aircraft level drag assessments.
The work presented was funded by the United Kingdom TSB under Smart Active Wing of the Future (SAWoF) which is an Airbus led project; the work presented was conducted between 2010 and 2013 and is collaboration between Airbus Group Innovations and City University London.
References
1
M.Gaster, “Establishment of laminar boundary layer flow on an aerofoil body” Patent WO2008075106 A1, 2007.
2
M.Gaster, ”A simple device for preventing contamination on swept leading edges”Journal of the Royal Aeronautical Society, Vol 69, p. 788, November 1965.
3
E.J. Richards, F.H. Burstall, “The ‘China-clay’ method of indicating transition”. R&M 2126, 1945
4
C.Atkin, “User Guide for coDS v5.5” QinetiQ/07/02910, 2013
5
G.Schrauf “LILO 2.1 Users guide and tutorial, Airbus 2006.