This is a repository copy of
Search for supersymmetry in final states with missing
transverse momentum and multiple b-jets in proton-proton collisions at √s=13 TeV with the
ATLAS detector
.
White Rose Research Online URL for this paper:
http://eprints.whiterose.ac.uk/135793/
Version: Published Version
Article:
Aaboud, M., Aad, G., Abbott, B. et al. (81 more authors) (2018) Search for supersymmetry
in final states with missing transverse momentum and multiple b-jets in proton-proton
collisions at √s=13 TeV with the ATLAS detector. Journal of High Energy Physics, 2018 (6).
107. ISSN 1126-6708
https://doi.org/10.1007/JHEP06(2018)107
eprints@whiterose.ac.uk https://eprints.whiterose.ac.uk/
Reuse
This article is distributed under the terms of the Creative Commons Attribution (CC BY) licence. This licence allows you to distribute, remix, tweak, and build upon the work, even commercially, as long as you credit the authors for the original work. More information and the full terms of the licence here:
https://creativecommons.org/licenses/
Takedown
If you consider content in White Rose Research Online to be in breach of UK law, please notify us by
JHEP06(2018)107
Published for SISSA by SpringerReceived: November 7, 2017 Revised: March 25, 2018 Accepted: June 11, 2018 Published: June 21, 2018
Search for supersymmetry in final states with missing
transverse momentum and multiple
b
-jets in
proton-proton collisions at
√
s
= 13
TeV with the
ATLAS detector
The ATLAS collaboration
E-mail: atlas.publications@cern.ch
Abstract:A search for supersymmetry involving the pair production of gluinos decaying
via third-generation squarks into the lightest neutralino ( ˜χ0
1) is reported. It uses LHC proton-proton collision data at a centre-of-mass energy √s = 13 TeV with an integrated luminosity of 36.1 fb−1 collected with the ATLAS detector in 2015 and 2016. The search is performed in events containing large missing transverse momentum and several energetic jets, at least three of which must be identified as originating from b-quarks. To increase the sensitivity, the sample is divided into subsamples based on the presence or absence of electrons or muons. No excess is found above the predicted background. For ˜χ01 masses below approximately 300 GeV, gluino masses of less than 1.97 (1.92) TeV are excluded at 95% confidence level in simplified models involving the pair production of gluinos that decay via top (bottom) squarks. An interpretation of the limits in terms of the branching ratios of the gluinos into third-generation squarks is also provided. These results improve upon the exclusion limits obtained with the 3.2 fb−1 of data collected in 2015.
Keywords: Hadron-Hadron scattering (experiments)
JHEP06(2018)107
Contents
1 Introduction 1
2 SUSY signal models 2
3 ATLAS detector 4
4 Data and simulated event samples 5
5 Event reconstruction 8
6 Event selection 10
6.1 Discriminating variables 10
6.2 Modelling of the data 11
6.3 Analysis strategy and background treatment 12
6.4 Cut-and-count analysis 12
6.5 Multi-bin analysis 18
7 Systematic uncertainties 23
8 Results 25
9 Interpretation 26
9.1 Model-independent exclusion limits 26
9.2 Model-dependent exclusion limits 31
10 Conclusion 33
The ATLAS collaboration 41
1 Introduction
Supersymmetry (SUSY) [1–6] is a generalisation of space-time symmetries that predicts new bosonic partners for the fermions and new fermionic partners for the bosons of the Standard Model (SM). If R-parity is conserved [7], SUSY particles are produced in pairs and the lightest supersymmetric particle (LSP) is stable. The scalar partners of the left-and right-hleft-anded quarks, the squarks ˜qL and ˜qR, can mix to form two mass eigenstates ˜
q1 and ˜q2, ordered by increasing mass. SUSY can solve the hierarchy problem [8–11] reducing unnatural tuning in the Higgs sector by orders of magnitude, provided that the superpartners of the top quark have masses not too far above the weak scale. The large top Yukawa coupling results in significant ˜tL-˜tRmixing so that the mass eigenstate ˜t1is typically
JHEP06(2018)107
lighter than the other squarks [12,13]. Because of the SM weak-isospin symmetry, the mass of the lightest bottom squark ˜b1is also expected to be close to the weak scale. The fermionic partners of the gluons, the gluinos (˜g), are also motivated by naturalness [14] to have a mass around the TeV scale in order to limit their contributions to the radiative corrections to the top squark masses. For these reasons, and because the gluinos are expected to be pair-produced with a high cross-section at the Large Hadron Collider (LHC), the search for gluino production with decays via top and bottom squarks is highly motivated at the LHC. This paper presents a search for pair-produced gluinos decaying via top or bottom squarks in events with multiple jets originating from the hadronisation of b-quarks (b-jets in the following), high missing transverse momentum of magnitude Emiss
T , and potentially additional light-quark jets and/or an isolated charged lepton.1 The dataset consists of 36.1 fb−1 of proton-proton (pp) collision data collected with the ATLAS detector [15] at a centre-of-mass energy of 13 TeV in 2015 and 2016. Interpretations are provided in the context of several effective simplified models [16–18] probing various gluino decays into third-generation squarks and the LSP. The latter is assumed to be the lightest neutralino
˜
χ0
1, a linear superposition of the superpartners of the neutral electroweak and Higgs bosons. One model also features the lightest charginos ˜χ±1, which are linear superpositions of the superpartners of the charged electroweak and Higgs bosons. The results supersede the ones obtained using 3.2 fb−1 of data collected in 2015 using the same strategy [19]. Pair-produced gluinos with top-squark-mediated decays have also been searched for using events containing pairs of same-sign leptons or three leptons using 13 TeV data [20,21]. The same-sign/three lepton search is comparable in sensitivity to the search presented in this paper only when the masses of the gluino and the LSP are very close to each other. Similar searches performed using the 13 TeV dataset collected in 2015 and 2016 by the CMS experiment have produced results comparable to the ATLAS searches [22–25].
2 SUSY signal models
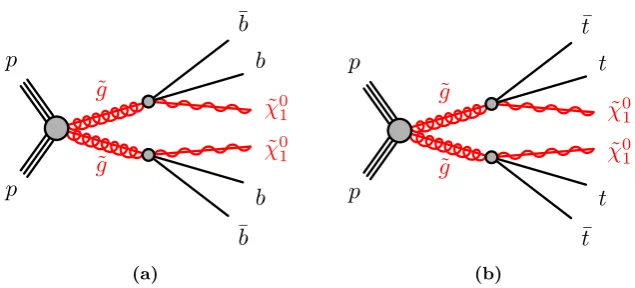
Various simplified SUSY models [17,18] are employed to optimise the event selection and/or interpret the results of the search. In terms of experimental signature, they all contain at least four b-jets originating from either gluino or top quark decays, and two ˜χ01, which escape the detector unseen, resulting in highEmissT .
Gluinos are assumed to be pair-produced and to decay either as ˜g → ˜b1¯b or ˜g → ˜t1¯t (the charge conjugate process is implied throughout this paper). The following top and bottom squark decays are then considered: ˜t1 →tχ˜01, ˜t1 →bχ˜
+
1 and ˜b1 →bχ˜01.2 In all cases, the top or bottom squarks are assumed to be off-shell in order to have simplified models with only two parameters: the gluino and ˜χ01 masses.3 All other sparticles are decoupled.
1The term “lepton” refers exclusively to an electron or a muon in this paper. 2The decay ˜b
1→tχ˜−1 is also possible but, following ˜g→˜b1¯b, it yields the same final state as ˜g→˜t∗1t→
(¯bχ˜−1)t, which is already considered.
3The analysis sensitivity is found to be mostly independent of the top and bottom squark masses, except
JHEP06(2018)107
˜
g
˜
g
p p
˜
χ01 ¯ b
b
˜
χ0 1
b ¯ b
(a)
˜
g
˜
g
p p
˜
χ01 ¯
t
t
˜
χ01
t
¯
t
[image:5.595.139.457.90.234.2](b)
Figure 1. The decay topologies in the (a) Gbb and (b) Gtt simplified models.
Two simplified models are used to optimise the event selection and to interpret the results. In the Gbb (Gtt) model, illustrated in figure1(a) (1(b)), each gluino undergoes an effective three-body decay ˜g →b¯bχ˜01 (˜g→ tt¯χ˜01) via off-shell bottom (top) squarks, with a branching ratio of 100%. The Gbb model is the simplest in terms of particle multiplicity, resulting in the minimal common features of four b-jets and two ˜χ01. In addition to these particles, the Gtt model produces four W bosons originating from the top quark decays:
t→W b. The presence of these four W bosons motivates the design of signal regions with a higher jet multiplicity than for Gbb models, and in some cases with at least one isolated electron or muon.
This paper includes an interpretation that probes the sensitivity of the search as a function of the gluino branching ratio, in addition to the gluino and ˜χ01 masses. Similar interpretations have been performed by the CMS collaboration [24, 27]. For that inter-pretation a third gluino decay is considered: ˜g →t¯bχ˜−1 (via the off-shell top squark decay ˜
t∗
1 → ¯bχ˜
−
1). The ˜χ
−
1 is then forced to decay as ˜χ
±
1 →W∗χ˜01 → ff¯′χ˜01 (where f denotes a fermion). To keep the number of model parameters at only two, the mass difference be-tween the ˜χ±1 and the ˜χ0
1is fixed to 2 GeV. Such a small mass-splitting between the ˜χ
±
1 and the ˜χ01 is typical of models where the ˜χ01 is dominated by the higgsinos, the superpartners of the neutral Higgs boson. Such models are well motivated by naturalness. The products of the decay W∗
→ ff¯′ are typically too soft to be detected, except for very large mass
differences between the gluino and the ˜χ±1. Thus, in this model, the gluino can decay as either ˜g → b¯bχ˜10, ˜g → t¯bχ˜
−
1 (with ˜χ
−
1 → ff¯′χ˜01) or ˜g → t¯tχ˜01, with the sum of individual branching ratios adding up to 100%. This model probes more realistic scenarios where the branching ratio for either ˜g→b¯bχ˜01 or ˜g→tt¯χ˜01 is not 100%, and where one, two or three top quarks, and thus on-shellW bosons, are possible in the final state, in between the Gbb (no top quarks) and Gtt (four top quarks) decay topologies. The decay topologies that are considered in the variable branching ratio model are illustrated in figure2. The model also includes the Gbb and Gtt decay topologies illustrated in figure 1. A limited set of 10 mass points were generated for this variable branching ratio model with mg˜ varying from 1.5 TeV to 2.3 TeV and mχ˜0
1 varying from 1 GeV to 1 TeV.
JHEP06(2018)107
˜ g ˜ g ˜ χ− 1 ˜ χ− 1 p pt ¯b
f ¯ f′ ˜ χ0 1
t ¯b
f ¯ f′ ˜ χ0 1 (a) ˜ g ˜ g ˜ χ− 1 p p ˜ χ0 1 ¯ t t
t ¯b f
¯
f′
˜
χ01
(b) ˜ g ˜ g ˜ χ− 1 p p ˜ χ0 1 ¯b b
[image:6.595.138.457.89.386.2]t ¯b f ¯ f′ ˜ χ0 1 (c) ˜ g ˜ g p p ˜ χ0 1 ¯ t t ˜ χ0 1 b ¯ b (d)
Figure 2. The additional decay topologies of the variable gluino branching ratio model in addition to the ones of figure 1. (a) Both gluinos can decay as ˜g → t¯bχ˜−1 with ˜χ
−
1 → ff¯′χ˜01, or only one
can with the other decaying as (b) ˜g→t¯tχ˜01or (c) ˜g→b¯bχ˜01. (d) Finally, one gluino can decay as
˜
g →t¯tχ˜0
1 and the other as ˜g →b¯bχ˜01. The charge conjugate processes are implied. The fermions
originating from the ˜χ±1 decay are typically soft because the mass difference between the ˜χ
±
1 and
the ˜χ01 is fixed to 2 GeV.
The technical implementation of the simulated samples produced from these models is described in section4.
3 ATLAS detector
The ATLAS detector is a multipurpose particle physics detector with a forward-backward symmetric cylindrical geometry and nearly 4πcoverage in solid angle.4 The inner tracking detector (ID) consists of silicon pixel and microstrip detectors covering the pseudorapidity region |η| < 2.5, surrounded by a transition radiation tracker, which enhances electron
4ATLAS uses a right-handed coordinate system with its origin at the nominal interaction point in the
centre of the detector. The positive x-axis is defined by the direction from the interaction point to the centre of the LHC ring, with the positive y-axis pointing upwards, while the beam direction defines the z-axis. Cylindrical coordinates (r, φ) are used in the transverse plane,φbeing the azimuthal angle around thez-axis. The pseudorapidity η is defined in terms of the polar angleθ byη =−ln tan(θ/2). Rapidity is defined as y = 0.5 ln[(E+pz)/(E−pz)] where E denotes the energy and pz is the component of the
JHEP06(2018)107
identification in the region |η|<2.0. Before the start of Run 2, the new innermost pixel layer, the insertable B-layer (IBL) [28], was inserted at a mean sensor radius of 3.3 cm. The ID is surrounded by a thin superconducting solenoid providing an axial 2 T magnetic field and by a fine-granularity lead/liquid-argon (LAr) electromagnetic calorimeter covering
|η|<3.2. A steel/scintillator-tile calorimeter provides coverage for hadronic showers in the central pseudorapidity range (|η|< 1.7). The endcaps (1.5 < |η| < 3.2) of the hadronic calorimeter are made of LAr active layers with either copper or tungsten as the absorber material. The forward region (3.1 < |η| < 4.9) is instrumented with a LAr calorimeter for both the EM and hadronic measurements. A muon spectrometer with an air-core toroidal magnet system surrounds the calorimeters. Three layers of high-precision tracking chambers provide coverage in the range |η| < 2.7, while dedicated fast chambers allow triggering in the region |η|<2.4. The ATLAS trigger system [29] consists of a hardware-based level-1 trigger followed by a software-hardware-based high-level trigger (HLT).
4 Data and simulated event samples
The data used in this analysis were collected by the ATLAS detector from pp collisions produced by the LHC at a centre-of-mass-energy of 13 TeV and 25 ns proton bunch spacing over the 2015 and 2016 data-taking periods. The full dataset corresponds to an integrated luminosity of 36.1 fb−1 after the application of beam, detector and data-quality require-ments. The uncertainty in the combined 2015+2016 integrated luminosity is 2.1%. It is derived, following a methodology similar to that detailed in ref. [30], from a preliminary calibration of the luminosity scale using x-y beam-separation scans performed in August 2015 and May 2016. Events are required to pass anEmiss
T trigger with thresholds of 70 GeV, 100 GeV and 110 GeV at the HLT level for the 2015, early 2016 and late 2016 datasets, respectively. These triggers are fully efficient for events passing the preselection defined in section 6, which requires the offline reconstructed Emiss
T to exceed 200 GeV. There are on average 24 inelasticpp collisions (the interactions other than the hard scatter are referred to as “pile-up”) in the dataset.
Samples of Monte Carlo (MC) simulated events are used to model the signal and background processes in this analysis, except multijet processes, which are estimated from data. SUSY signal samples in which each gluino decays into b¯bχ˜01, tt¯χ˜01, or t¯bχ˜
−
1 were generated with up to two additional partons usingMadGraph5 aMC@NLO [31] v2.2.2 at
leading order (LO) with the NNPDF 2.3 [32] parton distribution function (PDF) set. These samples were interfaced to Pythiav8.186 [33] for the modelling of the parton showering,
hadronisation and underlying event.
The dominant background in the signal regions is the production of t¯t pairs with additional high transverse momentum (pT) jets. For the generation of t¯t and single top quarks in the W t- and s-channels the Powheg-Box [34] v2 event generator with the
CT10 [35] PDF set in the matrix element calculations was used. Electroweak t-channel single-top-quark events were generated using the Powheg-Box v1 event generator. This
event generator uses the four-flavour scheme for the next-to-leading order (NLO) matrix elements calculations together with the fixed four-flavour PDF set CT10f4. For all processes
JHEP06(2018)107
involving top quarks, top-quark spin correlations are preserved. In thet-channel, top quarks were decayed using MadSpin [36]. The parton shower, fragmentation, and the underlying event were simulated using Pythia v6.428 [37] with the CTEQ6L1 PDF set [38]. The
hdamp parameter inPowheg, which controls thepT of the first additional emission beyond the Born level and thus regulates thepTof the recoil emission against thet¯tsystem, was set to the mass of the top quark (mtop= 172.5 GeV). All events with at least one leptonically decaying W boson are included. Single-top and t¯t events in which all top quarks decay hadronically do not contain sufficient Emiss
T to contribute significantly to the background. Smaller backgrounds in the signal region come from the production of t¯tpairs in asso-ciation withW/Z/hbosons and possibly additional jets, and production ofttt¯¯t,W/Z+jets and W W/W Z/ZZ (diboson) events. Other potential sources of background, such as the production of three top quarks or three gauge bosons, are expected to be negligible. The production of t¯t pairs in association with electroweak vector bosons W and Z was mod-elled by samples generated at LO using MadGraph5 aMC@NLO v2.2.2 and showered
withPythia v8.186, while samples to model t¯tH production were generated using
Mad-Graph5 aMC@NLO v2.2.1 and showered withHerwig++ [39] v2.7.1. These samples are
described in detail in ref. [40]. MadGraph5 aMC@NLO was also used to simulate thet¯tt¯t
production and the showering was performed with Pythia v8.186. The W/Z+jets
pro-cesses were simulated using the Sherpa v2.2.0 [41] event generator, while Sherpa v2.1.1
was used to simulate diboson production processes. Matrix elements for theW/Z+jets and diboson processes were calculated using Comix [42] and OpenLoops [43] and merged with
the Sherpa parton shower [44] using the ME+PS@NLO prescription [45]. The Sherpa
diboson sample cross-section was scaled down to account for its use ofαQED = 1/129 rather than 1/132, corresponding to the use of current Particle Data Group [46] parameters, as input to the Gµ scheme [47]. Samples generated using MadGraph5 aMC@NLO v2.2.2
were produced with the NNPDF 2.3 PDF set and W/Z+jets samples were generated with the NNPDF 3.0 PDF set [48], while all other samples used CT10 PDFs.
For all samples, except the ones generated using Sherpa, the EvtGen v1.2.0
pro-gram [49] was used to simulate the properties of the bottom- and charm-hadron decays.
All Pythia v6.428 samples used the PERUGIA2012 [50] set of tuned parameters (tune)
for the underlying event, while Pythia v8.186 and Herwig++ showering were run with
the A14 [51] and UEEE5 [52] underlying-event tunes, respectively. In-time and out-of-time pile-up interactions from the same or nearby bunch-crossings were simulated by overlay-ing additional pp collisions generated by Pythia v8.186 using the A2 tune [53] and the
MSTW2008LO parton distribution function set [54] on top of the hard-scattering events. Details of the sample generation and normalisation are summarised in table 1. Additional samples with different event generators and settings are used to estimate systematic un-certainties in the backgrounds, as described in section 7.
All simulated event samples were passed through the full ATLAS detector simulation usingGeant4 [55], with the exception of signal samples in which at least one gluino decays
as ˜g→b¯bχ˜10 or ˜g→t¯bχ˜
−
1, which were passed through a fast simulation that uses a parame-terisation for the calorimeter response [56] andGeant4 for the ID and the muon
JHEP06(2018)107
Process Event Generator Tune PDF set Cross-section+ fragmentation/hadronisation order
SUSY signal MadGraph5aMC@NLO v2.2.2 A14 NNPDF2.3 NLO+NLL [57–62]
+Pythiav8.186
tt¯ Powheg-Boxv2 PERUGIA2012 CT10 NNLO+NNLL [64]
+Pythiav6.428
Single top Powheg-Boxv1 or v2 PERUGIA2012 CT10 NNLO+NNLL [65–67]
+Pythiav6.428
t¯tW/t¯tZ/4-tops MadGraph5aMC@NLO v2.2.2 A14 NNPDF2.3 NLO [68]
+Pythiav8.186
t¯tH MadGraph5aMC@NLO v2.2.1 UEEE5 CT10 NLO [69]
+Herwig++ v2.7.1
Diboson Sherpav2.1.1 Default CT10 NLO [47]
W W,W Z,ZZ
[image:9.595.84.509.85.389.2]W/Z+jets Sherpav2.2.0 Default NNPDF3.0 NNLO [70]
Table 1. List of event generators used for the different processes. Information is given about the underlying-event tunes, the PDF sets and the pQCD highest-order accuracy used for the normali-sation of the different samples.
The signal samples are normalised using the best cross-section calculations at NLO in the strong coupling constant, adding the resummation of soft gluon emission at next-to-leading-logarithm (NLL) accuracy [57–61]. The nominal cross-section and the uncertainty are taken from an envelope of cross-section predictions using different PDF sets and fac-torisation and renormalisation scales, as described in ref. [62]. The cross-section of gluino pair-production in these simplified models is 14±3 fb for a gluino mass of 1.5 TeV, falling to 1.0±0.3 fb for 2 TeV mass gluinos. All background processes are normalised using the best available theoretical calculation for their respective cross-sections. The order of this calculation in perturbative QCD (pQCD) for each process is listed in table 1. For t¯t, the largest background, this corresponds to a cross-section of 831.8 pb.
Finally, contributions from multijet background are estimated from data using a pro-cedure described in ref. [63], which performs a smearing of the jet response in data events with well-measured Emiss
T (so-called “seed events”). The response function is derived in Monte Carlo dijet events and is different for b-tagged and non-b-tagged jets.
JHEP06(2018)107
5 Event reconstruction
Interaction vertices from the proton-proton collisions are reconstructed from at least two tracks with pT >0.4 GeV, and are required to be consistent with the beamspot envelope. The primary vertex is identified as the one with the largest sum of squares of the transverse momenta from associated tracks (P
|pT,track|2) [71].
Basic selection criteria are applied to define candidates for electrons, muons and jets in the event. An overlap removal procedure is applied to these candidates to prevent double-counting. Further requirements are then made to select the final signal leptons and jets from the remaining candidates. The details of the candidate selections and of the overlap removal procedure are given below.
Candidate jets are reconstructed from three-dimensional topological energy clus-ters [72] in the calorimeter using the anti-ktjet algorithm [73,74] with a radius parameter
of 0.4 (small-R jets). Each topological cluster is calibrated to the electromagnetic scale response prior to jet reconstruction. The reconstructed jets are then calibrated to the par-ticle level by the application of a jet energy scale (JES) derived from √s= 13 TeV data and simulations [75]. Quality criteria are imposed to reject events that contain at least one jet arising from non-collision sources or detector noise [76]. Further selections are applied to reject jets that originate from pile-up interactions by means of a multivariate algorithm using information about the tracks matched to each jet [77]. Candidate jets are required to have pT > 20 GeV and |η| < 2.8. After resolving overlaps with electrons and muons, selected jets are required to satisfy the stricter requirement of pT >30 GeV.
A jet is tagged as ab-jet candidate by means of a multivariate algorithm using informa-tion about the impact parameters of inner detector tracks matched to the jet, the presence of displaced secondary vertices, and the reconstructed flight paths of b- and c-hadrons in-side the jet [78,79]. The b-tagging working point corresponding to an efficiency of 77% to identify b-jets with pT > 20 GeV, as determined from a sample of simulated t¯t events, is found to be optimal for the statistical significance of this search. The corresponding rejec-tion factors against jets originating from c-quarks, τ-leptons and light quarks and gluons in the same sample at this working point are 6, 22 and 134, respectively.
After resolving the overlap with leptons, the candidate small-Rjets are re-clustered [80] into large-Rjets using the anti-ktalgorithm with a radius parameter of 0.8. The calibration
from the input small-R jets propagates directly to the re-clustered jets. These re-clustered jets are then trimmed [80–83] by removing subjets whose pT falls below 10% of the pT of the original re-clustered jet. The resulting large-Rjets are required to havepT >100 GeV and |η| < 2.0. When it is not explicitly stated otherwise, the term “jets” in this paper refers to small-R jets.
JHEP06(2018)107
Leptons are selected from the candidates that survive the overlap removal procedure if they fulfil a requirement on the scalar sum ofpTof additional inner detector tracks in a cone around the lepton track. This isolation requirement is defined to ensure a flat efficiency of around 99% across the whole electron transverse energy and muon transverse momentum ranges. The angular separation between the lepton and the b-jet ensuing from a semilep-tonic top quark decay narrows as thepTof the top quark increases. This increased collima-tion is accounted for by setting the radius of the isolacollima-tion cone to min(0.2, 10 GeV/plepT ), where plepT is the lepton pT expressed in GeV. Selected electrons are further required to meet the “tight” quality criteria [84, 85]. Electrons (muons) are matched to the primary vertex by requiring the transverse impact parameterd0of the associated ID track to satisfy
|d0|/σd0 <5 (3), whereσd0 is the measured uncertainty of d0, and the longitudinal impact
parameter z0 to satisfy |z0sinθ| < 0.5 mm.5 In addition, events containing one or more muon candidates with|d0|(|z0|)> 0.2 mm (1 mm) are rejected to suppress cosmic rays.
Overlaps between candidate objects are removed sequentially. Firstly, electron candi-dates that lie a distance6∆R <0.01 from muon candidates are removed to suppress contri-butions from muon bremsstrahlung. Overlaps between electron and jet candidates are re-solved next, and finally, overlaps between remaining jets and muon candidates are removed. Overlap removal between electron and jet candidates aims to resolve two sources of ambiguity: it is designed, firstly, to remove jets that are formed primarily from the shower-ing of a prompt electron and, secondly, to remove electrons that are produced in the decay chains of hadrons. Consequently, any non-b-tagged jet whose axis lies ∆R < 0.2 from an electron is discarded. Electrons withET<50 GeV are discarded if they lie ∆R <0.4 from the axis of any remaining jet and the corresponding jet is kept. For higher-ET electrons, the latter removal is performed using a threshold of ∆R= min(0.4,0.04 + 10 GeV/ET) to increase the acceptance for events with collimated top quark decays.
The procedure to remove overlaps between muon and jet candidates is designed to remove those muons that are likely to have originated from the decay of hadrons and to retain the overlapping jet. Jets and muons may also appear in close proximity when the jet results from high-pTmuon bremsstrahlung, and in such cases the jet should be removed and the muon retained. Such jets are characterised by having very few matching inner detector tracks. Therefore, if the angular distance ∆R between a muon and a jet is lower than 0.2, the jet is removed if it is not b-tagged and has fewer than three matching inner detector tracks. Like the electrons, muons withpTbelow (above) 50 GeV are subsequently discarded if they lie within ∆R= 0.4 (∆R= min(0.4,0.04 + 10 GeV/pT)) of any remaining jet.
The missing transverse momentum (Emiss
T ) in the event is defined as the magnitude of the negative vector sum (p~Tmiss) of the transverse momenta of all selected and calibrated objects in the event, with an extra term added to account for energy deposits that are not associated with any of these selected objects. This “soft” term is calculated from inner detector tracks matched to the primary vertex to make it more resilient to contamination from pile-up interactions [87,88].
5Both the transverse and longitudinal impact parameters are defined with respect to the selected primary
vertex.
6∆R=p
(∆y)2+ (∆φ)2 defines the distance in rapidityyand azimuthal angleφ.
JHEP06(2018)107
Corrections derived from data control samples are applied to simulated events to ac-count for differences between data and simulation in the reconstruction efficiencies, mo-mentum scale and resolution of leptons, in the efficiency and fake rate for identifyingb-jets, and in the efficiency for rejecting jets originating from pile-up interactions.
6 Event selection
The event selection criteria are defined based on kinematic requirements for the objects defined in section 5. Other discriminating event-based variables, described in section 6.1, are used to further reject the background. Two sets of preselection criteria targeting the 0-lepton and the 1-lepton channels are presented in section6.2. The modelling of the data in these regions is also discussed in that section. The general analysis strategy and the treatment of background sources is presented in section6.3. Finally, the event selection for the cut-and-count and multi-bin analyses are discussed in sections6.4and6.5, respectively.
6.1 Discriminating variables
The effective mass variable (meff) is defined as:
meff =
X
i
pjeti
T +
X
j
pℓj
T +ETmiss,
where the first and second sums are over the selected jets (Njet) and leptons (Nlepton), respectively. It typically has a much higher value in pair-produced gluino events than in background events.
In regions with at least one selected lepton, the transverse mass mT composed of the
pT of the leading selected lepton (ℓ) and ETmiss is defined as:
mT =
q
2pℓ
TETmiss{1−cos[∆φ(~pmissT , ~pℓT)]}.
It is used to reduce the t¯t and W+jets background events in which a W boson decays leptonically. Neglecting resolution effects, the mT distribution for these backgrounds has an expected upper bound corresponding to the W boson mass and typically has higher values for Gtt events. Another useful transverse mass variable is mbT-jets,min, the minimum transverse mass formed byEmiss
T and any of the three highest-pT b-tagged jets in the event:
mbT-jets,min= mini≤3
q
2pb-jeti
T ETmiss{1−cos[∆φ(~pmissT , ~p
b-jeti
T )]}
.
ThembT-jets,mindistribution has an expected upper bound corresponding to the top quark mass fort¯t events with a semileptonic top quark decay, while peaking at higher values for Gbb and Gtt events.
Another powerful variable is the total jet mass variable, defined as:
MJΣ =X
i≤4
JHEP06(2018)107
wheremJ,iis the mass of the large-radius re-clustered jetiin the event. The decay products
of a hadronically decaying boosted top quark can be reconstructed in a single large-radius re-clustered jet, resulting in a jet with a high mass. This variable typically has larger values for Gtt events than for background events. This is because Gtt events contain as many as four hadronically decaying top quarks while the background is dominated by t¯t events with one or two semileptonic top quark decays.
The requirement of a selected lepton, with the additional requirements on jets, Emiss T and event variables described above, makes the multijet background negligible for the ≥ 1-lepton signal regions. For the 0-1-lepton signal regions, the minimum azimuthal angle ∆φ4jmin
between~pmiss
T and the pT of the four leading small-R jets in the event, defined as: ∆φ4jmin= mini≤4
|φjeti−φp~missT |
,
is required to be greater than 0.4. This requirement supresses the multijet background, which can produce events with large ETmiss if containing poorly measured jets or neutrinos emitted close to the axis of a jet. A similar variable, denoted ∆φj1, is also used in the
Gbb signal regions targeting small mass differences between the gluino and the neutralino, allowing the identification of events containing a high-pT jet coming from initial-state radiation (ISR) and recoiling against the gluino pair. It is defined as the absolute value of the azimuthal angle separating thepT of the leading jet and~pmissT , and is expected to have larger values for the targeted signal than for the background.
6.2 Modelling of the data
Preselection criteria in the 0-lepton and 1-lepton channels require Emiss
T > 200 GeV, in addition to the Emiss
T trigger requirement, and at least four jets of which at least two must beb-tagged. The 0-lepton (1-lepton) channel requires the event to contain no (at least one) selected lepton.
In this analysis, correction factors need to be extracted to account for shape discrepan-cies in the meff spectrum between the data and the expected background for the 1-lepton preselection sample. These factors are defined as the ratio of the number of observed events to the predicted number of background events in a given meff bin, in a signal-depleted re-gion. This region is defined by applying the 1-lepton preselection criteria and requiring exactly two b-tagged jets and mbT-jets,min < 140 GeV. This kinematic reweighting leads to correction factors ranging from 0.7 to 1.1. They are applied to the background prediction and the full size of the correction is taken as an uncertainty for both the background and signal events.
Figures 3 and 4 show the multiplicity of selected jets and b-tagged jets, the distribu-tions of Emiss
T ,meff, and MJΣ for events passing the 0-lepton or the 1-lepton preselection,
respectively. Figure 3 (4) also displays the distribution of mbT-jets,min (mT) in the 0-lepton (1-lepton) channel. The correction described above is applied in the 1-lepton channel. The uncertainty bands include the statistical and experimental systematic uncertainties, as described in section7, but not the theoretical uncertainties in the background modelling. The data and the predicted background are found to agree reasonably well at the preselection level after the kinematic reweighting described above. A discrepancy between
JHEP06(2018)107
data and prediction is observed for the number of b-tagged jets, but it has a negligible impact on the background estimate after the renormalisation of the simulation in dedicated control regions with the sameb-tagged jets requirements as the signal regions, as described in sections 6.4 and 6.5. Example signal models with enhanced cross-sections are overlaid for comparison.
6.3 Analysis strategy and background treatment
In order to enhance the sensitivity to the various signal benchmarks described in section2, multiple signal regions (SRs) are defined. The main background in all these regions is the production of a t¯t pair in association with heavy- and light-flavour jets. A normalisation factor for this background is extracted for each individual SR from a data control region (CR) that has comparable background composition and kinematics. This is ensured by keeping the kinematic requirements similar in the two regions. The CRs and SRs are defined to be mutually exclusive. Signal contributions in the CRs are suppressed by inverting or relaxing some requirements on the kinematic variables (e.g. mT or mbT-jets,min), leading to a signal contamination in the CRs of 6% at most. The t¯t normalisation is cross-checked in validation regions (VRs) that share similar background composition, i.e. jet and lepton flavours, with the SR. The signal contamination in the VRs is found to be lower than 30% for benchmark signal mass points above the already excluded mass range. Thet¯tpurity is superior to 73% and 53% in the CRs and VRs, respectively.
The non-tt¯backgrounds mainly consist of single-top, W+jets, Z+jets, tt¯+W/Z/h,
t¯tt¯tand diboson events. Their normalisation is taken from the simulation normalised using the best available theory prediction. The multijet background is found to be very small or negligible in all regions. It is estimated using a procedure described in ref. [63], in which the jet response is determined from simulated dijet events. This response function is then used to smear the jet response in low-Emiss
T events. The jet response is cross-checked with data where theEmiss
T can be unambiguously attributed to the mismeasurement of one of the jets. Two analysis strategies are followed, and different SR sets are defined for each:
• A cut-and-count analysis, using partially overlapping single-bin SRs, optimised to
maximise the expected discovery power for benchmark signal models, and allowing for reinterpretation of the results. The SRs are defined to probe the existence of a signal or to assess model-independent upper limits on the number of signal events.
• Amulti-binanalysis, using a set of non-overlapping SRs and CRs that are combined
to strengthen the exclusion limits on the targeted signal benchmarks. This set of regions is used to assess model-dependent interpretations of the various signal models.
6.4 Cut-and-count analysis
JHEP06(2018)107
4 5 6 7 8 9 10
Number of jets
10 2 10 3 10 4 10 5 10 6 10 Events ATLAS -1
=13 TeV, 36.1 fb s
0L Preselection
) = 1900, 1 (x 50) 0 1 χ ∼ ), m( g ~ Gtt: m(
) = 1900, 1400 (x 50) 0 1 χ ∼ ), m( g ~ Gbb: m( Data Total background t t Single top + X t t Z+jets W+jets Diboson Multijet
4 5 6 7 8 9 10
Number of jets 0
1 2
Data / SM
2 3 4 5 6
Number of b-jets
1 10 2 10 3 10 4 10 5 10 6 10 7 10 8 10 Events ATLAS -1
=13 TeV, 36.1 fb s
0L Preselection
) = 1900, 1 (x 50) 0 1 χ ∼ ), m( g ~ Gtt: m(
) = 1900, 1400 (x 50) 0 1 χ ∼ ), m( g ~ Gbb: m( Data Total background t t Single top + X t t Z+jets W+jets Diboson Multijet
2 3 4 5 6
Number of b-jets 0
1 2
Data / SM
200 300 400 500 600 700 800 900 1000
[GeV] miss T E 1 10 2 10 3 10 4 10 5 10 6 10 7 10
Events / 50 GeV
ATLAS
-1
=13 TeV, 36.1 fb s
0L Preselection
) = 1900, 1 (x 50)
0 1 χ ∼ ), m( g ~ Gtt: m(
) = 1900, 1400 (x 50)
0 1 χ ∼ ), m( g ~ Gbb: m( Data Total background t t Single top + X t t Z+jets W+jets Diboson Multijet
200 300 400 500 600 700 800 900 1000 [GeV] miss T E 1 2
Data / SM
500 1000 1500 2000 2500 3000 [GeV] eff m 10 2 10 3 10 4 10 5 10 6 10
Events / 200 GeV
ATLAS -1 =13 TeV, 36.1 fb s
0L Preselection
) = 1900, 1 (x 50)
0 1 χ ∼ ), m( g ~ Gtt: m(
) = 1900, 1400 (x 50)
0 1 χ ∼ ), m( g ~ Gbb: m( Data Total background t t Single top + X t t Z+jets W+jets Diboson Multijet
500 1000 1500 2000 2500 3000
[GeV] eff m 0 1 2
Data / SM
0 100 200 300 400 500 600
[GeV] Σ J M 1 10 2 10 3 10 4 10 5 10 6 10 7 10
Events / 50 GeV
ATLAS
-1 =13 TeV, 36.1 fb s
0L Preselection
) = 1900, 1 (x 50)
0 1 χ ∼ ), m( g ~ Gtt: m(
) = 1900, 1400 (x 50)
0 1 χ ∼ ), m( g ~ Gbb: m( Data Total background t t Single top + X t t Z+jets W+jets Diboson Multijet
0 100 200 300 400 500 600
[GeV] Σ J M 0 1 2
Data / SM
0 100 200 300 400 500 600 700 800
[GeV] b-jets T,min m 1 10 2 10 3 10 4 10 5 10 6 10 7 10
Events / 50 GeV
ATLAS
-1
=13 TeV, 36.1 fb s
0L Preselection
) = 1900, 1 (x 50)
0 1 χ ∼ ), m( g ~ Gtt: m(
) = 1900, 1400 (x 50)
0 1 χ ∼ ), m( g ~ Gbb: m( Data Total background t t Single top + X t t Z+jets W+jets Diboson Multijet
0 100 200 300 400 500 600 700 800 [GeV] b-jets T,min m 0 1 2
[image:15.595.85.511.89.601.2]Data / SM
Figure 3. Distributions of (top-left) the number of selected jets (Njet), (top-right) the number of
selectedb-tagged jets, (centre-left)Emiss
T , (centre-right)meff, (bottom-left)MJΣand (bottom-right) mbT-jets,min for events passing the 0-lepton preselection criteria. The statistical and experimental sys-tematic uncertainties (as defined in section 7) are included in the uncertainty band. The last bin includes overflow events. The lower part of each figure shows the ratio of data to the background prediction. All backgrounds (includingt¯t) are normalised using the best available theoretical calcu-lation described in section4. The background categoryt¯t+X includesttW/Z¯ ,t¯thandttt¯t¯events. Example signal models with cross-sections enhanced by a factor of 50 are overlaid for comparison.
JHEP06(2018)107
Number of jets
4 5 6 7 8 9 10
Events 10 2 10 3 10 4 10 5 10 6
10 ATLAS -1
=13 TeV, 36.1 fb s
1L Preselection
) = 1900, 1 (x 50) 0 1 χ ∼ ), m( g ~ Gtt: m(
) = 1800, 1000 (x 50) 0 1 χ ∼ ), m( g ~ Gtb: m( Data Total background t t Single top + X t t Z+jets W+jets Diboson
Number of jets
4 5 6 7 8 9 10
Data / SM
0 1 2
Number of b-jets
2 3 4 5 6
Events 1 10 2 10 3 10 4 10 5 10 6 10 7 10 8 10 ATLAS -1
=13 TeV, 36.1 fb s
1L Preselection
) = 1900, 1 (x 50) 0 1 χ ∼ ), m( g ~ Gtt: m(
) = 1800, 1000 (x 50) 0 1 χ ∼ ), m( g ~ Gtb: m( Data Total background t t Single top + X t t Z+jets W+jets Diboson
Number of b-jets
2 3 4 5 6
Data / SM
0 1 2 [GeV] miss T E
200 300 400 500 600 700 800 900 1000
Events / 50 GeV
1 10 2 10 3 10 4 10 5 10 6 10 7 10 ATLAS -1 =13 TeV, 36.1 fb s
1L Preselection
) = 1900, 1 (x 50) 0 1 χ ∼ ), m( g ~ Gtt: m(
) = 1800, 1000 (x 50) 0 1 χ ∼ ), m( g ~ Gtb: m( Data Total background t t Single top + X t t Z+jets W+jets Diboson [GeV] miss T E
200 300 400 500 600 700 800 900 1000
Data / SM
1 2
[GeV] eff m
500 1000 1500 2000 2500 3000
Events / 200 GeV
10 2 10 3 10 4 10 5 10 6
10 ATLAS -1
=13 TeV, 36.1 fb s
1L Preselection
) = 1900, 1 (x 50) 0 1 χ ∼ ), m( g ~ Gtt: m(
) = 1800, 1000 (x 50) 0 1 χ ∼ ), m( g ~ Gtb: m( Data Total background t t Single top + X t t Z+jets W+jets Diboson [GeV] eff m 500 1000 1500 2000 2500 3000
Data / SM
0 1 2 [GeV] Σ J M
0 100 200 300 400 500 600
Events / 50 GeV
1 10 2 10 3 10 4 10 5 10 6 10 7 10 ATLAS -1 =13 TeV, 36.1 fb s
1L Preselection
) = 1900, 1 (x 50) 0 1 χ ∼ ), m( g ~ Gtt: m(
) = 1800, 1000 (x 50) 0 1 χ ∼ ), m( g ~ Gtb: m( Data Total background t t Single top + X t t Z+jets W+jets Diboson [GeV] Σ J M
0 100 200 300 400 500 600
Data / SM
0 1 2 [GeV] T m
0 100 200 300 400 500 600 700 800
Events / 50 GeV
1 10 2 10 3 10 4 10 5 10 6 10 7 10 ATLAS -1 =13 TeV, 36.1 fb s
1L Preselection
) = 1900, 1 (x 50) 0 1 χ ∼ ), m( g ~ Gtt: m(
) = 1800, 1000 (x 50) 0 1 χ ∼ ), m( g ~ Gtb: m( Data Total background t t Single top + X t t Z+jets W+jets Diboson [GeV] T m
0 100 200 300 400 500 600 700 800
Data / SM
[image:16.595.77.512.92.594.2]0 1 2
Figure 4. Distributions of (top-left) the number of selected jets (Njet), (top-right) the number of
selectedb-tagged jets, (centre-left)Emiss
T , (centre-right)meff, (bottom-left)MJΣand (bottom-right) mTfor events passing the 1-lepton preselection criteria, after applying the kinematic reweighting to
themeff distribution described in the text. The statistical and experimental systematic uncertainties
JHEP06(2018)107
objects in the final state. Conversely, regions C (for “compressed”) primarily focus on sig-nals for which the gluino decay products are softer due to the small ∆m(∆m. 300 GeV). Regions M (for “moderate”) target intermediate values of ∆m. SRs targeting the Gtt model in the 1- and 0-lepton channels are presented in table 2.
In the 1-lepton channel, these regions differ mainly in their kinematic selections thresh-olds: meff,ETmiss andMJΣselections are relaxed when going from region B to C to improve
the acceptance for softer signals. The resulting background increase is compensated for by tightening the requirements on the number of (b-tagged) jets or mbT-jets,min. CRs constrain-ing the t¯t background are defined in the low-mT region to remove overlaps with the SRs. The requirements on mbT-jets,min are removed, and the selections on kinematic variables are relaxed to ensure at least about 10 events in each CR. The requirement of an exclusive jet multiplicity permits the definition of VRs kinematically close to the SRs and mutually exclusive to both the CRs and SRs. VR-mT validates the background prediction in the high-mT region. It is kept mutually exclusive with the SR by an inverted selection onMJΣ or mbT-jets,min. VR-mTb-jets,min checks the background prediction in the high-mbT-jets,min regime, with an upper bound onmT to keep the region mutually exclusive with the corresponding SR. The other kinematic requirements are kept as close as possible to those of the SRs to ensure that the event kinematics are similar, and allow sufficiently large yields.
The signal regions of the 0-lepton channel follow a similar strategy to the 1-lepton channel. Background composition studies performed on simulated event samples show that semileptonic t¯t events, for which the lepton is outside the acceptance or is a hadronically decaying τ-lepton, dominate in the SRs. Thus, CRs to normalise the t¯t+jets background make use of the 1-lepton channel, requiring the presence of exactly one signal lepton. An inverted selection on mT is applied to remove overlaps with the 1-lepton SRs. The background prediction is validated in a 0-lepton region, inverting the MΣ
J selection to
remove any overlap with the SRs.
Regions targeting the Gbb model are presented in table3. The region definition follows the same pattern as for Gtt-0L regions, in particular for regions B, M and C. For very small values of ∆m, the Gbb signal does not lead to a significant amount of Emiss
T , except if a hard ISR jet recoils against the gluino pair. Such events are targeted by region VC (for “very compressed”) that identifies an ISR-jet candidate as a non-b-tagged high-pT leading jet (j1), with a large azimuthal separation ∆φj1 with respect to p~Tmiss. Similarly, the normalisation factor of the t¯t background is extracted from a 1-lepton CR, to which an inverted selection onmT is applied to remove the overlaps with Gtt 1-lepton SRs and the corresponding signal contamination. The 0-lepton VRs are constructed in the 0-lepton channel with selections very close to the SR ones. They are mutually exclusive due to an invertedEmiss
T selection in the VR.
JHEP06(2018)107
Gtt 1-lepton
Criteria common to all regions: ≥1 signal lepton,pTjet>30 GeV,Nb-jets≥3
Targeted kinematics Type Njet mT mbT-jets,min E miss
T mincleff MJΣ
Region B (Boosted, Large
∆m)
SR ≥5 >150 >120 >500 >2200 >200
CR = 5 <150 − >300 >1700 >150
VR-mT ≥5 >150 − >300 >1600 <200
VR-mb-jets
T,min >5 <150 >120 >400 >1400 >200
Region M (Moderate ∆m)
SR ≥6 >150 >160 >450 >1800 >200
CR = 6 <150 − >400 >1500 >100
VR-mT ≥6 >200 − >250 >1200 <100
VR-mbT-jets,min >6 <150 >140 >350 >1200 >150
Region C (Compressed, small
∆m)
SR ≥7 >150 >160 >350 >1000 −
CR = 7 <150 − >350 >1000 −
VR-mT ≥7 >150 <160 >300 >1000 −
VR-mbT-jets,min >7 <150 >160 >300 >1000 −
Gtt 0-lepton
Criteria common to all regions: pTjet>30 GeV
Targeted kinematics Type Nlepton Nb-jets Njet ∆φ4jmin mT mbT-jets,min ETmiss mincleff MJΣ
Region B (Boosted, Large
∆m)
SR = 0 ≥3 ≥7 >0.4 − >60 >350 >2600 >300
CR = 1 ≥3 ≥6 − <150 − >275 >1800 >300
VR = 0 ≥3 ≥6 >0.4 − − >250 >2000 <300
Region M (Moderate ∆m)
SR = 0 ≥3 ≥7 >0.4 − >120 >500 >1800 >200
CR = 1 ≥3 ≥6 − <150 − >400 >1700 >200
VR = 0 ≥3 ≥6 >0.4 − − >450 >1400 <200
Region C (Compressed, moderate ∆m)
SR = 0 ≥4 ≥8 >0.4 − >120 >250 >1000 >100
CR = 1 ≥4 ≥7 − <150 − >250 >1000 >100
[image:18.595.102.509.149.629.2]VR = 0 ≥4 ≥7 >0.4 − − >250 >1000 <100
Table 2. Definitions of the Gtt SRs, CRs and VRs of the cut-and-count analysis. All kinematic variables are expressed in GeV except ∆φ4jmin, which is in radians. The jet pT requirement is also
JHEP06(2018)107
Gbb
Criteria common to all regions: Njet ≥4,pTjet >30 GeV
Targeted kinematics Type Nlepton Nb-jets ∆φ4jmin mT mbT-jets,min ETmiss meff Others
Region B (Boosted, Large
∆m)
SR = 0 ≥3 >0.4 − − >400 >2800 −
CR = 1 ≥3 − <150 − >400 >2500 −
VR = 0 ≥3 >0.4 − − >350 1900–2800 −
Region M (Moderate ∆m)
SR = 0 ≥4 >0.4 − >90 >450 >1600 −
CR = 1 ≥4 − <150 − >300 >1600 −
VR = 0 ≥4 >0.4 − >100 250–450 1600–1900 −
Region C (Compressed,
small ∆m)
SR = 0 ≥4 >0.4 − >155 >450 − −
CR = 1 ≥4 − <150 − >375 − −
VR = 0 ≥4 >0.4 − >125 350–450 − −
Region VC (Very Compressed, very
small ∆m)
SR = 0 ≥3 >0.4 − >100 >600 −
pj1
T >400, j16=b,
∆φj1 >2.5
CR = 1 ≥3 − <150 − >600 −
[image:19.595.157.725.114.429.2]VR = 0 ≥3 >0.4 − >100 225–600 −
Table 3. Definitions of the Gbb SRs, CRs and VRs of the cut-and-count analysis. All kinematic variables are expressed in GeV except ∆φ4jmin,
which is in radians. The jetpTrequirement is applied to the four leading jets, a subset of which areb-tagged jets. The j16=brequirement specifies
that the leading jet is notb-tagged.
–
17
JHEP06(2018)107
effLow m
eff
m Intermediate
eff
High m 6
≤
jet
N ≤ 4
8 ≤
jet
N ≤ 7
9 ≥
jet
N
0L-LL 0L-IL
0L-HL
0L-LI 0L-II 0L-HI
0L-LH 0L-HH
0L-ISR
(a)
eff
Low m
eff
m Intermediate
eff
High m 7
≤
jet
N ≤ 6
8 ≥
jet
N
1L-IL 1L-HL
1L-II 1L-HI
1L-HH
[image:20.595.85.508.92.259.2](b)
Figure 5. Scheme of the multi-bin analysis for the (a) 0-lepton and (b) 1-lepton regions. The 0L-ISR region is represented with the broad red dashed line in(a).
6.5 Multi-bin analysis
Figures3and4show that a good separation between signal and background can be achieved with various kinematic variables. The distribution of Njet and meff for different signal benchmarks and ∆m values is used to build a two-dimensional slicing of the phase space in a set of non-overlapping SRs, CRs and VRs that can be statistically combined. The slicing scheme is presented in figure 5. The SRs are named in the form SR-YL-Z1Z2, where Y indicates the number of leptons, Z1 labels the jet multiplicity bin and Z2 labels the meff bin. For Z1 and Z2, the letters “H” stands for “high”, “I” for “intermediate” and “L” for “low”. In the 0-lepton channel, there is also a 0L-ISR region that is a subset of the IL, LL, II and LI regions, and kept mutually exclusive with them as detailed below.
The low-Njet region probes especially Gbb-like models, for which the number of hard jets is lower than in decay topologies containing top quarks. This category of events is thus only considered in the 0-lepton channel. Gtt events are mostly expected in the high-Njet bin. The intermediate jet multiplicity bin is built to be sensitive to decay topologies with a number of top quarks intermediate between Gbb and Gtt, but also to Gbb (with additional jets originating from radiation) and to Gtt (when some jets fall outside the acceptance). The meff bins are chosen to provide sensitivity to various kinematic regimes: the low-meff regions are essentially sensitive to soft signals (low ∆m), while the high-meff regions are designed to select highly boosted events.
For eachNjet-meff region presented in figure5, the selection was optimised over all the other variables to maximise the exclusion power for the Gbb and Gtt models. For each
meff bin, a targeted range of ∆m was used in the optimisation procedure.
JHEP06(2018)107
with the 0L-ISR regions. Corresponding 0-lepton and 1-lepton SRs share a single CR, hosted in the 1-lepton channel, after the application of an inverted mT selection to remove the overlap with the 1-lepton SRs. The other kinematic requirements are kept close to the ones of the SR. One VR is defined for each SR in the corresponding lepton channel. Full independence between the signal and VRs is guaranteed byEmiss
T andm
b-jets
T,minrequirements. The low-Njet regions are presented in table 6. Targeting primarily the Gbb model, the transverse momentum of the fourth jet is required to be larger than 90 GeV in all SRs. In the intermediate and low meff regions, the leading jet is required to be b-tagged or the value of ∆φj1 to be lower than 2.9 in order to be mutually exclusive with the
0L-ISR regions. The t¯t background dominates in all regions, and is normalised in dedicated 1-lepton regions, defined with a low mT requirement, as done for the regions of the cut-and-count analysis. VRs are constructed in the 0-lepton channel, closely reproducing the background composition and kinematics of the SR events.
A dedicated set of regions is designed to target very compressed Gbb scenarios in which a hard ISR jet recoils against the gluino pair. The definition of these regions is presented in table 6.
High-Njet regions
Criteria common to all regions: Nb-jets≥3, pTjet >30 GeV
Targeted kinematics Type Nlepton ∆φ4jmin mT Njet mbT-jets,min MΣ
J ETmiss meff
High-meff
(HH) (Large ∆m)
SR-0L = 0 >0.4 − ≥7 >100 >200 >400 >2500
SR-1L ≥1 − >150 ≥6 >120 >200 >500 >2300
CR ≥1 − <150 ≥6 >60 >150 >300 >2100
VR-0L = 0 >0.4 − ≥7 <100 ifEmiss
T >300 − <300 ifm
b-jets
T,min>100 >2100
VR-1L ≥1 − >150 ≥6 <140 ifmeff >2300 − <500 >2100
Intermediate-meff
(HI) (Intermediate
∆m)
SR-0L = 0 >0.4 − ≥9 >140 >150 >300 [1800,2500]
SR-1L ≥1 − >150 ≥8 >140 >150 >300 [1800,2300]
CR ≥1 − <150 ≥8 >60 >150 >200 [1700,2100]
VR-0L = 0 >0.4 − ≥9 <140 ifEmiss
T >300 − <300 ifm
b-jets
T,min>140 [1650,2100]
VR-1L ≥1 − >150 ≥8 <140 ifEmiss
T >300 − <300 ifm
b-jets
T,min>140 [1600,2100]
Low-meff
(HL) (Small ∆m)
SR-0L = 0 >0.4 − ≥9 >140 − >300 [900,1800]
SR-1L ≥1 − >150 ≥8 >140 − >300 [900,1800]
CR ≥1 − <150 ≥8 >130 − >250 [900,1700]
VR-0L = 0 >0.4 − ≥9 <140 − >300 [900,1650]
[image:22.595.121.756.120.476.2]VR-1L ≥1 − >150 ≥8 <140 − >225 [900,1650]
Table 4. Definition of the high-Njet SRs, CRs and VRs of the multi-bin analysis. All kinematic variables are expressed in GeV except ∆φ
4j
min,
–
20
JHEP06(2018)107
Intermediate-Njet regions
Criteria common to all regions: Nb-jets≥3, pTjet >30 GeV
Targeted kinematics Type Nlepton ∆φ4jmin mT Njet j1 =b or ∆φj1 ≤2.9 m
b-jets
T,min MJΣ ETmiss meff
Intermediate-meff
(II) (Intermediate
∆m)
SR-0L = 0 >0.4 − [7,8] 3 >140 >150 >300 [1600,2500]
SR-1L ≥1 − >150 [6,7] − >140 >150 >300 [1600,2300]
CR ≥1 − <150 [6,7] 3 >110 >150 >200 [1600,2100]
VR-0L = 0 >0.4 − [7,8] 3 <140 − >300 [1450,2000]
VR-1L ≥1 − >150 [6,7] − <140 − >225 [1450,2000]
Low-meff
(IL) (Low ∆m)
SR-0L = 0 >0.4 − [7,8] 3 >140 − >300 [800,1600]
SR-1L ≥1 − >150 [6,7] − >140 − >300 [800,1600]
CR ≥1 − <150 [6,7] 3 >130 − >300 [800,1600]
VR-0L = 0 >0.4 − [7,8] 3 <140 − >300 [800,1450]
[image:23.595.137.749.161.426.2]VR-1L ≥1 − >150 [6,7] − <140 − >300 [800,1450]
Table 5. Definition of the intermediate-Njet SRs, CRs and VRs of the multi-bin analysis. All kinematic variables are expressed in GeV except
∆φ4jmin, which is in radians. The j1=brequirement specifies that the leading jet is b-tagged.
–
21
Low-Njet regions
Criteria common to all regions: Nb-jets≥3,pTjet>30 GeV
Targeted kinematics Type Nlepton ∆φ
4j
min mT Njet j1=bor ∆φj1≤2.9 p
j4
T m
b-jets
T,min E
miss
T meff
High-meff
(LH)
(Large ∆m)
SR = 0 >0.4 − [4,6] − >90 − >300 >2400
CR ≥1 − <150 [4,5] − - − >200 >2100
VR = 0 >0.4 − [4,6] − >90 ifEmiss
T <300 − >200 [2000,2400]
Intermediate-meff
(LI)
(Intermediate ∆m)
SR = 0 >0.4 − [4,6] 3 >90 >140 >350 [1400,2400]
CR ≥1 − <150 [4,5] 3 >70 − >300 [1400,2000]
VR = 0 >0.4 − [4,6] 3 >90 <140 >300 [1250,1800]
Low-meff
(LL)
(Low ∆m)
SR = 0 >0.4 − [4,6] 3 >90 >140 >350 [800,1400]
CR ≥1 − <150 [4,5] 3 >70 − >300 [800,1400]
VR = 0 >0.4 − [4,6] 3 >90 <140 >300 [800,1250]
ISR regions
Criteria common to all regions: Nb-jets≥3, ∆φj1>2.9,pTj1>400 GeV,pTjet>30 GeV, j16=b
Type Nlepton ∆φ4jmin mT Njet mbT-jets,min E
miss
T meff
SR = 0 >0.4 − [4,8] >100 >600 <2200
CR ≥1 − <150 [4,7] − >400 <2000
[image:24.595.123.751.101.463.2]VR = 0 >0.4 − [4,8] >100 >250 <2000
Table 6. Definition of the low-Njet and ISR SRs, CRs and VRs of the multi-bin analysis. All kinematic variables are expressed in GeV except
∆φ4jmin, which is in radians. The j1=b(j16=b) requirement specifies that the leading jet is (not) b-tagged.
–
22
JHEP06(2018)107
7 Systematic uncertainties
Figures6a and6b summarise the relative systematic uncertainties in the background esti-mate for the cut-and-count and multi-bin analyses, respectively. These uncertainties arise from the extrapolation of thet¯tnormalisation obtained in the CRs to the SRs as well as from the yields of the minor backgrounds in the SRs, which are predicted by the simulation. The total systematic uncertainties range from approximately 20% to 80% in the various SRs.
The detector-related systematic uncertainties affect both the background estimate and the signal yield. The largest sources in this analysis relate to the jet energy scale, jet energy resolution (JER) and the b-tagging efficiencies and mistagging rates. The JES uncertainties for the small-R jets are derived from √s = 13 TeV data and simulations while the JER uncertainties are extrapolated from 8 TeV data using MC simulations [89]. These uncertainties are also propagated to the re-clustered large-R jets, which use them as inputs. The jet mass scale and resolution uncertainties have a negligible impact on the re-clustered jet mass. The impact of the JES uncertainties on the expected background yields is between 4% and 35%, while JER uncertainties affect the background yields by approximately 0–26% in the various regions. Uncertainties in the measured b-tagging efficiencies and mistagging rates are the subleading sources of experimental uncertainty.
The impact of these uncertainties on the expected background yields is 3–24% de-pending on the considered region. The uncertainties associated with lepton reconstruction and energy measurements have a negligible impact on the final results. All lepton and jet measurement uncertainties are propagated to the calculation of Emiss
T , and additional uncertainties are included in the scale and resolution of the soft term. The overall impact of the Emiss
T soft-term uncertainties is also small.
Since the normalisation of the tt¯background is fit to data in the CRs, uncertainties in the modelling of this background only affect the extrapolation from the CRs to the SRs and VRs. Hadronisation and parton showering model uncertainties are estimated using a sample generated with Powheg and showered by Herwig++ v2.7.1 with the UEEE5
underlying-event tune. Systematic uncertainties in the modelling of initial- and final-state radiation are explored with Powheg samples showered with two alternative settings of
Pythia v6.428. The first of these uses the PERUGIA2012radHi tune [50] and has the
renormalisation and factorisation scales set to twice the nominal value, resulting in more radiation in the final state. In addition, it hashdampset to 2mtop. The second sample, using the PERUGIA2012radLo tune, hashdamp=mtop and the renormalisation and factorisation scales are set to half of their nominal values, resulting in less radiation in the event. In each case, the uncertainty is taken as the change in the expected yield of t¯t background with respect to the nominal sample. The uncertainty due to the choice of event generator is estimated by comparing the expected yields obtained using a tt¯sample generated with
MadGraph5 aMC@NLO and one that is generated withPowheg. Both of these samples
are showered with Herwig++ v2.7.1. The total theoretical uncertainty in the inclusive
t¯t background is taken as the sum in quadrature of these individual components. An additional uncertainty is assigned to the fraction oft¯tevents produced in association with additional heavy-flavour jets (i.e.t¯t+≥1bandt¯t+≥1c), a process which suffers from large
JHEP06(2018)107
SR-Gtt-0L-BSR-Gtt-0L-MSR-Gtt-0L-CSR-Gtt-1L-BSR-Gtt-1L-MSR-Gtt-1L-CSR-Gbb-B SR-Gbb-MSR-Gbb-CSR-Gbb-VC
Relative uncertainty
0 0.1 0.2 0.3 0.4 0.5 0.6 0.7 0.8 0.9 1
Total uncertainty Theoretical uncertainty Experimental uncertainty MC statistical uncertainty CR statistical uncertainty
Cut-and-count analysis
-1
=13 TeV, 36.1 fb s
ATLAS
(a)
SR-1L-HHSR-1L-HISR-1L-HLSR-1L-IISR-1L-ILSR-0L-HHSR-0L-HISR-0L-HLSR-0L-IISR-0L-ILSR-0L-LHSR-0L-LISR-0L-LLSR-0L-ISR
Relative uncertainty
0 0.1 0.2 0.3 0.4 0.5 0.6 0.7 0.8 0.9 1
Total uncertainty Theoretical uncertainty Experimental uncertainty MC statistical uncertainty CR statistical uncertainty Multi-bin analysis
-1 =13 TeV, 36.1 fb s
ATLAS
[image:26.595.116.476.93.648.2](b)
JHEP06(2018)107
theoretical uncertainties. Simulation studies show that the heavy-flavour fractions in each set of SR, CR and VR, which have almost identicalb-tagged jets requirements, are similar. Therefore, the theoretical uncertainties in this fraction affect these regions in a similar way, and thus largely cancel out in the semi-data-driven tt¯normalisation based on the observed CR yields. The residual uncertainty in thet¯tprediction is taken as the difference between the nominal t¯t prediction and the one obtained after varying the cross-section of
t¯t events with additional heavy-flavour jets by 30%, in accordance with the results of the ATLAS measurement of this cross-section at √s= 8 TeV [90]. This component typically makes a small contribution (0–8%) to the total impact of the t¯t modelling uncertainties on the background yields, which ranges between 5% and 76% for the various regions. The statistical uncertainty of the CRs used to extract the t¯t normalisation factors, which is included in the systematic uncertainties, ranges from 10% to 30% depending on the SR.
Modelling uncertainties affecting the single-top process arise especially from the in-terference between the t¯tand W tprocesses. This uncertainty is estimated using inclusive
W W bb events, generated using MadGraph5 aMC@NLO, which are compared with the
sum of t¯tand W t processes. Furthermore, as in the t¯tmodelling uncertainties, variations
of Pythiav6.428 settings increasing or decreasing the amount of radiation are also used.
An additional 5% uncertainty is included in the cross-section of single-top processes [91]. Overall, the modelling uncertainties affecting the single-top process lead to changes of ap-proximately 0–11% in the total yields in the various regions. Uncertainties in theW/Z+jets backgrounds are estimated by varying independently the scales for factorisation, renormal-isation and resummation by factors of 0.5 and 2. The scale used for the matching between jets originating from the matrix element and the parton shower is also varied. The resulting uncertainties in the total yield range from approximately 0 to 50% in the various regions. A 50% normalisation uncertainty is assigned tot¯t+W/Z/h,ttt¯¯tand diboson backgrounds and are found to have no significant impact on the sensitivity of this analysis. Uncertainties arising from variations of the parton distribution functions were found to affect background yields by less than 2%, and therefore these uncertainties are neglected here. Uncertainties due to the limited number of events in the MC background samples are included if above 5%. They reach approximately 20% in regions targeting large mass-splitting.
The uncertainties in the cross-sections of signal processes are determined from an envelope of different cross-section predictions, as described in section 4. A systematic uncertainty is also assigned to the kinematic correction described in section 6. The total size of the correction is used as an uncertainty, and is applied to all simulated event samples for the 1-lepton channel.
8 Results
The expected SM background is determined separately in each SR with a profile likelihood fit [92] implemented in the HistFitter framework [93], referred to as a background-only fit. The fit uses as a constraint the observed event yield in the associated CR to adjust the tt¯normalisation, assuming that no signal contributes to this yield, and applies that normalisation factor to the number of t¯t events predicted by simulation in the SR. The