Int. J. Electrochem. Sci., 7 (2012) 12656 - 12667
International Journal of
ELECTROCHEMICAL
SCIENCE
www.electrochemsci.org
A New Optically-Induced Dielectrophoretic (ODEP)
Force-Based Scheme for Effective Cell Sorting
Song-Bin Huang1, Jian Chen2, Junbo Wang2,Chih-Liang Yang1, Min-Hsien Wu1,* 1
Institute of Biochemical and Biomedical Engineering, Chang Gung University, Taoyuan, Taiwan 2
State Key Laboratory of Transducer Technology, Chinese Academy of Sciences, Beijing, China *
E-mail: [email protected]
Received: 25 October 2012 / Accepted: 19 November 2012 / Published: 1 December 2012
This manuscript presents a new optically-induced dielectrophoretic (ODEP)-based operation methodology that is capable of sorting or separating cells based on their size differences. In this study, a moving light bar was generated in a pre-defined speed to separate different cell types, which were influenced by different magnitudes of ODEP forces and therefore have different moving velocities. The operation conditions of ODEP forces for the manipulation of prostate cancer cells (PC-3) and leukocytes were first characterized. Under the following operation conditions (AC voltage: 5V, 100 kHz; gap of working chamber: 50 μm; bar width of light image: 40 μm), the maximum velocities of the moving light bar that can effectively manipulate PC-3 cells and leukocytes were quantified to be 150.8±9.3, and 67.3±9.8 µm s-1
, respectively. Furthermore, this technique was used to sort PC-3 cells from a leukocyte background with high cell separation efficiency (82-89%). Overall, this study has presented a new ODEP-based operation scheme that is capable of sorting or separating cells in a simple, efficient, and precise manner. All these characteristic features are found particularly valuable for the biological researches in which the isolation of highly pure cell species is important.
Keywords: Microfluidics, Optically-induced dielectrophoretic (ODEP) Force, Cell sorting, Cell separation
1. INTRODUCTION
(ODEP) force [12]-based schemes, the manipulation of such micro-scale substance can be easily realized. Among them, the incorporation of DEP force-based technique into microfluidic systems has been generally recognized as an effective method for cell manipulation [9-11]. When microparticles with dielectric properties are subjected to an applied electric field, charges can be electrically polarized on the particle surface. The interaction between induced charges on the particles and the applied electric field can generate so-called dielectrophoretic (DEP) force [13]. By fine tuning the applied electric field, therefore, the microparticles can be manipulated in a controllable manner.
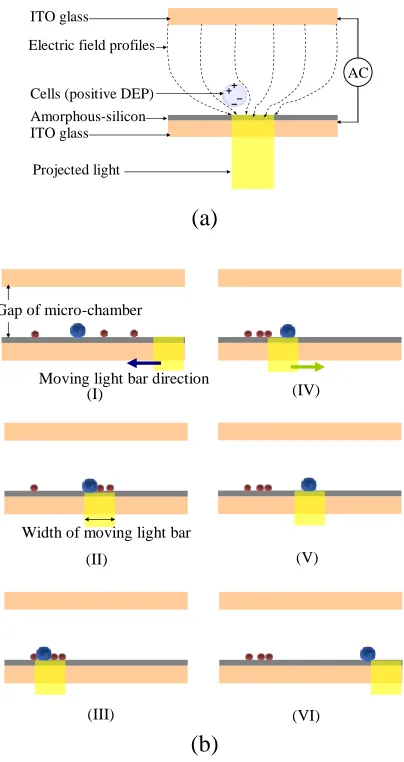
Nevertheless, DEP force-based cell manipulation commonly requires a technically-demanding and time-consuming fabrication process to create a unique metal electrode layout that is specific to the application. More recently, the optically induced dielectrophoretic (ODEP) schemes, in which light images are utilized as a virtual electrodes to induce DEP force, have been actively proposed to manipulate biological cells [12, 14-21]. The working principle of ODEP force-based cell manipulation is schematically illustrated in Fig. 1 (a). Briefly, an ODEP system normally consists of a top indium-tin-oxide (ITO) glass substrate, and a bottom ITO glass substrate with a photoconductive layer (e.g. amorphous silicon [12, 14, 15, 17]) coated. Firstly, an alternating current (AC) voltage is applied between the top and bottom ITO layers to produce a uniform electric field in the system. When the photoconductive layer of the system is illuminated, the projected light can excite its electron-hole pairs, and therefore substantially decrease the electrical impedance of the illuminated area. As a result, the applied voltage drops across the liquid layer to the illuminated area, and induces a non-uniform distribution of an electric field between the top and bottom layers. In the ODEP force-based microparticle manipulation, the generated non-uniform electric field is used to manipulate electrically polarised microparticles like biological cells [12, 14-21]. Based on this, the cells can be simply manipulated by the optical images that are illuminated on the photoconductive layer. In practice, one can use a commercial digital projector to display optical images on a photoconductive material. This allows researchers to quickly modify the electrode setup, thus contributing to a more flexible manipulation of microparticles or cells compared with the DEP counterpart.
ODEP force-based schemes have been successfully demonstrated to manipulate biological cells for various applications, for example, the sperm sorting [16], cell lysis [17], normal oocytes discrimination [18], or mouse embryo selection [19]. Among the possible applications, moreover, the ODEP mechanism is generally regarded as an effective method for a precise cell sorting or separation. Although some of the above studies have successfully demonstrated the utility the working throughput or cell separation efficiency of previous works was normally limited due the lack of efficient operating scheme of ODEP force-based cell manipulation. In order separate target cells from a cell mixture in a simple, efficient, and precise manner, this study proposed a new operating methodology that primarily uses dynamic light bar scanning in a micro-chamber to continuously separate cells based on their inherent size difference.
leukocyte background to prepare a cell mixture with the final cell density of 5106 cells ml-1. The dynamic light bar with a slower moving velocity of 67.3 µm s-1 was exerted to drag, and thus cluster the all cells to the one side of micro-chamber. This was followed by implementing a faster moving velocity of 150.8 µm s-1 to the opposite direction so as to selectively drag, and thus separate the PC-3 cells from the leukocyte background. Results showed that the scanning numbers of dynamic light bar used for the operations had significant influence on the cell separation efficiency. Overall, the results revealed that the proposed cell sorting scheme was able to separate the PC3 cells from a leukocyte background with the separation efficiency as high as 82-89%. As a whole, this study has presented a new ODEP-based operation methodology that is capable of sorting or separating cells in a simple, efficient, and precise manner. All these traits are found particularly meaningful for the biological researches in which the isolation of highly pure cell species is important.
2. MATERIALS AND METHODS
2.1. Design
In this study, a new operating methodology of ODEP force-based cell manipulation was presented to separate target cells from a cell mixture. The fundamental principle of ODEP force-based cell manipulation is schematically illustrated in Fig. 1 (a). As discussed earlier, the optical illumination on the photoconductive material can produce a non-uniform electric field. The interaction between the generated non-uniform electric field and the induced electric dipoles on cells can generate the DEP force that is used to drive the movements of manipulated cells. In theory, the generated ODEP force acting on cells can be expressed through the equation 1 describing DEP force:
2 3
)] ( Re[
2 r K E
FDEP m (1)
where r,m, E, and K(ω) denote the cell radius, the permittivity of the solution surrounding the cells, the root-mean-square electric field strength, and the real part of the Clausius–Mossotti factor, respectively. In this study, proposed ODEP operation scheme for cell sorting is to mainly use a moving light bar functioning as a virtual electrode to separate cells based on their inherent size difference. The overall process (Fig. 1 (b)) includes a cell clustering (Fig. (I-III)) and a cell separation (Fig. 1(b)-(IV-VI)) operation. Briefly, the prepared cell mixture was loaded into the micro-camber, and followed by the implementation of ODEP force (Fig. 1(b)-(I)). In this study, a moving light bar with slower velocity of 67.3 µm s-1
2.2. Fabrication and experimental setup
Amorphous-silicon
AC ITO glass
Electric field profiles
Cells (positive DEP)
Projected light ITO glass
(a)
Gap of micro-chamber
Moving light bar direction
Width of moving light bar (I)
(II)
(III)
(IV)
(V)
(VI) (b)
Figure 1. (a) The fundamental principle of ODEP force-based cell manipulation. (b) schematic illustration of the cell sorting processes: (I)-(III) a moving light bar (moving velocity: 67.3 µm s-1) was used to continuously drag the all cells to the one side of micro-chamber; (IV)-(VI) another moving light bar (moving velocity: 150.8 µm s-1) proceeds to the opposite direction to selectively drag the cancer cells to the another side of chamber leaving behind the leukocytes remaining at the original place (brown color: leukocyte; blue color: PC-3 cell).
[image:4.596.196.398.98.479.2]
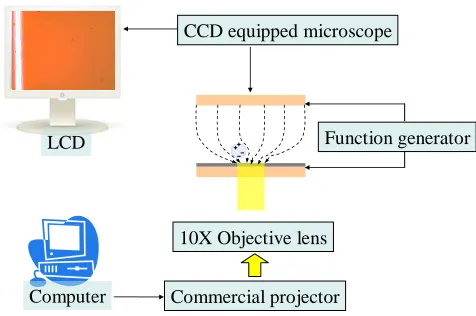
a function generator was used to apply an alternating current (AC) voltage between the two ITO glass layers of the chip (Fig. 1 (a)). A commercial digital projector (PLC-XU350, SANYO, Japan) coupled with a computer was used to display controllable light bars onto the photoconductive layer so as to generate ODEP force on cells. Moreover, a CCD-equipped microscope (Zoom 160, OPTEM, USA) was utilized to observe the manipulation of cells in the proposed system. The overall experimental setup is schematically illustrated in Fig. 2.
10X Objective lens
Commercial projector Computer
Function generator CCD equipped microscope
[image:5.596.178.416.206.364.2]LCD
Figure 2. Schematic illustration of the overall experimental setup
2.3. Preparation of cancer cells/ leukocytes mixture
In this study, the leukocytes were obtained by lysing the erythrocytes in a blood sample using a Red blood cell (RBC) lysis buffer (Unless otherwise stated all chemicals were purchased from Sigma, Taiwan). A centrifugation process (1,800 rpm, 8 min) was utilized to remove the lysed erythrocytes. A 250 mM sucrose solution was used to re-suspend the obtained cell pellet for maintaining an appropriate osmotic condition that keeps the cells viable. In this work, 10% of PC-3 cells were spiked into a leukocyte suspension to prepare a cell mixture with the final cell density of 5106 cells ml-1. 2.4. Evaluation of terminal velocity and manipulation force
exerting on a spherical particle in a continuous flow background can be expressed through Stokes’ law (equation 2):
F = 6πrηv (2)
where r, η, and v represent the radius of cells, the viscosity of the fluid, and the terminal velocity of the cells, respectively. At a given cell size and viscosity of the surrounding solution, the manipulation force generated under a specific operating condition can be estimated from the terminal velocity of the cells. The terminal velocity is defined as the maximum velocity of a moving light bar that can effectively manipulate the cells. For each cell species (PC-3 cells and leukocytes) studied, the terminal velocity (and manipulation force) occurred under various operation conditions (gap of micro-chamber: 50, 100, and 150 µm; bar width of light image: 20, 40, and 60 µm) (set voltage magnitude: 5V, and set voltage frequency: 100 kHz;) were then experimentally quantified.
2.5. Evaluation of cell separation efficiency
To find out the performance of the proposed operating methodology for cell sorting or separation, the cell separation efficiency was experimentally evaluated. Briefly, the prepared cell mixture was loaded into the micro-chamber, and followed by the ODEP force-based cell separation process, as described in Fig. 1 (b). The number of the PC-3 cells separated was directly counted through a image acquisition software (SimplePCI version 5.2.1, Compix Inc.) [3]. The cell separation efficiency (%) is herein defined as the percentage of the separated 3 cell number over the total PC-3 cell number.
2.6. Statistical analysis
Data from at least three separate experiments were analyzed and presented as the mean ± the standard deviation. One-way ANOVA analysis with a statistical significance level of 0.05 was used to examine the effect of operating conditions including gap of micro-chamber, and bar width of light image on the terminal velocity of cells and manipulation forces generated. In addition, the influence of light bar scanning number on the separation efficiency of cells was also evaluated by the statistical analysis. The Tukey Honestly Significant Difference (HSD) post hoc test was used to compare the differences between two conditions investigated when the null hypothesis of ANOVA analysis was rejected.
3. RESULTS AND DISCUSSIONS
3.1. Characterization of the operation conditions of ODEP for cell manipulation
background, the manipulated cells are subjected to various forces including dielectrophoretic force, AC electro-osmosis force, electro-thermal force, hydrodynamic drag force, or friction force [15, 22]. Under the given AC voltage condition of 5 V, and 100 kHz, the AC osmosis, and electro-thermal forces are reasonably ignored based on the previous report [22]. In this study, however, the generated ODEP force attracts the cells toward the surface of amorphous silicon layer, and thus the friction phenomenon could not be neglected when a light image moves to drag the cells. For simplification, a manipulation force is defined as the net force of the generated ODEP force and the friction force that occurred, based on the previous study [15, 20]. In this study, the manipulation force generated was assumed to be equal to the hydrodynamic drag force acting on the moving cells according to Stokes’ law. It was thus experimentally estimated through the terminal velocity of cells, the maximum velocity of a light image that can effectively drag cells.
0.00s 2.06s 4.15s 7.26s 9.18s
200 µm
Gap of micro-chamber -50 µm
Gap of micro-chamber -100 µm
Gap of micro-chamber -150 µm
(a)
Gap of micro-chamber (µm)
T
er
m
in
a
l
v
e
loc
it
y
(
µ
m
/s
ec
)
M
ani
p
ul
at
io
n
f
o
rc
e
(pN
)
[image:7.596.141.453.298.644.2](b)
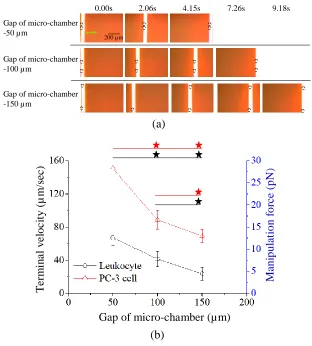
In this work, the ODEP force-based cell sorting was carried out in a micro-chamber. At a given operation condition, the gap between the top and bottom substrate (Fig. 1 (b)) could influence the property of electric field and thus the generated manipulation force exerting on cells. To find out the optimum gap by which the generated manipulation force is adequate for manipulating the cells within the experimental conditions explored, experiment was performed. Fig. 3 (a) shows the sequential images of PC-3 cell movements driven by a moving light bar in the micro-chamber with different gap (50, 100, and 150 µm; set bar width of light image: 40 µm). In this study, the moving light bars were at their terminal velocity, namely the maximum dragging velocity of light bar that can effectively drag cells. It can be clearly found from Fig. 3 (a) that the cells in the micro-chamber with 50 µm in gap had a higher terminal velocity, suggesting that an accordingly higher manipulation force was generated at such experimental condition. For the two cell species explored, moreover, Fig. 3 (b) reveals the effect of micro-chamber gap on the terminal velocity of cells and manipulation force generated. For each cell species investigated, similar to the observations in Fig. 3 (a), the terminal velocity of cells and manipulation force generated were significantly influenced by the micro-chamber gap (p<0.05, ANOVA), in which the above two factors decreased with the increase of micro-chamber gap. This finding could be due to the down regulation of the electric field strength when the micro-chamber gap is increased. The decrease of electric field strength can in turn decrease the manipulation force generated as the DEP force generated is theoretically proportional to the electric field strength squared according to equation 1. On the other hand, the PC-3 cells had a higher terminal velocity and manipulation force generated than that of leukocytes under the same experimental conditions (Fig. 3 (b)). This result can be reasonably explained by the fact that the PC-3 cells (diameter: 18.9±2.5 μm) is larger than the leukocytes (diameter: 9.2±2.1 μm), based on our microscopic observations. According to equation 1, the cellular size has cubic power influence on the resultant manipulation force, and terminal velocity. In the study, the micro-chamber with 50 µm in gap was chosen because a correspondingly higher manipulation force was generated at such conditions. Under the conditions, more importantly, the terminal velocity difference of the two cell species investigated was more significant than the others, in which the terminal velocities of PC-3 cells and leukocytes were measured to be 150.8±9.3, and 67.3±9.8 µm s-1, respectively (terminal velocity difference: 83.5 µm s -1
). The more significant difference on manipulation condition can facilitate the discrimination of two different cell species during the operation process.
PC-3 cells had a faster terminal velocity and higher manipulation force generated than that of leukocytes under the same experimental conditions.
0.00s 2.06s 4.01s 4.15s 6.26s
200 µm
Width of moving light bar-60 µm
Width of moving light bar-40 µm
Width of moving light bar-20 µm
(a)
Width of moving light bar (µm)
T
er
m
in
a
l
v
e
loc
it
y
(
µ
m
/s
ec
)
M
ani
p
ul
at
io
n
f
o
rc
e
(pN
)
(b)
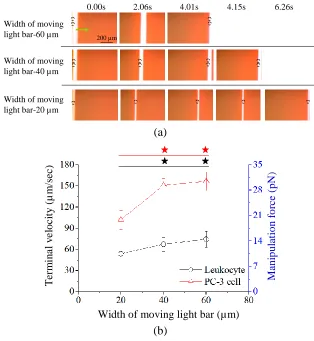
Figure 4. (a) The sequential microscopic images of PC-3 cell movements driven by a moving light bar with different bar width (20, 40, and 60 µm; set micro-chamber gap: 50 µm). The manipulated cells are marked in circle. (b) Evaluation of the terminal velocities of cells and the manipulation forces generated using the linear light image with different bar width (20, 40, and 60 µm). Results are given as mean±standard deviation of 3 separate experiments (n=9). Significant differences are expressed as black star (p<0.05, luekocytes) and red star (p<0.05, PC-3 cells).
[image:9.596.138.452.126.467.2]
velocities of the two cell species investigated were measured to be 150.8±9.3, and 67.3±9.8 µm s-1 for the PC-3 cells and leukocytes, respectively.
3.2. Performances of cell separation efficiency
After above fundamental parameters were determined, the actions of the moving light bar were designed and programmed to isolate PC-3 cells from a leukocyte background as illustrated in Fig. 1 (b). To demonstrate this, PC-3 cells/leukocytes mixture with a cell density of 5106 cells ml-1 was loaded into the micro-chamber, and followed by the procedures as previously described. In this study, the experimental conditions (AC voltage: 5V, 100 kHz; micro-chamber gap: 50 µm; bar width of light image: 40 µm) were set based on the previous evaluation.
(I) (II) (III)
200 µm
(IV)
(V) (VI) (VII) (VIII)
1st
(a)
1st 2nd 3rd
S
epa
ra
ti
o
n
e
ff
ic
ie
n
c
y
(%
)
Light bar scanning number (b)
[image:10.596.202.399.294.635.2]
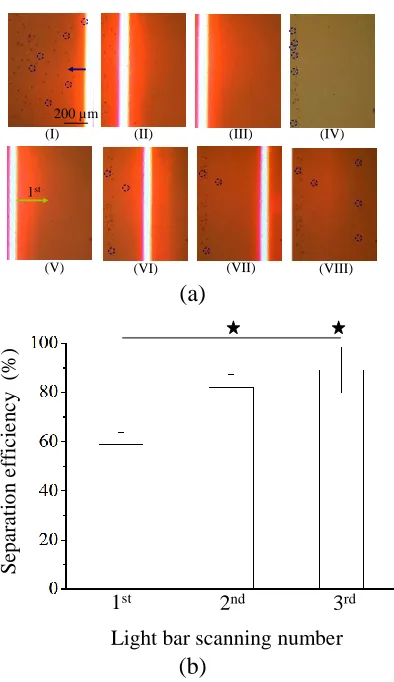
Figure 5 (a) shows the sequential microscopic images of the whole cell sorting procedures. Firstly, the light bar with 67.3 µm s-1 in moving velocity was designed to drag the all cells (Fig. 5 (a)-(I)) to the one side of micro-chamber (Fig. 5 (a)-(IV)) so as to cluster the loaded cells (Fig. 5 (a)-(I)-(IV)). It is worth explaining that the terminal velocity of a specific cell species means the critical velocity below it the specific cells can be effectively dragged by the manipulation force generated. Above it, conversely, the hydrodynamic dragging force of cells is greater than the manipulation force generated. As a result, the moving light bar can not drag cells. As discussed earlier, the terminal velocities of PC-3 cells and leukocytes were measured to be 150.8±9.3, and 67.3±9.8 µm s-1, respectively. In the demonstration (Fig. 5 (a)), the light bar with the moving velocity of 67.3 µm s-1 was utilized so that it can effectively drag, and thus cluster the all loaded cells to one side of the micro-chamber, as shown in (Fig. 5 (a)-(I)-(IV)). In the following steps (Fig. 5 (a)-(V)-(VIII)), the light bar with a faster moving velocity of 150.8 µm s-1
was designed to scan in the opposite direction to the action of the first light bar. By this process, only the PC-3 cells can be selectively dragged to the one side of micro-chamber leaving behind the leukocytes at the original location, as illustrated in Fig. 5 (a)-(V)-(VIII). Based on the process, the target cells can be separated from a cell mixture in a simple, efficient, and precise manner.
In practice, moreover, the above scanning procedures can be repeated in times to achieve a better cell sorting effect. To find out the effect of scanning number on the resultant cell separation efficiency, experimental investigations were carried out. Result (Fig. 5 (b)) exhibits that the scanning number had a significant influence on the efficiency of cell separation (p<0.05, ANOVA), in which 2 or 3 time scanning procedures can achieve a significantly higher cell separation efficiency than a single scanning procedure. Overall, the proposed cell sorting scheme was able to achieve the cell separation efficiency as high as 82-89%. The proposed ODEP force-based cell sorting method was found promising to be incorporated in various microfluidic systems for high purity cell isolation, separation, and sorting.
4. CONCLUSIONS
Under a given ODEP background, the biological cells might experience ODEP forces with varied degree due to the difference on inherent cell properties (e.g. size). Based on the phenomenon, this study presented a new ODEP force-based cell manipulation scheme for effective cell sorting. In the work, a moving light bar with different moving velocities was simply used to selectively separate the cancer cells (e.g. PC-3 cells) from a leukocyte background. To achieve this, the optimum operation conditions of ODEP force, by which the two cell species can be effectively discriminated, for manipulating, and sorting these cells were first characterized. Results showed that the maximum velocities of the moving light bar that can effectively manipulate the PC-3 cells and leukocytes were evaluated to be 150.8±9.3, and 67.3±9.8 µm s-1
experimentally evaluated. Results revealed that the presented ODEP force-based scheme was able to sort PC-3 cells from a leukocyte background with high cell separation efficiency (82-89%).
ACKNOWLEDGEMENTS
This work was sponsored by the National Science Council (NSC) in Taiwan (NSC101-2221-E-182-001-MY3) and Chang Gung Memorial Hospital (CMRPG3B0971).
References
1. M. Werner, F. Merenda, J. Piguet, R.P. Salath and H. Vogel, Lab Chip, 11 (2011) 2432–2439. 2. L.C. Hsiung, C.L. Chiang, C.H. Wang, Y.H. Huang, C.T. Kuo, J.Y. Cheng, C.H. Lin, V. Wu, H.Y.
Chou, D.S. Jong, H. Lee and A.M. Wo, Lab Chip, 11 (2011) 2333–2342. 3. S.B. Huang, M.H. Wu and G.B. Lee, Sens. Actuators-B, 142 (2009) 389–399. 4. S.M. Imaad, N. Lord, G. Kulsharova and G.L. Liu, Lab Chip, 11 (2011) 1448–1456. 5. R. Afshar, Y. Moser, T. Lehnert and M.A. Gijs, Anal. Chem., 83 (2011) 1022–1029.
6. J.L. Baylon-Cardiel, N.M. Jesus-Perez, A.V. Chavez-Santoscoy and B.H. Lapizco-Encinas, Lab Chip, 10 (2010) 3235–3242.
7. P. Augustsson, J. Persson, S. Ekström, M. Olin and T. Laurell, Lab Chip, 9 (2009) 810–818. 8. B.B. Yellen, R.M. Erb, H.S. Son, R. Hewlin, H. Shang and G.C. Lee, Lab Chip, 7 (2007) 1681–
1688.
9. H.S. Moon, K. Kwon, S.I. Kim, H. Han, J. Sohn, S. Lee and H.I. Jung, Lab Chip, 11 (2011) 1118– 1125.
10.C.T. Ho, R.Z. Lin, W.Y. Chang, H.Y. Chang and C.H. Liu, Lab Chip, 6 (2006) 724–734. 11.D.R. Albrecht, V.L. Tsang, R.L. Sah and S.N. Bhatia, Lab Chip, 5 (2005) 111–118. 12.P.Y. Chiou, A.T. Ohta and M.C. Wu, Nature, 436 (2005) 370-372.
13.T.B. Jones, Electromechanics of Particles, Cambridge University Press, Cambridge, (1995) 34–48, 110–138..
14.M.C. Wu, Nat. Photonics, 5 (2011) 322-324.
15.Y.H. Lin, Y.W. Yang, Y.D. Chen, S.S. Wang, Y.H. Chang and M.H. Wu, Lab Chip, 12 (2012) 1164-1173.
16.A.T. Ohta, M. Garcia, J.K. Valley, L. Banie, H.Y. Hsu, A. Jamshidi, S.L. Neale, T. Lue and M.C. Wu, Lab Chip, 10 (2010) 3213–3217.
17.Y.H. Lin and G.B. Lee, Appl. Phys. Lett., 94 (2009) 033901.
18.H. Hwang, D.H. Lee, W. Choi and J.K. Park, Biomicrofluidics, 3 (2009) 14103.
19.J.K. Valley, P. Swinton, W.J. Boscardin, T.F. Lue, P.F. Rinaudo, M.C. Wu and M.M. Garcia, Plos one, 5 (2010) e10160.
20.A.T. Ohta, P.Y. Chiou, T.H. Han, J.C. Liao, U. Bhardwaj, E.R.B. McCabe, Y. Fuqu, S. Ren and M.C. Wu, J. Microelectromech. Syst., 16 (2007) 491–499.
21.J.K. Valley, S. Neale, H.Y. Hsu, A.T. Ohta, A. Jamshidi and M.C. Wu, Lab Chip, 9 (2009) 1714– 1720.
22.J.K. Valley, A. Jamshidi, A.T. Ohta, H.H. Yin and M.C. Wu, J. Microelectromech. Syst., 17 (2008) 342-350.
23.S.L. Neale, A.T. Ohta, H.Y. Hsu, J.K. Valley, A. Jamshidi and M.C. Wu, Opt. Express.,17 (2009) 5232-5239.