White Rose Research Online URL for this paper:
http://eprints.whiterose.ac.uk/129786/
Version: Published Version
Article:
Atkinson, Amy L, Berry, Ed D J, Waterman, Amanda H et al. (3 more authors) (2018) Are
there multiple ways to direct attention in working memory? Annals of the New York
Academy of Sciences. pp. 1-12. ISSN 0077-8923
https://doi.org/10.1111/nyas.13634
[email protected] https://eprints.whiterose.ac.uk/ Reuse
This article is distributed under the terms of the Creative Commons Attribution (CC BY) licence. This licence allows you to distribute, remix, tweak, and build upon the work, even commercially, as long as you credit the authors for the original work. More information and the full terms of the licence here:
https://creativecommons.org/licenses/
Takedown
If you consider content in White Rose Research Online to be in breach of UK law, please notify us by
A N N A L S O F T H E N E W Y O R K A C A D E M Y O F S C I E N C E S
Special Issue:Attention in Working Memory
ORIGINAL ARTICLE
Are there multiple ways to direct attention in working
memory?
Amy L. Atkinson, 1Ed D.J. Berry,1Amanda H. Waterman,1Alan D. Baddeley,2
Graham J. Hitch,2and Richard J. Allen1
1School of Psychology, University of Leeds, Leeds, United Kingdom.2Department of Psychology, University of York,
Heslington, York, United Kingdom
Address for correspondence: Amy L. Atkinson, School of Psychology, University of Leeds, Leeds LS2 9JT, UK. [email protected]
In visual working memory tasks, memory for an item is enhanced if participants are told that the item is relatively more valuable than others presented within the same trial. Experiment 1 explored whether these probe value boosts (termedprioritization effectsin previous literature) are affected by probe frequency (i.e., how often the more valuable item is tested). Participants were presented with four colored shapes sequentially and asked to recall the color of one probed item following a delay. They were informed that the first item was more valuable (differential probe value) or as valuable as the other items (equal probe value), and that this item would be tested more frequently (differential probe frequency) or as frequently (equal probe frequency) as the other items. Probe value and probe frequency boosts were observed at the first position, though both were accompanied by costs to other items. Probe value and probe frequency boosts were additive, suggesting the manipulations yield independent effects. Further supporting this, experiment 2 revealed that probe frequency boosts are not reliant on executive resources, directly contrasting with previous findings regarding probe value. Taken together, these outcomes suggest there may be several ways in which attention can be directed in working memory.
Keywords: visual working memory; attention; focus of attention; probe frequency; probe value; prioritization
Are there multiple ways to direct attention in working memory?
Working memory (WM) refers to a system that allows a limited amount of information to be tem-porarily stored in a state of heightened accessibil-ity for use in ongoing information processing.1 It is considered essential for a myriad of important activities, including learning and skill acquisition.2,3 Many of these activities require individuals to retain information that varies by importance or goal revelance.4,5An attentional mechanism that allows a subset of information to be stored in a privi-leged state would therefore be highly advantageous.6 There is growing evidence to suggest that such a subregion exists within WM, termed thefocus of attention(FoA).7–10
The FoA, and the relationship between WM and attention more generally, has been explored using
several methods. The most commonly employed paradigm is retro-cueing, in which a cue is presented immediately following an array of to-be-remem-bered items. This cue typically informs participants which item will, or is most likely to, be tested at retrieval. Retro-cues improve memory for the cued item,11–14though the size of boosts appear to depend on the reliability of the cue.12For instance, Gunseli et al.12reported larger benefits when the cued item was tested 80% of the time, compared with a con-dition in which the cued item was assessed in only 50% of the trials.
The reward associated with an item can also be increased to encourage participants to direct atten-tion toward it.15–22In recent years, this has been used to explore the relationship between WM and atten-tion through a probe value manipulaatten-tion (often referred to as “strategic prioritization” in previous
doi: 10.1111/nyas.13634
1
literature15–18). In this paradigm, participants are typically presented with a series of colored shapes sequentially. After a brief delay, memory for one of the shape-color bindings is assessed using cued recall. Before the block of trials, participants are told that one serial position (SP) is more valuable than the rest, with correct recall of that item gain-ing them more points. For example, participants might be told that correct recall of the first SP will gain them four points, whereas correct recall of any other item will gain them one point.16Although the points system is notional, this results in a memory boost for the more valuable item relative to a condi-tion in which the same SP is less valuable (i.e., worth fewer points). This boost is, however, accompanied by costs to other items presented within the same trial, which are not remembered as accurately.15–17 Regardless of which SP is more valuable, partic-ipants also show a robust recency effect, exhibit-ing higher accuracy at the final position relative to other nonprioritized positions.15From this, it has been concluded that the more valuable item and the final item are more likely to be retained in the FoA, rendering them more accessible.15–17Boosts to the more valuable item (referred to as probe value boosts hereafter) are reduced by an attentionally demanding concurrent task, suggesting that these effects are likely to involve a process that relies on executive control, such as attentional refreshing.16In contrast, the recency effect is not reduced by a con-current task, suggesting that items can be retained in the FoA through cost-free automatic routes, as well as costly voluntary routes.16
In research using the probe value paradigm, memory for the more valuable item has been tested as frequently as memory for the other items.15–17 However, evidence from the cueing literature sug-gests that the size of retro-cue boosts depend on the frequency with which the cued item is assessed at retrieval.12The size of probe value boosts might therefore also differ depending upon how often the more valuable item is tested (i.e., probe frequency). Such findings would provide further insights into the probe value effect, demonstrat-ing whether boosts are affected by other task fac-tors. These findings would also reveal whether probe value and probe frequency effects are independent or contingent on each other. Evidence that probe value and probe frequency effects are independent might suggest that the manipulations encourage
participants to direct attention in different ways, a finding that would have important implications for the relationship between WM and attention.
These research questions were investigated in the current set of experiments. Experiment 1 orthog-onally manipulated probe value and probe fre-quency, targeting both manipulations at the first item. Experiment 2 explored probe frequency effects further, examining whether boosts are reliant on executive resources during encoding and mainte-nance, as probe value effects appear to be.16
Experiment 1
Experiment 1 orthogonally manipulated probe value (whether an item was more valuable (differen-tial) or not (equal)) and probe frequency (whether an item was more likely to be tested (differential) or not (equal)). Both manipulations were targeted at the first item. Based on previous findings, it was predicted that significant probe value boosts would be observed at the first SP, whereby memory for this item would be higher in the differential probe value condition than the equal probe value condition.15,16 It was also predicted that probe frequency effects would emerge at SP1, with participants exhibiting higher accuracy for this item in the dif-ferential probe frequency condition than the equal probe frequency condition.11–13Of particular inter-est was whether an interaction would emerge at SP1. Evidence of an interaction between probe value and probe frequency would indicate that these manip-ulations are not independent, and that the size of probe value boosts differs depending on probe fre-quency. Moreover, evidence that probe value effects are smaller in the differential probe frequency con-dition would suggest that participants experience less benefit from increased probe value when they are already motivated to direct attention to this item. Such findings might be taken as evidence that probe value and probe frequency encourage participants to direct attention in similar ways. Alternatively, probe value and probe frequency effects might be additive, suggesting that the manipulations might encourage participants to direct attention in different ways.
Method
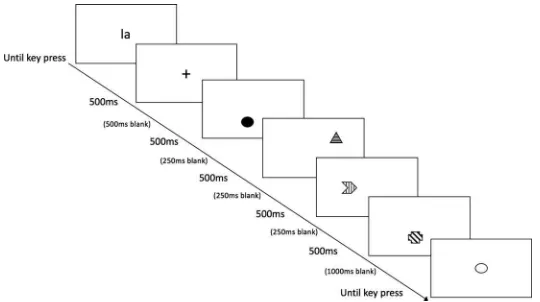
Figure 1. The experimental paradigm used in experiment 1.
corrected-to-normal vision, and no color blindness. Participants were undergraduate students who were reimbursed for their time with course credits. The experiment was approved by the School of Psychol-ogy Ethics Committee at the University of Leeds (UK).
Materials. In each trial, four items were presented sequentially. Stimuli were created by randomly pair-ing a shape from a pool of six options (circle, tri-angle, arch, arrow, flag, cross) with a color from a pool of six options (red, yellow, green, blue, pur-ple, black). No shape or color was repeated within the same trial. All stimuli subtended a visual angle of approximately 1.5°, based on a viewing distance of 50 cm. Shapes were presented on a white back-ground at one of eight points around a 2° imagi-nary circle positioned at the center of the screen. Locations were selected randomly, with the con-straint that no location could be used more than once per trial. The test cue was an outline of one of the stimuli presented during the encoding phase. This was displayed in the center of the screen. In the equal probe frequency condition, the first SP was tested as often as other items (25% of the time). In the differential probe frequency condition, the first SP was assessed 70% of the time, whereas the other items were each probed 10% of the time.
Design and procedure. The study employed a 2×2×4 within subject design, manipulating probe value (differential, equal), probe frequency (differ-ential, equal), and SP (1–4). Participants completed four blocks of 40 trials; one for each combination of probe value and probe frequency conditions. The
order of probe frequency blocks and the order of probe value blocks within the probe frequency con-ditions were counterbalanced. In the equal probe frequency conditions, each SP was tested 10 times. In the differential probe frequency conditions, the first SP was tested 28 times and the other SPs were each tested four times. The SPs tested were ran-domly distributed within the blocks. At the start of each block, participants completed four practice trials to familiarize themselves with the condition.
Each condition commenced with the provision of written instructions. In the differential probe value conditions, participants were told that correct recall of the first item would earn them four points, whereas correct recall of the other items would earn them one point. In the equal probe value conditions, they were told each item was worth one point. The points were part of a notional reward system: the number of points accrued was never tallied and no actual rewards were given. During the instructions, participants were also informed about the probe fre-quency manipulation. In the equal probe frefre-quency conditions, they were told that all items would be tested the same number of times. In the differential probe frequency condition, they were told that the first item would be tested more often than the other items.
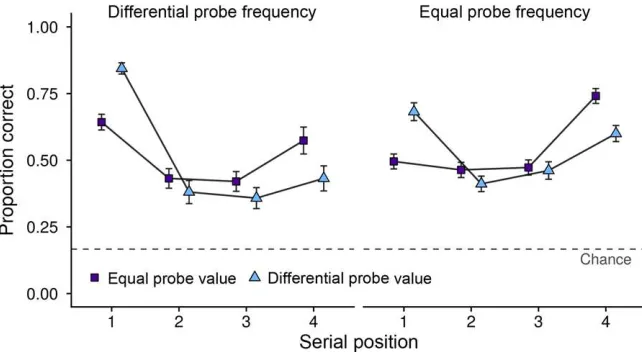
Figure 2. Mean accuracy (and SE) as a function of probe value, SP, and probe frequency in experiment 1.
colored shapes were displayed sequentially, with each shape displayed for 500 milliseconds. After a delay of 1000 ms, the outline of one shape was pre-sented and participants verbally recalled the original color of the shape. Their response was recorded by the experimenter, who then pressed the space bar to progress onto the next trial. Participants were reminded of the probe value and probe frequency instructions after every ten trials. Participants were not given feedback regarding performance on the task.
Data analysis
The dependent variable was accuracy, determined by the proportion of trials where participants responded correctly. Findings are first reported as a function of SP. Further planned analysis was then conducted at SP1, as this is the position at which the manipulations were targeted.
In experiment 1 and the subsequent experiments, data were analyzed using frequentist and Bayes Fac-tor (BF) methods. BF analysis assesses the strength of evidence for the alternative hypothesis relative to the null hypothesis, and also provides a test of equivalence between conditions.24,25 This anal-ysis was conducted in R,26 using the BayesFactor package.27When reporting the BF analysis, the most likely model given the data is described relative to the null model including only random effects of participant. BFs for all main effects and interac-tions are also reported. If the effect or interaction was included in the most likely model, the BF was
calculated by comparing the most likely model to a model excluding that effect. If the effect or inter-action was not included in the most likely model, the BF was calculated by comparing the most likely model to a model including all of the effects featured in the most likely model plus the effect of interest. BF10 values describe how many times more likely the alternative hypothesis is to the null hypothe-sis, whereas BF01 describes the ratio of how likely the null hypothesis is compared with the alternative hypothesis.
Results
Across SPs. Mean accuracy as a function of probe value, probe frequency, and SP is displayed in Figure 2. A 2 (Probe value)×2 (Probe frequency)× 4 (SP) within-subjects analysis of variance (ANOVA) revealed no main effect of probe value (DifferentialM=0.52, SE=0.02; Equal M=0.53, SE=0.02; (F(1,43)=0.38,P=0.54, MSE=0.038,
Table 1. Mean accuracy (and SE) in experiment 1 as a function of probe value and SP, collapsed across probe frequency conditions
SP1 SP2 SP3 SP4 Across SPs
Differential probe value 0.76 (0.02) 0.40 (0.03) 0.41 (0.03) 0.52 (0.03) 0.52 (0.02) Equal probe value 0.57 (0.02) 0.45 (0.02) 0.45 (0.03) 0.66 (0.03) 0.53 (0.02)
SE =0.02;P <0.001), SP1 and SP4 (M =0.59, SE=0.03;P=0.034), SP2 and SP4 (P<0.001), and SP3 and SP4 (P <0.001). Significant interactions emerged between probe value and SP (F(3,129)= 25.01,P<0.001, MSE=0.036,η2p =0.37,η2G =
0.069; BF10 > 1000), and probe frequency and SP (Greenhouse-Geisser correctedF(2.54,109.31)= 19.15, P < 0.001, MSE = 0.042, η2p = 0.31,
η2G = 0.063; BF10 > 1000), indicating that the effects of probe value and probe frequency dif-fered depending upon the SP tested. No interactions emerged between probe value and probe frequency (F(1,43) = 0.11, P = 0.74, MSE = 0.032, η2p < 0.01,η2G<0.01; BF01=8.34) or probe value, probe frequency, and SP (Greenhouse–Geisser corrected F(2.51,107.82) = 0.25, P = 0.83, MSE = 0.037,
η2p<0.01,η2G<0.01; BF01=27.22). These outcomes were corroborated by BF analysis, which revealed that the most likely model included a main effect of SP, as well as interactions between probe value and SP, and probe frequency and SP (BF10>1000 relative to the null model with random effects of participant only).
To investigate the interaction between probe value and SP, a series of paired samplet-tests (corrected using Bonferroni–Holm) were conducted. Mean proportion correct as a function of probe value and SP is displayed in Table 1. At SP1, participants per-formed significantly better in the differential probe value condition (t(43)=8.85,P<0.001, BF10 > 1000,d=1.33). The pattern was reversed at SP4, with participants exhibiting higher accuracy in the equal probe value condition (t(43) = –4.08,P < 0.001, BF10 = 130.6, d = –0.61). No significant differences between probe value conditions were
found at SP2 (t(43)=–1.71,P=0.19, BF01=1.64, d = –0.26) or SP3 (t(43) = –1.38, P = 0.19, BF01=2.56,d=–0.21). In summary, this indicates that increasing the value of the first item boosted performance at SP1, had no significant effect on performance at SP2 and SP3, and negatively affected performance at SP4.
A series of paired samplet-tests (corrected using Bonferroni–Holm) were also conducted to investi-gate the interaction between probe frequency and SP. Mean proportion correct as a function of probe frequency and SP is displayed in Table 2. At SP1, higher accuracy was observed in the differential probe frequency condition (t(43)=6.05,P<0.001, BF10 >1000, d =0.91). The opposite pattern of results was observed at SP3 and SP4, with partic-ipants exhibiting significantly higher accuracy in the equal probe frequency condition (SP3:t(43)= –2.47, P = 0.035, BF10 = 2.45, d = –0.37; SP4: t(43) = –4.51, P < 0.001, BF10 = 450.47, d = –0.68). No effect of probe frequency emerged at SP2 (t(43)=–0.87,P=0.39, BF01=4.35,d=–0.13). To summarize, this demonstrates that increasing the likelihood of the first item being assessed enhanced accuracy at SP1, had no significant effect at SP2, and reduced accuracy at SP3 and SP4.
SP1. As both manipulations were targeted at SP1, further analysis was conducted at this SP to explore whether an interaction emerged between probe value and probe frequency. A 2 (Probe value)×2 (Probe frequency) within-subjects ANOVA revealed a significant main effect of probe value (F(1,43)= 78.28,P<0.001, MSE=0.021,η2p=0.65,η2G=0.21;
BF10 >1000), with participants exhibiting higher
Table 2. Mean accuracy (and SE) in experiment 1 as a function of probe frequency and SP, collapsed across probe value conditions
SP1 SP2 SP3 SP4 Across SPs
[image:6.504.41.462.607.650.2]accuracy in the differential probe value condition. There was also a significant main effect of probe fre-quency (F(1,43)=36.57,P<0.001, MSE=0.029,
η2p =0.46,η2G =0.15; BF10 >1000), with partici-pants exhibiting higher accuracy in the differential probe frequency condition. No significant interac-tion emerged between probe value and probe fre-quency (F(1,43) =0.17,P=0.69, MSE=0.015,
η2p<0.01,η2G <0.01; BF01=4.22), suggesting that probe value boosts do not differ depending on probe frequency and that the manipulations have inde-pendent effects. BF analysis supported these con-clusions, with the most likely model including main effects of probe value and probe frequency (BF10> 1000 relative to the null model with random effects of participant only).
Discussion
In line with previous findings, participants exhib-ited significant probe value effects, providing fur-ther evidence that individuals can direct attention to more valuable items in visual WM.15–17Significant probe frequency effects were also observed, demon-strating that individuals can also orient attention to items that are more likely to be tested. Both probe value and probe frequency boosts came at a cost to some of the other items, suggesting that these manipulations do not increase WM capacity, but rather encourage individuals to alter the way in which they allocate attention. Evidence that costs emerged in the probe frequency condition should, however, be treated with caution, as there were only a small number of trials testing SPs 2–4 in the dif-ferential probe frequency conditions. Nevertheless, this is in line with previous findings, suggesting that the direction of attention within WM results in costs to items that are not focused on.12,13,15–17
Importantly, no significant interaction emerged between probe value and probe frequency across SPs or at the SP in which the manipulations were tar-geted (SP1). This indicates that probe value effects are not affected by the frequency with which the more valuable item is assessed at retrieval. Per-haps more importantly, this indicates that probe value and probe frequency are independent in their impacts on WM, and that they might encourage individuals to direct attention in different ways. Evi-dence for the latter is preliminary, however, warrant-ing additional research to explore this possibility further.
Previous research has suggested that probe value effects are reduced if participants engage in an attentionally demanding concurrent task during encoding and maintenance.16It would be useful to establish whether such a task also reduces probe fre-quency boosts. This would provide further insights into probe frequency effects, while also further exploring whether probe value and probe frequency are likely to encourage participants to direct atten-tion in different ways. Experiment 2 therefore inves-tigated this.
Experiment 2
Huet al.16 recently explored whether probe value effects are reliant on executive resources. In their experiment, participants were told that the first SP or the final SP was more valuable than the rest. Dur-ing encodDur-ing and maintenance, participants either engaged in articulatory suppression (low load) or counted upwards in steps of two (high load). Sig-nificant probe value boosts were observed in the low load condition, though these were significantly reduced or abolished under high load. From this, it was concluded that probe value effects are reliant on executive control.16
To allow comparisons with the probe value lit-erature, the methodology used was similar to that used by Hu et al.16 A 2 (probe frequency: equal, differential)×2 (load: equal, differential)×4 (SP: 1–4) within-subjects design was employed. In the low load condition, participants simply repeated a two-digit number during encoding and main-tenance. In the high load conditions, participants counted upwards in steps of two during these phases. As in experiment 1, the probe frequency manipulation was targeted at the first SP. Perfor-mance at this position was therefore of particular interest. Evidence of an interaction between probe frequency and load, with performance in the dif-ferential probe frequency condition particularly affected by an increase in load, would suggest that boosts are reliant on executive control. These outcomes would be in line with findings from the probe value literature.16 Conversely, evidence of no interaction between probe frequency and load would suggest that effects are not reliant on executive resources, contrasting with findings on probe value.16 Such outcomes would suggest that the manipulations encourage participants to direct attention in different ways, further supporting the conclusions drawn from experiment 1.
Method
Participants. Twenty-four young adults partici-pated (aged 18–35 years;M=22.11, SD=3.58; 10 males). Participants were either paid or given course credit. The experiment was approved by the School of Psychology Ethics Committee at the University of Leeds (UK).
Materials. The materials used were identical to experiment 1, except that participants were pre-sented with a randomly selected number between 20 and 99 at the start of each trial, as opposed to the word “la.”
Design and procedure. The study employed a 2 × 2 × 4 within-subjects design, manipulating probe frequency (equal, differential), load (low, high) and SP (1–4). Participants completed four blocks of 40 trials; one for each combination of probe frequency and load. The order of probe fre-quency blocks and the order of load blocks within the probe frequency conditions were counterbal-anced. The SPs tested were randomly distributed within the blocks.
Participants were told that correctly recalling the color of the shape tested would gain them one point. The probe frequency instructions were the same as in experiment 1. The experimental paradigm was also identical to experiment 1, except that partic-ipants were presented with a number between 20 and 99 at the start of the trial as opposed to the word “la.” In the low load conditions, participants were asked to repeat the number until retrieval. In the high load conditions, participants were asked to count upwards in steps of two from the number until the retrieval phase (e.g., 45, 47, 49). This load manipulation is identical to that employed by Hu et al.
Data analysis
The dependent variable was accuracy, determined by mean proportion correct. Findings are first reported across SPs, followed by further planned analysis at SP1.
Results
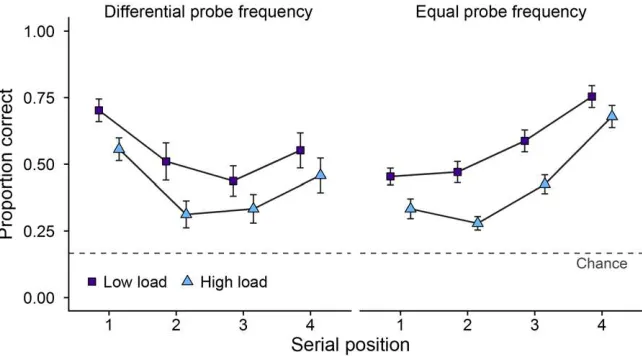
Across SPs. Mean proportion correct as a func-tion of probe frequency, SP, and load is displayed in Figure 3. A 2 (Probe frequency)×2 (Load)× 4 (SP) within-subjects ANOVA revealed no signif-icant main effect of probe frequency (Differential M=0.48, SE=0.03; Equal M=0.50, SE=0.02; F(1,23)=0.39,P=0.54, MSE=0.056,η2p=0.016,
η2G <0.01; BF01=7.25), indicating that increasing the likelihood of the first item being assessed did not affect overall performance on the task. There was, however, a main effect of load (F(1,23)=77.86,P< 0.001, MSE=0.023,η2p=0.77,η2G=0.081; BF10> 1000), with higher accuracy in the low load condi-tion (M=0.56, SE=0.02) relative to the high load condition (M=0.42, SE=0.21). There was also a significant main effect of SP (Greenhouse–Geisser correctedF(2.19,50.39)=10.48,P<0.001, MSE= 0.081,η2p =0.31,η2G =0.11; BF10 >1000), with pairwise comparisons (corrected using Bonferroni– Holm) revealing significant differences at SP1 (M = 0.51, SE = 0.03) and SP2 (M = 0.39, SE=0.03;P=0.012), SP2 and SP4 (M=0.61, SE= 0.04;P<0.001) and SP3 (M=0.45, SE=0.03) and SP4 (P<0.001). A significant interaction emerged between probe frequency and SP (F(3,69)=17.79, P <0.001, MSE =0.052, η2p =0.44,η2G =0.12;
Figure 3. Mean proportion correct (and SE) as a function of probe frequency, SP, and load in experiment 2.
SP (F(3,69)=1.31,P=0.28, MSE=0.037,η2p =
0.054,η2G <0.01; BF01 =10.96). There were also no interactions between probe frequency and load (F(1,23)<0.01,P=0.96, MSE=0.034,η2p<0.01,
η2G <0.01; BF01=6.51), and probe frequency, load and SP (F(3,69)=0.27,P=0.85, MSE=0.033,
η2p=0.012,η2G<0.01; BF01=14.2). These findings were corroborated by BF analysis, which revealed that the most likely model included main effects of load and SP, as well as an interaction between probe frequency and SP (BF10>1000 relative to the null model with random effects of participant only).
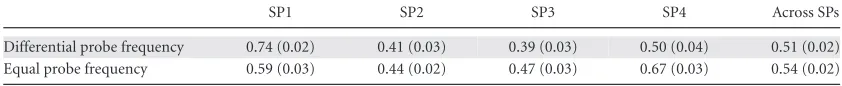
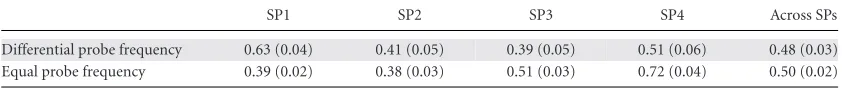
To investigate the interaction between probe fre-quency and SP, a series oft-tests (corrected using Bonferroni–Holm) were conducted. Accuracy as a function of probe frequency and SP is displayed in Table 3. Accuracy was higher in the differential probe frequency condition at SP1 (t(23) = 6.63, P<0.001, BF10>1000,d=1.35). This pattern was reversed at SP3 (t(23)=–2.78,P=0.021, BF10= 4.63,d=–0.57) and SP4 (t(23)=–3.65,P=0.004, BF10=27.09,d=–0.74), with participants exhibit-ing higher accuracy in the equal probe frequency condition. No significant effect of probe frequency emerged at SP2 (t(23)=0.76,P=0.46, BF01=3.57, d=0.15). To summarize, these outcomes indicate that increasing the likelihood of the first item being tested enhanced memory at SP1, had no significant effect at SP2, and impaired memory at SP3 and SP4.
SP1. As in experiment 1, further planned anal-ysis was conducted at SP1 to explore whether an
interaction emerged between probe frequency and load. A 2 (Probe frequency) ×2 (Load) within-subjects ANOVA revealed a main effect of probe fre-quency (F(1,23)=43.89,P<0.001, MSE=0.03,
η2p =0.66,η2G =0.29; BF10>1000), with partic-ipants exhibiting higher accuracy in the differen-tial probe frequency condition relative to the equal probe frequency condition. There was also a main effect of load (F(1,23)=18.66,P<0.001, MSE= 0.023,η2p =0.45,η2G =0.12; BF10=435.73), with participant exhibiting higher accuracy in the low load condition. There was, however, no signifi-cant interaction between probe frequency and load (F(1,23) = 0.24, P = 0.63, MSE = 0.016, η2p =
0.01,η2G <0.01; BF01=3.33), suggesting that the probe frequency boosts observed were not affected by load. BF analysis revealed that the most likely model included main effects of probe frequency and load (BF10 >1000 relative to the null model with random effects of participant only).
Discussion
Table 3. Mean accuracy (and SE) in experiment 2 as a function of probe frequency and SP, collapsed across load conditions
SP1 SP2 SP3 SP4 Across SPs
Differential probe frequency 0.63 (0.04) 0.41 (0.05) 0.39 (0.05) 0.51 (0.06) 0.48 (0.03) Equal probe frequency 0.39 (0.02) 0.38 (0.03) 0.51 (0.03) 0.72 (0.04) 0.50 (0.02)
These outcomes suggest that probe frequency boosts are not reliant on executive resources during encoding and maintenance, and might be obtained in a relatively cost-free and automatic manner.28,29,32 This directly contrasts with research exploring probe value, which has revealed that these effects are sig-nificantly reduced or abolished under high cognitive load.16This suggests that the motivation underpin-ning attentional direction is important in determin-ing whether boosts are reliant on executive control. It also provides further evidence that the probe value and probe frequency manipulations encourage par-ticipants to direct attention in different ways.
Evidence that probe frequency boosts are not reliant on executive resources also contrasts with findings from the retro-cue literature. In a pair of experiments, Janczyk and Berryhill34revealed that retro-cue effects are significantly reduced if partic-ipants engage in an attentionally demanding con-current task during cue onset and encoding. These contrasting findings might indicate that reliance on executive control depends on the stage at which individuals are told which item is most likely to be tested (i.e., before or after item presentation). How-ever, these differences in findings could also relate to other methodological factors. In the current experi-ment, the first SP was always more likely to be tested in the differential probe frequency conditions. How-ever, in retro-cue experiments, the item that is more likely to be probed changes on a trial-by-trial basis. It might therefore be impossible for participants to automate the direction of attention in the retro-cue paradigm, as we believe may be occurring here.
Increased probe frequency came at a cost to some SPs that were less likely to be tested (SP3 and SP4). This replicates the outcomes from experiment 1, further demonstrating that the direction of atten-tion can negatively affect items that are not focused on.12,13,15–17Across conditions, accuracy at SP4 was significantly higher than the other SPs that were less likely to be assessed (SP2 and SP3), supporting previous findings that this item holds a privileged
status within WM.15As in experiment 1, these out-comes should, however, be interpreted with caution, as participants completed only a small number of trials at SPs 2–4 in the differential probe frequency conditions.
General discussion
A pair of experiments explored how attention can be directed in visual WM. Of particular interest was whether probe value boosts are affected by the prob-ability with which the more valuable item is tested at retrieval (i.e., probe frequency) or whether these manipulations yield independent effects. In exper-iment 1, probe value and probe frequency boosts were observed, although the two effects were addi-tive. This demonstrates that probe value boosts are not affected by probe frequency and that the manip-ulations have independent effects on performance. This latter finding was further supported by experi-ment 2, which indicated that probe frequency boosts are not reliant on executive resources during encod-ing and maintenance, unlike probe value effects.16 Taken together, these findings suggest that probe value and probe frequency encourage participants to direct attention in different ways.
rely on executive resources suggesting that boosts might occur in a cost-free and relatively automatic manner.28,29,32Effects are therefore unlikely to result from processes that rely on executive control, such as attentional refreshing.39–41Although speculative, one possibility is the item that is most likely to be probed is automatically tagged as being more important. This might occur because participants are told this item will be tested more frequently, or because they become explicitly or implicitly aware of this throughout the block of trials. The WM system might then respond to this information, with more goal-relevant items being held in the FoA automat-ically. Alternatively, probe frequency effects might not involve the FoA, and instead reflect a biasing at a different stage of WM. For instance, items that are tagged as being more goal relevant might be encoded with greater strength42 or prioritized for comparison with the probe at retrieval.5
Alternatively, the probe value and probe fre-quency manipulations may involve the same under-lying mechanism. Experiment 1 revealed additive effects when probe value and probe frequency were employed together, which we interpret as indicating the operation of independent underlying mecha-nisms. However, these outcomes might be expected if the manipulations involve the same mechanism, but neither fully saturate it. Instead of involving dis-tinct mechanisms, the probe value and probe fre-quency manipulations might therefore activate the same mechanism but in different ways. Experiment 2 would then indicate that activation of this mecha-nism is somewhat automatic when probe frequency is increased, but under more strategic control when probe value is manipulated. To delineate between these possibilities, it would be useful for additional research to further explore how the probe value and probe frequency manipulations differ and the cog-nitive mechanisms involved in both.
Regardless of the outcomes of this further research, the current findings have important impli-cations for the relationship between WM and atten-tion, suggesting that not all forms of attentional direction are functionally equivalent. Researchers should therefore avoid assumptions that differ-ent attdiffer-entional manipulations encourage partici-pants to direct attention in the same way, as this could result in inaccurate or erroneous conclusions. These findings may also have important practical implications, indicating that individuals can direct
attention to more important information in WM if they have prior knowledge regarding value or goal relevance. This might be particularly useful for everyday tasks that rely on WM, such as learning,2 skill acquisition,3and language comprehension.43It is important to note that the orientation of attention does not increase WM capacity, however, and that this might negatively affect memory for other items held within the system (but see Ref. 44).
In summary, these experiments suggest that the manipulation of probe value and probe frequency encourages participants to direct attention in dif-ferent ways. Although probe value effects appear to depend on executive resources during encod-ing and maintenance,16probe frequency effects do not. Taken together, these findings suggest that the manipulations may involve distinct underlying mechanisms, or at least activate the same mecha-nism in different ways, though further research is needed to fully explore this possibility.
Acknowledgments
The authors would like to thank Liam Hill for useful discussion, and Julia Walters, Flora Rees, Ben Hillier, Rachael Bull, Erin Funnell, Cather-ine Joyce, and Qandeel Shah for assistance with data collection. This research was supported by an Economic and Social Research Council PhD Dis-cipline Studentship to A.L.A. Grant ES/J500215/1 E.D.J.B. is jointly funded by the Bradford Institute of Health Research and the University of Leeds. Author contributions are as follows: experimental design: A.L.A., E.D.J.B., R.J.A., A.H.W., A.D.B., G.J.H.; pro-gramming of experiments: E.D.J.B.; data collection: A.L.A.; data analysis: A.L.A., E.D.J.B., R.J.A.; draft-ing of manuscript: A.L.A., E.D.J.B., R.J.A., A.H.W., A.D.B., G.J.H. A.L.A. and E.D.J.B. accept respon-sibility for the integrity of the data analyzed. The scripts used to run the tasks, the data, and the analysis script for both experiments are available at https://osf.io/cvftr/.
Competing interests
The authors declare no competing interests.
References
1. Cowan, N. 1988. Evolving conceptions of memory storage, selective attention, and their mutual constraints within the human information-processing system.Psychol. Bull.104:
2. Gathercole, S.E. & S.J. Pickering. 2000. Working memory deficits in children with low achievements in the national curriculum at 7 years of age.Br. J. Educ. Psychol.70:177– 194.
3. Woltz, D.J. 1988. An investigation of the role of working memory in procedural skill acquisition.J. Exp. Psychol. Gen. 117:319–331.
4. Oberauer, K. & L. Hein. 2012. Attention to informa-tion in working memory.Curr. Dir. Psychol. Sci.21:164– 169.
5. Souza, A.S. & K. Oberauer. 2016. In search of the focus of attention in working memory: 13 years of the retro-cue effect.Atten. Percept. Psychophys.78:1839–1860.
6. Heuer, A. & A. Schub¨o. 2016. The focus of attention in visual working memory: protection of focused representations and its individual variation.PLoS One11:e0154228.
7. Cowan, N. 1995. Attention and Memory: An Integrated Framework. New York, NY: Oxford University Press. 8. Cowan, N. 2001. The magical number 4 in short-term
mem-ory: a reconsideration of mental storage capacity.Behav. Brain Sci.24:87–185.
9. Cowan, N. 2005. Working Memory Capacity. Hove: Psychology Press.
10. Oberauer, K. 2002. Access to information in working mem-ory: exploring the focus of attention.J. Exp. Psychol. Learn. Mem. Cogn.28:411–421.
11. Astle, D.E., A.C. Nobre & G. Scerif. 2012. Attentional control constrains visual short-term memory: insights from devel-opmental and individual differences.Q. J. Exp. Psychol.65:
277–294.
12. Gunseli, E., D. van Moorselaar, M. Meeter & C.N. Olivers. 2015. The reliability of retro-cues determines the fate of noncued visual working memory representations.Psychon. Bull. Rev.22:1334–1341.
13. Pertzov, Y., P.M. Bays, S. Joseph & M. Husain. 2013. Rapid forgetting prevented by retrospective attention cues.J. Exp. Psychol. Hum. Percept. Perform.39:1224–1231.
14. Shimi, A., A.C. Nobre, D. Astle & G. Scerif. 2014. Orienting attention within visual short-term memory: development and mechanisms.Child Dev.85:578–592.
15. Hu, Y., G.J. Hitch, A.D. Baddeley,et al.2014. Executive and perceptual attention play different roles in visual working memory: evidence from suffix and strategy effects.J. Exp. Psychol. Hum. Percept. Perform.40:1665–1678.
16. Hu, Y., R.J. Allen, A.D. Baddeley & G.J. Hitch. 2016. Execu-tive control of stimulus-driven and goal-directed attention in visual working memory.Atten. Percept. Psychophys.78:
2164–2175.
17. Hitch, G.J., Y. Hu, R.J. Allen & A.D. Baddeley. 2018. Compe-tition for the focus of attention in visual working memory: perceptual recency versus executive control.Ann. N.Y. Acad. Sci.XXXX: XX-XX..
18. Berry, E.D.J., A.H. Waterman, A.D. Baddeley,et al.2018. The limits of visual working memory in children: exploring pri-oritization and recency effects with sequential presentation.
Dev. Psychol.54:240–253.
19. Gong, M. & S. Li. 2014. Learned reward association improves visual working memory.J. Exp. Psychol. Hum. Percept. Per-form.40:841–856.
20. Klink, P.C., D. Jeurissen, J. Theeuwes,et al.2017. Work-ing memory accuracy for multiple targets is driven by reward expectation and stimulus contrast with different time-courses.Sci. Rep.7:9082.
21. Infanti, E., C. Hickey & M. Turatto. 2015. Reward associa-tions impact both iconic and visual working memory.Vision Res.107:22–29.
22. Anderson, B.A., P.A. Laurent & S. Yantis. 2011. Value-driven attentional capture.Proc. Natl. Acad. Sci. USA108:10367– 10371.
23. Baddeley, A.D. 1986.Working Memory. Oxford: Oxford Uni-versity Press, Clarendon Press.
24. Barchard, K.A. 2015. Null hypothesis significance testing does not show equivalence.Anal. Soc. Issues Public Policy15:
418–421.
25. Mulder, J. & E.J. Wagenmakers. 2016. Editors’ introduction to the special issue “Bayes factors for testing hypotheses in psychological research: practical relevance and new devel-opments.”J. Math. Psychol.72:1–5.
26. R Core Team. 2016. R: a language and environment for statistical computing. Accessed Febuary 2, 2018 https://www.r-project.org/
27. Morey, R.D. & J.N. Rouder. 2015. BayesFactor: computation of Bayes factors for common designs. Accessed Febuary 2, 2018. http://bayesfactorpcl.r-forge.r-project.org/. 28. Hasher, L. & R.T. Zacks. 1979. Automatic and
effort-ful processes in memory.J. Exp. Psychol. Gen.108:356– 388.
29. Zacks, R.T. & L. Hasher. 2002. Frequency processing: a twenty-five year perspective. InFrequency Processing and Cognition. P. Sedlmeier & T. Betsch, Eds.: 21–36. New York, NY: Oxford University Press.
30. Attig, M.S. & L. Hasher. 1980. The processing of frequency information by adults.J. Gerontol.35:66–69.
31. Hasher, L. & W. Chromiak. 1977. The processing of fre-quency information: an automatic mechanism?J. Verbal Learning Verbal Behav.16:173–184.
32. Hasher, L. & R.T. Zacks. 1984. Automatic processing of fun-damental information: the case of frequency of occurrence.
Am. Psychol.39:1372–1388.
33. Nissen, M.J., D. Willingham & M. Hartman. 1989. Explicit and implicit remembering: when is learning preserved in amnesia?Neuropsychologia27:341–352.
34. Janczyk, M. & M.E. Berryhill. 2014. Orienting attention in visual working memory requires central capacity: decreased retro-cue effects under dual-task conditions.Atten. Percept. Psychophys.76:715–724.
35. Barrouillet, P. & V. Camos. 2014.Working Memory: Loss and Reconstruction. Psychology Press.
36. Barrouillet, P., S. Bernardin, S. Portrat, E. Vergauwe, & V. Camos. 2007. Time and cognitive load in working memory.
J. Exp. Psychol. Learn. Mem. Cogn.33:570–585.
37. Vergauwe, E. & N. Cowan. 2015. Attending to items in work-ing memory: evidence that refreshwork-ing and memory search are closely related.Psychon. Bull. Rev.22:1001–1006. 38. Vergauwe, E. & N. Langerock. 2017. Attentional refreshing
39. Camos, V., G. Mora & K. Oberauer. 2011. Adaptive choice between articulatory rehearsal and attentional refresh-ing in verbal workrefresh-ing memory. Mem. Cognit. 39:231– 244.
40. Jolicœur, P. & R. Dell’Acqua. 1998. The demonstration of short-term consolidation.Cogn. Psychol.36:138–202. 41. Oberauer, K. & S. Lewandowsky. 2013. Evidence against
decay in verbal working memory.J. Exp. Psychol. Gen.142:
380–411.
42. McElree, B. 2001. Working memory and focal attention.
J. Exp. Psychol. Learn. Mem. Cogn.27:817–835.
43. Daneman, M. & P.M. Merikle. 1996. Working memory and language comprehension: a meta-analysis. Psychon. Bull. Rev.3:422–433.