Int. J. Electrochem. Sci., 9 (2014) 81 - 95
International Journal of
ELECTROCHEMICAL
SCIENCE
www.electrochemsci.org
Influence of Calcination Temperature on the Structure and
Porosity of Nanocrystalline SnO
2Synthesized by a Conventional
Precipitation method
A. Gaber*, M. A. Abdel- Rahim, A. Y. Abdel-Latief, Mahmoud. N. Abdel-Salam Physics Department, Faculty of Science, Assiut University, Assiut 71516, EGYPT.
*
E-mail: [email protected]
Received: 24 August 2013 / Accepted: 9 October 2013 / Published: 15 November 2013
Tin dioxide nanocrystalline were synthesized by adding ammonia solution (NH4 OH) to a solution
containing tin chloride pentahydrate (SnCl4.5H2O). The obtained products have been characterized by
x-ray diffraction (XRD), scanning electron microscopy (SEM) and high resolution transmission electron microscopy (HRTEM). The results indicate that the crystallite size increases from 3.45 to 23.5 nm as the calcination temperature rises from 300oC to 1050oC. The XRD analysis exhibits a rutile tetragonal phase of the SnO2 nanocrystals. The crystallinity is developed due to a decrease of lattice
distortion ratio and dislocation density as the calcination temperature is increases. Surface area and porosity of SnO2 nanoparticles are measured. Specific surface area which is related to pore volume and
decreases from 140 m2/g at 100ºC to 8.3 m2/g at 1050ºC.
Keywords: nanocrystalline SnO2, XRD, Specific surface area, HRTEM
1. INTRODUCTION
Tin dioxide SnO2 is a very stable material which has tetragonal rutile structure [1, 2]. SnO2 in
nanometer scale have many advantages compared to its bulk materials. Tin oxide has many technological applications among them as catalysts for oxidation of organic compounds, solid state sensors, biomedicine, ceramics and transparent conductors [3, 4]. In the field of gas sensors, SnO2
nanoparticles are the most important material used in gas sensing applications. SnO2 performance,
nanoparticles is prepared by several methods as sonochemical method [10], laser decomposition reaction [11], sol- gel [12], two-step solid state reaction [13], spray pyrolysis [14], precipitation [15, 16], etc.
Precipitation method is the most common methods used for synthesis of tin dioxide nanparticles. The main factors, which affect the preparation of SnO2 nanoparticles by precipitation
method in terms of smaller and more dispersed particles, are temperature and pH [2].
The aim of this article is to characterize the nanocrystalline tin dioxide synthesized by the conventional precipitation method. The effect of calcination temperature on the crystallite size, lattice distortion ratio, and dislocation density has been characterized. Specific surface area, pore size distribution, and activation energy of sintering of SnO2 nanoparticles calcined at various temperatures
have been evaluated by N2 adsorption using Brunauer, Emmet and Teller (BET); Barrer, Joiyner and
Halenda (BJH) and t-plot methods.
2. EXPERIMENTAL PROCEDURE
2.1. SnO2 sample preparation
Nanocrystalline tin oxide (SnO2) was prepared by conventional precipitation method, by
adding ammonia solution NH3.H2O 30 % drop wise to 0.05M aqueous solution of SnCl4.5H2O at 40°C.
The pH of the mixed solution was adjusted at 8 to obtained white precipitate of tin hydroxide. The product was separated using a centrifuge operating at 3000 rpm for 20 min. The white gel was washed with deionized water and ethanol several times to remove chlorine ions. The resulting product was dried for 24 h at 100oC in drying oven. The dried powder has been ground in a mortar and finally calcined at different temperatures in a muffle furnace for 2 h in the temperature range 300 - 1050 oC.
2.2. Samples Characterization
The crystal structure of all samples characterized at room temperature using a Philips PW1700 X-ray diffractometer (operated at 40 kV and current of 30 mA) and samples were scanned between 20o and 90o at a scanning speed of 0.06 oC/s using Cu Kα radiation with λ = 1.5418Å. (SEM) (JEOL JSM-5400 LV) used to examine the surface morphology of particles. (HRTEM) and selected area electron diffraction (SAED) performed using a JEOL JEM-2100 (operating voltage = 200KV and beam current = 102µA) were used to examine the size and shape of particles. Porosity and specific surface area of SnO2 nanoparticles calcined at various temperatures measured by N2 adsorption using (BET), (BJH)
3. RESULTS AND DISCUSSIONS
3.1. Dependence of crystallite size, crystal lattice distortion and dislocation density on the calcination temperature:
The analysis of the structure and size determination of SnO2 nanocrystals were carried out by
using modified Scherrer equation in the form [17]
where β is defined as β = (β2
observed – β2instrumental) 1/2 (in radians), k is the shape factor equals to
0.89, λ is the X-ray wave length for Cu kα radiation (λ =1.5418 Å), θ is the Bragg diffraction angle (in degrees) and β is the full width at half maximum (FWHM) of the observed peak which is corrected by considering the instrumental broadening of the standard Si.
20 30 40 50 60 70 80 90 T=100C
2deg.)
In
te
ns
ity
(a
. u
.)
T=300C T=450C T=600C T=750C T=900C T=1050C 211
[image:3.596.187.415.300.591.2]200 101 110
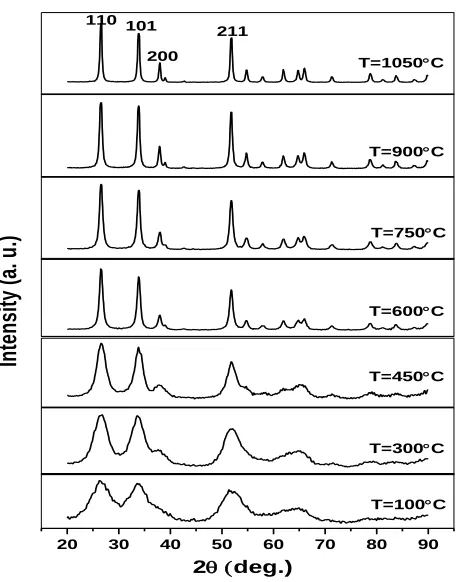
Figure 1. Shows the XRD charts of the calcined samples at different temperatures,
The representative XRD charts, Fig1, of dried sample (100°C) and samples calcined in the range of 300°C to 1050°C. Miller indices provided in the figure and all peaks determine transformation of dried powder to SnO2 crystallites with tetragonal rutile crystal structure. In addition,
the number of reflection increases with increasing of the calcination temperature but the degree of crystallinity does not change after 600°C indicating fully crystalline SnO2 nanopowders. Table 1,
Table 1. The crystallite size, lattice parameter, dislocation density and number of cells in SnO2
nanoparticles.
Temp. (ºC) 100ºC 300ºC 450ºC 600ºC 750ºC 900ºC 1050ºC
Crystallite size (nm) 2.9 3.45 5.4 13.3 14.4 18.4 23.54 Miller indices (hkl) 110
101 211 110 101 211 110 101 211 110 101 211 110 101 211 110 101 211 110 101 211 d-spacing 3.391
2.667 1.779 3.383 2.667 1.756 3.348 2.656 1.763 3.354 2.645 1.764 3.353 2.645 1.764 3.356 2.647 1.765 3.353 2.646 1.764
a (Å) 4.795 4.709 4.734 4.743 4.74 4.74 4.746
c (Å) 3.22 3.24 3.21 3.19 3.187 3.187 3.188
Unit volume (Å3
) 74.04 71.84 71.95 71.86 71.62 71.62 71.84 Lattice distortion 0.013 0.0114 0.0079 0.0032 0.0029 0.0025 0.0018
Dislocation density(lines/m2)
×1015
122 89.1 35.6 5.65 4.82 2.95 1.8
Number of unit cell (×103
)
0.165 0.3 EWEEE 1.08 17 45.5 90
0 150 300 450 600 750 900 1050 1200 0.0 0.5 1.0 1.5 2.0 2.5 3.0 3.5 F W H M i n ( D e g .)
temperature (C)
(110) plane (101) plane (200) plane (211) plane
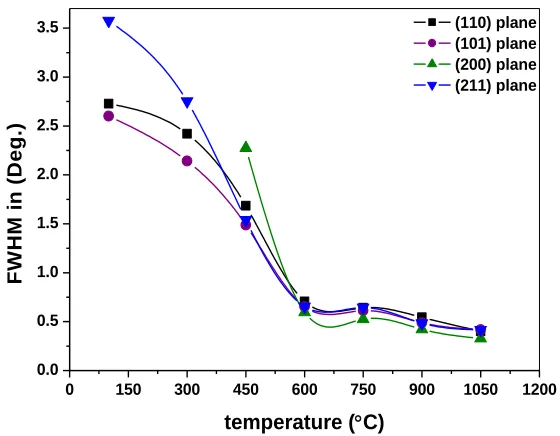
Figure 2. Dependence of the FWHM of (110), (101), (211) and (200) planes on the calcination temperature
[image:4.596.62.535.108.460.2] [image:4.596.158.438.504.722.2]
150 300 450 600 750 900 1050 5
10 15 20 25
C
r
y
s
ta
ll
it
e
s
iz
e
(
n
m
)
[image:5.596.156.444.74.359.2]Temperature C
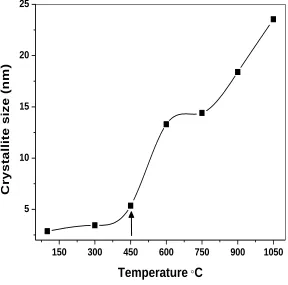
Figure 3. Dependence of the crystallites growth on the calcination temperature.
Fig. 2, shows the relation between the broadening of highest intensity planes (110), (101), (211) and (200) and calcination temperatures used to estimate the average crystallite size.
On the other hand, it's noticed that the width of peaks decreases with increasing of the calcination temperatures due to growth of crystals and construction to larger clusters. The crystallite size increases with increasing the calcination temperature. Fig. 3, describes the slow increase of crystallite size in the early stage of calcination from 100°C - 450°C related to presence of water molecules and hydroxyl groups which is confirmed by TGA and DTA results (presented elsewhere) prevent rapid growth of crystals. Above 450°C the crystal growth increases rapidly with increasing in the calcination temperature which can be ascribed by more agglomerated crystals.
The crystal lattice distortion ratio of SnO2 nanoparticles at different calcination temperatures
calculated by using the following equation [18, 19]
(2)
The parameters θ, β and are defined earlier, (ε2)1/2 is the crystal lattice distortion ratio. According to modified Scherrer equation (1) and equation (2), it can be deduced the lattice distortion ratio using equation (3) in the form [19].
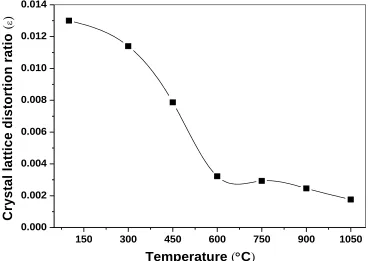
Fig.4. describes the relation between lattice distortion ratios determined using (110) plane from XRD line broadening and calcination temperatures.
150 300 450 600 750 900 1050 0.000
0.002 0.004 0.006 0.008 0.010 0.012 0.014
C
ry
s
ta
l
la
tt
ic
e
d
is
to
rt
io
n
r
a
ti
o
(
)
Temperature (C)
Figure 4. Relations between crystal lattice distortion ratio and calcination temperature of SnO2
nanoparticles.
In this figure it can be noticed a decrease in lattice distortion ratio with increasing the calcination temperature. This result can be explained as follows; when the temperature increases, it leads to a decrease in defect concentration by decreasing in the proportion of surface atoms. It also improves the degree of crystallization in SnO2 nanoparticles [18-20]. The dislocation density (δ) and
number of unit cells (n) of SnO2 nanoparticles is calculated and listed in table (1) using the relation
[21-23].
δ = 1 / D2
(4) n = π D3 / 6 V (5)
where D is the crystallite size and V is the unit volume. Dislocation density decreases and the number of unit cells increases with increasing in the calcination temperatures that leads to increase the crystal growth and decreasing the defects in crystallites.
3.2. Scanning electron microscope (SEM)
[image:6.596.114.483.136.397.2][image:7.596.105.490.162.442.2]
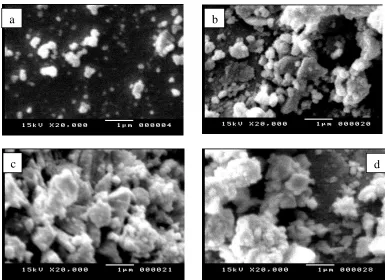
wide size distribution. After calcination from 750°C - 1050°C, Fig (5-b, c and d), the morphology of the specimen surface changes obviously with increasing the average particles size and more agglomeration occurs among particles. On the other hand, all particles exhibit a spherical shape with a high degree of agglomeration among fine particles. Therefore, one cannot measure the particles size.
Figure 5. SEM micrograph of the surface of SnO2 nanocrystals at different temperature a) as
prepared powder, b) T=750 ºC, c) T=900 ºC and d)T=1050 ºC respectively.
3.3. High resolution transmission electron microscope (HRTEM)
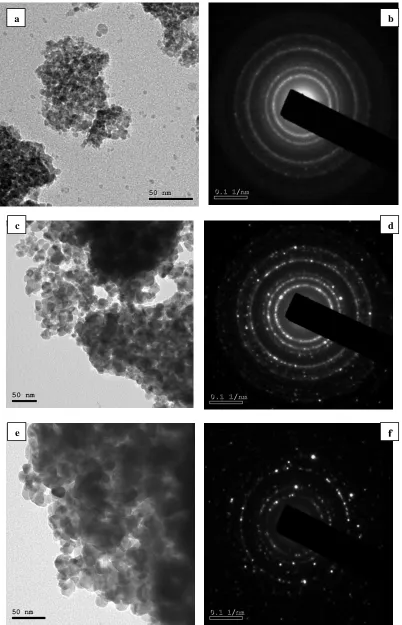
The micro- structure of the SnO2 nanoparticles calcined at 450 ºC, 600 ºC, and 750 ºC, are
investigated by HRTEM. The micrographs in Fig (6) show the nanoparticles appear as spheres with uniform size as the calcination temperature increased. The average particle size increases as a function of temperature. Furthermore, the HRTEM results confirm the XRD results that show the nanoparticle size is dependent on the calcination temperature. It is clearly shown that the SnO2 particles has a high
degree of agglomeration caused by mutual interaction between particles which arises from some forces such as van der – walls forces, capillary forces and electrostatic forces [24, 25]. Furthermore, adding ammonia solution directly leads to complete the nucleation and growth in a few seconds that affects on agglomeration of particles. The agglomerated particles have regular distribution and the shapes of particles are, to some extent, similar and homogenous.
a b
d c
Figure 6. HRTEM images and SAED of SnO2 nanocrystals calcined at different temperatures a, b) T
= 450 ºC, c, d) T = 600 ºC, e, f) T = 750 ºC.
a b
c d
The selected area electron diffraction (SAED) patterns of tin oxide nanocrystals calcined at different temperatures characterized by diffraction rings with discrete spots which indicate that tin oxide is fully crystalline with polycrystalline nature which is in good agreement with the XRD patterns of tin dioxide nanocrystals
3.4. Porosity and surface area of tin dioxide (SnO2) nanoparticles 3.4.1. N2 adsorption / desorption for tin dioxide (SnO2) nanoparticles:
0.0 0.2 0.4 0.6 0.8 1.0 1.2
0 35 0 30 0 30 0 15 0 10 0 100 10
P/ Po
A1,T=100C A2,T=300C A3,T=450C A4,T=600C
V
o
lu
m
e
a
d
s
o
rb
e
d
a
t
S
T
P
(c
c
/g
)
[image:9.596.190.410.220.538.2]A5,T=750C A6,T=900C A7,T=1050C
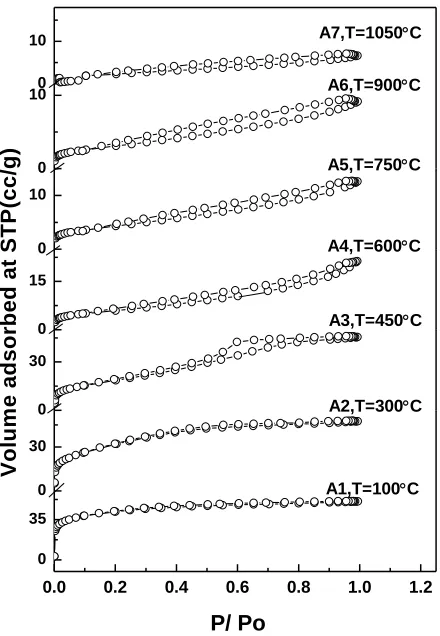
Figure 7. Nitrogen adsorption/ desorption isotherms of SnO2 nanoparticles
N2 adsorption / desorption for tin dioxide nanoparticles synthesized by conventional
precipitation method has been carried out. Figure 7, shows the isotherm curves for dried sample and samples calcined in the temperature range 300˚C- 1050˚C. In the dried sample A1 and sample A2 calcined at 300˚C, the curves illustrate the samples have similar type I adsorption isotherm behaviors with H4 type of hysteresis loops according to the IUPAC classifications [26, 27]. This type of adsorption isotherm is related to microporous solids, and the hysteresis loop is often associated with narrow slits like pores as a result of agglomerates or aggregates of particles forming slit pores with uniform size and shape [26, 28].
isotherm determined that the samples are free of micropores with a high energy of adsorption. In addition, the hysteresis loops for these samples are H4 which means that the material is often associated with narrow slit- like pores as in the previous two samples A1, A2. In contrast, the sample A3 calcined at 450˚C shows the similar IV isotherm classification with H4 of hysteresis loop [26, 28]. This type is characteristic of mesoporosity material with uniform size and shape of pores. The results indicate decreases of the adsorbed volume with increasing the calcination temperature, which leads to decreasing in specific surface area.
3.4.2. Specific surface area and total pore volume of tin dioxide (SnO2) nanoparticles:
150 300 450 600 750 900 1050 0 20 40 60 80 100 120 140 160 0.00 0.01 0.02 0.03 0.04 0.05 0.06 0.07 0.08 A samples
S
BETcalcination temperature
(
C
)to ta l p o r e v o lu m e ( cc g -1 ) S B E T ( m 2 g -1 )
t.p.v
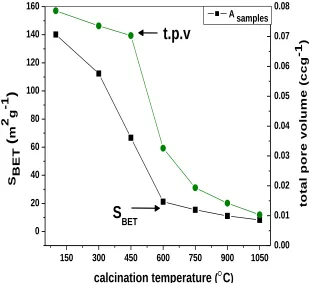
Figure 8. Changes in the specific surface area and total pore volume for the samples calcined at various temperatures.
The relation between specific surface area of the samples calcined at different temperatures and total pore volume illustrated in Fig 8. It’s notable that the total pore volume (t.p.v) and specific surface area (SBET) for samples decrease with increasing in the calcination temperature due to increasing the
particle size and degree of agglomeration by the effect of sintering occurring in the material [3]. Furthermore, this result shows a sharp decrease in specific surface area for samples in the temperature range 450˚C to 750˚C due to elimination of ammonia and chemically bonded water during development tin hydroxide to pure tin oxide [3, 16, 29-30]. A bove 750˚C, SBET decreases gradually.
The specific surface area of the samples decreases from 112.4 m2/g at 300˚C to 8.3 m2/g at 1050˚C. The high surface area of SnO2 at low calcination temperatures lower than 450˚C suggests small size of
[image:10.596.145.456.246.529.2]
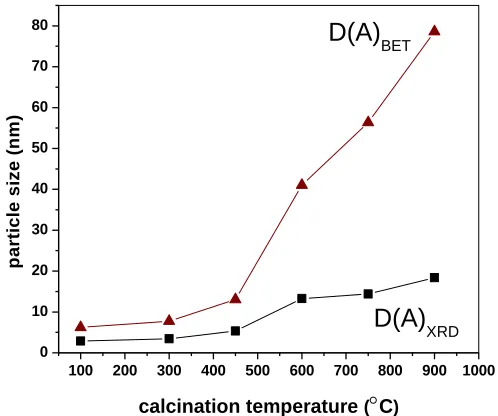
Assuming that the particles have spherical – shape and uniform size, the average particle size can be estimated by (BET) equation in the form [12].
(6)
where D is the average particle size in nm, ρ is the theoretical density of tin dioxide nanoparticles ( 6.95 gm/cm3 ) and A is the specific surface area at corresponding temperature in m2/g .
100 200 300 400 500 600 700 800 900 1000 0
10 20 30 40 50 60 70
80 D(A)
BET
p
a
rt
ic
le
s
iz
e
(
n
m
)
calcination temperature (C)
[image:11.596.174.423.236.444.2]D(A)XRD
Figure 9. Variations of crystallite size calculated by XRD and particle size calculated from BET as a function of calcination temperature.
1.2 1.1 1.0 0.9 0.8 0.7
0.9 1.0 1.1 1.2 1.3 1.4
lo
g
(
SB
E
T
)
1000/T(k-1)
[image:11.596.185.412.518.700.2]
In order to compare between the average crystallite size estimated by XRD and the average particle size estimated by BET, given in Fig 9, the results are in fair agreement in the low temperatures (lower than 450°C) due to high surface area and smaller particle size. But in contrary, the average particle size calculated by BET is larger than the crystallite size calculated by XRD when the calcination temperature rises from 450°C to 1050°C. The results are inconsistent because aggregates and/ or agglomerates of crystals due to increasing the calcination temperature. These results indicate that the particles contain several crystallites [31].
Fig. 10, shows the determination of the activation energy of sintering (ΔEs) for samples
calcined from 600°C to 1050°C. ΔEs can be deduced from the data of SBET as a function of calcination
temperature. The relation between ΔEs and SBET given by the equation [32]
SBET = A exp (ΔEs /RT) (7)
where A is a constant and ΔEs is the approximate activation energy of sintering determined by
plotting log SBET versus 1/T. The activation energy of sintering calculated from the slope of the
straight line equals to 19.9 kJ/mol. The dried sample and samples calcined at temperatures lower than 600°C are containing water molecules and hydroxyl groups that lead to prevent the increase in the rate growth and sintering of the particles.
3.4.3. Nature of porosity in SnO2 nanoparticles
Table 2. Specific surface area, pore size distribution and particle size of SnO2 nanoparticles calcined at
the indicated temperatures.
Temp.(°C) SBET(m2/g) APD (nm) TPV(nm) DBET(nm)
100 140.17 2.243 0.0786 6.2
300 112.38 2.617 0.0735 7.7
450 66.73 4.215 0.0703 13
600 21.19 6.157 0.0326 41
750 15.43 5.012 0.0193 56.4
900 11.06 5.129 0.0142 78.6
1050 8.32 4.967 0.0103 103.7
SBET (m2/g): specific surface area. APD (nm): average pore diameter, TPV (nm): total pore volume,
DBET (nm): particle size calculation by BET equation
0 20 40 60 80 100 120
0 125 0 200 0 250 0 35 0 25 0 25 0 20 40
pore diameter (nm)
A1, T=100C A2, T=300C A3, T=450C A4, T=600C A5, T=750C A6, T=900C
p o re v o lu m e ( c c /g )
BJH dV/d[logD] (Desorption)
[image:13.596.185.414.68.379.2]A7, T=1050C
Figure 11. Pore size distribution of SnO2 nanoparticles calcined at different temperatures.
0 7 14 21
0.00 0.05 0.00 0.05 0.00 0.05 0.00 0.03 0.00 0.02 0.00 0.01 0.00 0.01
Statistical Thickness t (Å)
A d s o rb e d V o lu m e ( c c /g )
A1,T=100C A2,T=300C A3,T=450C A4,T=600C A5,T=750C A6,T=900C A7,T=1050C
t-Method- de Boer (Adsorption)
[image:13.596.191.409.432.737.2]
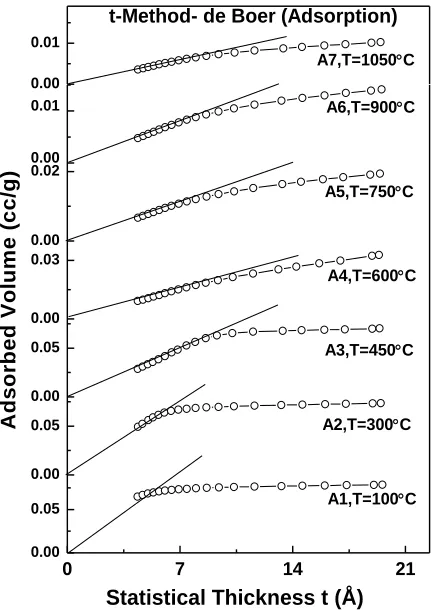
On the other hand, by using the shape of the V- t plot it can be determined the type of existing porosity. Downward deviation determines microporosity while the upward deviation indicates the existence of mesoporosity [33].
From Fig 12, all samples exhibit downward deviations which indicate a micropores nature of pores. These results indicate that the calcination temperature for the samples and the preparation method of tin dioxide nanparticles have no major effect on the nature of pores. The mentioned above indicate that the BJH method and t- plot method determine the nature of pores in our materials as micropores with little mesopores.
4. CONCLUSIONS
From the study of SnO2 nanoparticles the following conclusions can be drawn:
1. The crystallite size is calcination temperature dependent. The crystallite size of the samples increased from 3.45 to 23.5 nm when the calcination temperature increases from 300 to 1050°C respectively.
2. The crystallinity of SnO2 nanoparticles might be improved by decreasing the lattice distortion
and dislocation density with increasing calcination temperature.
3. The SEM examinations reveal that when the calcination temperature increases the agglomeration of non uniform particles increases.
4. HRTEM indicates a dependence of particle size and the shape on the calcination temperatures. The particle size increases and has a higher degree of agglomeration as the calcination temperature increase.
5. Specific surface area of SnO2 nanoparticles lays in the range 140.17 m2/g to 8.32 m2/g as the
calcination temperature rises from 100˚C to 1050˚C.
6. Specific surface area of SnO2 nanoparticles is related to pore volume and decreased by
sintering of pores to smaller pores.
7. Pore size distribution measured by BJH and t-plot methods indicates that the nature of pores in SnO2 nanoparticles is a collection of micropores with a very little mesopores.
References
1. V. Balzani, Small, 3 (2005) 278.
2. H. Taib. Ph.D. School of Materials Science and Engineering, Faculty of Science, University of New South Wales (2009).
3. J.A. Toledo-Antonio, R.G. Baez, P.J. Sebastian and A. Vazquez, J. Solid State Chem., 174 (2003) 241.
4. M. Batzill and U. Diebold, Prog. Surf. Sci., 79 (2005) 47. 5. N. Yamazoe, Sens. and Actuators B: Chem., 5 (1991) 7.
6. C. Xu, J. Tamaki, N. Miura and N. Yamazoe, Sens. and Actuators B: Chem., 3 (1991) 147. 7. G. Zang and M. Liu, Sens. and Actuators B: Chem., 69 (2000) 144.
9. S. Fujihara, T. Maeda, H. Ohgi, E. Hosono, H. Imai and S.-H. Kim, Langmuir, 20 (2004) 6476. 10. J. Zhu, Z. Lu, S.T. Aruna, D. Aurbach and A.Gedanken, Chem. Mater., 12 (2000) 2557.
11. M. Ocana and E. Matijevic, J. Mater. Res.,5 (1990) 1083. 12. J. Zhang and L. Gao, J. Solid State Chemi., 177 (2004) 1425.
13. F. Li, L. Chen, Z. Chen, J. Xu, J.Zhu and X. Xin, Mater. Chem. Phys., 73 (2002) 335. 14. J.H. Lee and S. J. Park, J. Am. Ceram. Soc., 76 (1993) 777.
15. H. Taib and C. C. Sorrell, J. Aust. Ceram. Soc., 43(1) (2007) 56. 16. Ki.C.Song and Y. Kang, Mater. Lett., 42 ( 2000) 283.
17. M.-M. B. Mohagheghi, N. Shahtahmasebi, M.R. Alinejad, A. Youssefi and M.S. Saremi, Physica B, 403 (2008) 2431.
18. S. Gao, L. Pang, H. Che and X. Zhou, China Particuology, 2 (2004) 177. 19. X. Zhong, B. Yang, X. Zhang , J. Jia and G. Yi, Particuology, 10 (2012) 365.
20. Y. Fen, X. Zhang, W. Xu, T. Fang and F. Gan, Trans. of Nonferrous Metals Soc. of China, 17 (2007) 626.
21. R. Renugadevi, T. Venkatachalam and R. Narayanasamy, Int. J. Chem. and Analytical Sci., 3 (2012) 1648.
22. V. Senthilkumar, P. Vickraman, J. J. Prince, M. Jayachandran and C. Sanjeeviraja, Philo. Maga. Lett., 90 (2010) 337.
23. A. Ayeshamaariam, C. Sanjeeviraja and M. Jayachandran, Int. J. Chem. and Analytical Sci., 2(6) (2011) 54.
24. R.J. Pugh and M. BergstrÖm,Surface and Colloid Chemistry in Advanced Ceramics Processing, Marcel Dekker, New York, (1994) 273.
25. L. M. Cukrov, P. G. McCormick, K. Galatsis and W. Wlodarski, Sens. and Actuators B: Chem., 77 (2001) 491.
26. S. J. Gregg and K.S. W. Sing, Adsorption, Surface area, and porosity. Academic Press, London, 2nd. Ed (1982).
27. K.S.W. Sing, D.H. Everette, R.A.W. Haul, L. Moscou, R.A. Pierotti, J. Rouquerol and T. Siemieniewska , Pure and Appl. Chem., 7 (1985) 603.
28. G. Leofanti, M. Padovan, G. Tozzola and B. Venturelli, Catal. Today, 41 (1998) 207. 29. K.C. Song, J.H. Kim and J. S. Sung, J. Korean Inst. Chem. Eng., 35 (1997) 457.
30. T. Furusaki, J. Takahashi, H. Takaha and K. Kodaira, J. Ceram. Soc. Jpn., 101 (1993) 451. 31. 31. N. Sergent, P. Gélin, L. Périer- Camby, H. Praliaud and G. Thomas, Sens. and Actuators B:
Chem., 84 (2002) 176.
32. H.G. El-Shobaky, M. Mokhtar and G.A. El-Shobaky, Appl. Catal. A: General, 180 (1999) 335. 33. A. M. Alian, Surface properties and catalytic activites of molybdenum oxide supported on
nano-hydroxyapatite catalysts. PhD. Al-Azhar University, Assuit, Egypt (2011).