Int. J. Electrochem. Sci., 11 (2016) 4442 – 4469, doi: 10.20964/2016.06.71
International Journal of
ELECTROCHEMICAL
SCIENCE
www.electrochemsci.orgReview
Electrochemical Methods of Real Surface Area Determination of
Noble Metal Electrodes – an Overview
M. Łukaszewski1
, M. Soszko2, A. Czerwiński1,3 ,*
1
Warsaw University, Department of Chemistry, Pasteura 1, 02-093 Warsaw, Poland
2
Industrial Chemistry Research Institute, Rydygiera 8, 01-793 Warsaw, Poland
3
Faculty of Chemistry, Biological and Chemical Research Centre, University of Warsaw, Żwirki i Wigury 101, 02-089 Warszawa
*
E-mail: aczerw@chem.uw.edu.pl
Received: 1 March 2016 / Accepted: 3 April 2016 / Published: 4 May 2016
The electrochemical methods of real surface area determination of noble metal electrodes and their alloys are summarized. These methods utilize hydrogen adsorption, surface oxide reduction, double layer capacitance, adsorbed carbon monoxide stripping and underpotential deposition of metals. The principles, advantages and limitations of the methods are discussed. The examples of their use are shown. The comparison between various methods is presented.
Keywords: Real surface area; Noble metals; Alloys; Electrodes; Adsorption
1. INTRODUCTION
palladium is an efficient hydrogen absorber [37] and is treated as a model system for other hydrogen-absorbing materials [38]. The examination of the behavior of the palladium-hydrogen systems allows us to understand better the processes occurring in other metal-hydrogen systems, which are utilized in many fields of science and technology, e.g. in Ni-MH cells [38] or as hydrogen storage materials [39].
One of the most important parameters characterizing the surface of solid electrodes is the real surface area (RSA) [40-42]. In contrast to liquid electrodes (i.e. mercury), the surface of a solid electrode is always not smooth and its real area exceeds the geometric one [40]. In the case of electrocatalytic materials the RSA may be even 1000 times greater that the geometric area [43] and differs for different electrodes. The ratio between the real and geometric area is called “roughness factor”, RF. Since the catalytic processes occur on surface active centers, all the extensive quantities
obtained in an experiment, such as electric current, electrode reaction rates and other interfacial parameters have to be normalized with respect to the RSA. Therefore, the precise knowledge on the value of RSA is crucial for the comparison of the behavior and activity of various catalytic systems examined in various laboratories. The possibility of the RSA monitoring during the experiment is also important under conditions where the experiment itself may alter the electrode surface state [41]. By measuring the loss of the catalyst active area one can check the catalyst durability during its operation, e.g. in a fuel cell [44].
Numerous methods of the RSA determination for various materials have been summarized by Trasatti and Petrii [40]. In this review we limit to the in situ methods of the RSA determination of polycrystalline noble metal electrodes and their alloys in acidic environment. We purposely limit our discussion to polycrystalline materials due to their high practical importance in electrochemcial power sources.
Under the term “RSA” we mean the true, electrochemically active surface area (ECSA). We characterize the main procedures based on such electrochemical phenomena as hydrogen adsorption, surface oxide reduction, double layer capacitance, adsorbed CO stripping and underpotential deposition of metals. The principles, advantageous and limitations of these methods are discussed and the comparison between various methods is made. We believe that a careful systematisation in this field is required and hope that our paper may help other researchers in the choice of a proper method of the RSA determination for the materials studied.
[image:3.596.165.418.122.331.2]
2. HYDROGEN ADSORPTION
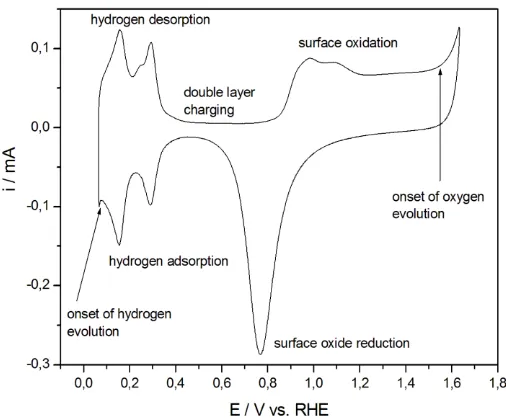
Figure 1. Cyclic voltammogram (scan rate 0.1 V s–1) recorded for a polycrystalline Pt electrode in 0.5 M H2SO4 (temperature 298 K).
Fig. 1 presents a cyclic voltammetric curve for a polycrystalline Pt electrode in 0.5 M H2SO4.
Its well-known course has been widely discussed in the literature [41]. Three potential ranges can be distinguished here, namely:
a) a region of hydrogen adsorption/desorption (so-called “hydrogen region”)
b) a region of surface oxide formation/reduction (so-called “oxygen” or “oxide region”) c) a region free from faradaic processes (so-called “double layer legion”)
The most important facts concerning the electrochemistry of a Pt electrode in the hydrogen region can be summarized as follows:
1) Hydrogen adsorption on Pt starts at potentials positive to the reversible potential of the H+/H2 redox couple, preceding the process of molecular hydrogen evolution, therefore it can be
regarded as a particular case of underpotential deposition phenomenon (UPD);
2) The process is fast and electrochemically reversible, the equilibrium surface coverage depends on electrode potential;
3) Various forms of adsorbed hydrogen are observed, namely the strongly and weekly adsorbed H species.
adsorption on Au electrode (only 2-4% of a monolayer [41]) also excludes the applicability of this method of the RSA determination for that metal. Although ruthenium adsorbs hydrogen, in that case the hydrogen region is overlapped with the oxygen adsorption region [47-51], which prevents the possibility of utilizing both these processes for the RSA determination. Moreover, Green and Kucernak [52] showed that the total charge in the hydrogen region does not refer to the adsorption process only because ruthenium can absorb some amounts of hydrogen and store it in the subsurface layers.
For Pt, Rh and Ir the charge consumed in adsorbed hydrogen oxidation, measured by the integration of the voltammetric peaks in the hydrogen region or by chronopotentiommetry, can be recalculated into the value of the RSA, according to the equation:
RSA = QHox / (H QHox, ML,S) (1)
where QHox is the measured charge due to the oxidation of adsorbed hydrogen for a given
cathodic vertex potential, H is the surface coverage with adsorbed hydrogen at that potential and
QHox,ML,S is the charge due to oxidation of a monolayer of adsorbed hydrogen per unit area. Bett et al.
[53] as well as Sobkowski and Umiński [54] have found from the charge needed for adsorbed hydrogen oxidation and BET measurements that for platinum black one hydrogen adsorption center (a platinum atom) adsorbs one hydrogen atom.
Usually, the charge due to the anodic process of hydrogen desorption is used instead of the cathodic adsorption charge. In an ideal case both these values should be the same, however, some differences of the order of ca. 10% are observed [48, 55-57]. The cathodic charge is more difficult to estimate due to overlapping with the onset of hydrogen evolution [55]. Sometimes, the average between adsorption and desorption charges was used for the RSA calculation [1].
This method assumes that one hydrogen atom can be adsorbed on a single Pt surface center and a total charge transfer occurs between the adsorbing hydrogen and the metal surface [40, 41, 58]. The value of QHox,ML,S can be calculated on the basis of surface atom density of a given metal and for
polycrystalline electrodes it is an averaged values for various crystal planes. Commonly, an equal distribution of the three low-index planes, i.e. (100), (111) and (110) is assumed. However, in real conditions, different polycrystalline samples may differ in respect of the distribution of the various planes on the surface. The accepted values of QHox,ML,S for polycrystalline Pt, Rh and Ir are
210 C cm-2, 221 C cm-2 and 218 C cm-2, respectively. In the case of Pt, this value corresponds to the surface atom density of 1.31·1015
cm-2 [40, 41].
There were also attempts to separate hydrogen adsorption and evolution contributions by extrapolating the hydrogen charge to infinite scan rate [59, 60]. Using ac techniques it is possible to separate adsorption and evolution components by analyzing the frequency dependence [41].
For voltammetric polarization to the current minimum potential just before the onset of hydrogen evolution, the H values given in the literature for Pt, Rh and Ir are 0.77, 0.59 and 0.65,
respectively [41]. The fact of an incomplete surface coverage with adsorbed hydrogen should be emphasized. However, quite many authors [48, 52, 56, 61-71] do not take it into account and ascribe the measured hydrogen desorption charge to a full monolayer, using the conversion factor equal to QHox,ML,S without the correction for the fractional H value. Such a calculation leads to the
underestimation of the RSA.
According to Jerkiewicz [72], the value of QHox,ML,S cannot be treated as a firm constant for all
types of Pt electrodes. Up to now the role of corner and edge atoms in hydrogen adsorption is not sufficiently understood. These factors are particularly important in the case of nanoparticles. Jerkiewicz concludes that it is still unclear whether the conversion factor of QHox,ML,S for
polycrystalline Pt can be used for the RSA determination of Pt nanoparticles [72]. The possibility of the underestimation of the RSA of small Pt nanoparticles when calculated from hydrogen adsorption charge was also raised by Maillard et al. [73].
Another important problem concerns the correction of the measured charge for the double layer charging contribution. Typically, the value of capacitive current flowing in the double layer region is subtracted from the total oxidation current measured in the hydrogen region [40, 41, 58, 67, 69, 71, 74, 75, 76]. This is an arbitrary procedure based on an assumption that double layer charging current is constant over the entire hydrogen region, i.e. the double layer capacity is not changed in the presence of adsorbed hydrogen and does not depend on surface coverage with hydrogen. It is also assumed that the current present in the double layer region has no faradaic contributions.
In principle, the capacitive current in potentiodynamic measurements may be eliminated by applying staircase voltammetry, where the current is probed at the end of the potential step [77, 78]. Under these conditions the double layer charging current is negligible and the measured current originates from faradaic processes only. However, this approach cannot be used for hydrogen adsorption measurements. Since hydrogen adsorption is very fast, it starts from the very beginning of the potential step and rapidly decays in time. Therefore, the current measured after some time delay is significantly underestimated [78].
In order to obtain reliable RSA measurements, the process of hydrogen adsorption cannot be disturbed by any other competitive adsorption processes. High purity of the electrode and solution is needed. Therefore, the electrolyte must be free from any surface poisons like halide ions, sulfur or traces of carbon oxides [79, 80]. The effect of the ion adsorption from supporting electrolyte also occurs but it is inevitable, thus H adsorption charge contains contribution from ion adsorption [48], which is different in different electrolytes. The solution has also to be deoxygenated to eliminate oxygen reduction reaction.
that hydrogen adsorbate can be completely removed from the surface and it usually does not alter the surface state of the electrode. However, in some cases the contact of electrode surface with hydrogen may lead to significant changes. In the literature one can find reports on the phenomenon of surface segregation of Pd-Ag alloys after hydrogen treatment, leading to alloy surface enrichment with Pd [81]. Also, for other Pd alloys hydrogen electrosorption coupled with absorption may lead to the changes in the surface roughness and the stability of the surface oxides [82,83].
It should be noted that the number of surface centers determined from hydrogen adsorption measurement corresponds to the number of the centers able to bond hydrogen. Since hydrogen atom is the smallest adsorbate, the RSA determined from hydrogen adsorption is the maximum surface area accessible for adsorption [41, 44]. For larger molecules the accessible area will be smaller [62]. Moreover, it was suggested that the number of readily accessible surface sites for Pt is ca. 92% of a total number of sites [41].
In the case of the alloys between Pt and Rh the method of the RSA determination based on hydrogen adsorption can still be applied. The following equation has been proposed for the Pt-Rh system [84]:
RSA = QHox / [(xPt · 210 + xRh · 220) (xPt · 0.77 + xRh · 0.59 )] (2)
where xPt and xRh are atomic fractions of the metals on the alloy surface. Thus, it was assumed
that alloy adsorption properties towards hydrogen are intermediate with respect to those of pure metals, being a linear function of the alloy surface composition. Therefore, for the RSA determination the surface composition of the Pt-Rh alloy should be known.
As in the case of Pd, the RSA of Pt and Rh alloys with Pd cannot be determined from hydrogen adsorption charge. Some attempts have been made to separate hydrogen adsorption and absorption currents for those Pd alloys, which contain low concentration of Pd and therefore absorb small amounts of hydrogen [85]. The multiple currents in the hydrogen region were deconvoluted in a computer program and the peaks placed at higher potentials were ascribed to adsorbed hydrogen while those at lower potentials were attributed to absorbed hydrogen. The results were used for the calculation of surface coverage with carbon oxides adsorption products [85]. However, the comparison with the results with other techniques of the RSA determination led to the conclusion that such a procedure can give only an estimation of the RSA and cannot be utilized for more accurate measurements.
Czerwiński [86, 87] observed that during a decrease in the RSA of a Pd electrode the charge under a smaller hydrogen peak, placed at higher potentials, alters proportionally to the change in the RSA and its change is approximately a half of the difference in the surface oxide reduction charge. Therefore, it was suggested that the smaller hydrogen oxidation peak can be related to the current necessary for the oxidation of adsorbed hydrogen. However, further analysis of the experimental data obtained for Pd and its alloys with other noble metals [88, 89] has led to the conclusion that none of the voltammetric signals can be unequivocally attributed to the oxidation of exclusively one form of electrosorbed hydrogen.
calculated assuming the charge for the oxidation of a hydrogen monolayer as 210 C cm-2. The value of the RSA determined in this way was very close to that obtained from surface oxide reduction charge [90].
3. SURFACE OXIDE REDUCTION
The process of surface oxide formation (oxygen adsorption) on a Pt electrode and other noble metals occurs at potentials more negative than that of the onset of molecular oxygen evolution. In contrast to hydrogen adsorption, surface oxide formation is significantly slower and much more irreversible [41]. The surface coverage with adsorbed oxygen depends on the electrode potential and time. A detailed characteristic of this process on noble metal surfaces can be found in the literature [41, 91-107].
The initial stages of surface oxidation of platinum are usually described as Pt-OH formation, followed by conversion to PtO. The experiments carried out by Jerkiewicz et. al [104] with the use of the EQCM, however, led to the conclusion that PtO species are present on the surface already at the very beginning of the oxidation process. According to Biegler et al. [102] the limiting coverage with the surface oxide on Pt is reached at 2.2 V vs. RHE and corresponds to PtO2 stoichiometry. At this
potential surface oxide formation occurs simultaneously with molecular oxygen evolution. Before the onset of oxygen evolution a monolayer of PtO is reached (at. ca. 1.5 V vs. RHE). For rhodium the formation of RhOH, Rh(OH)3 and RhO(OH) species was postulated by Jerkiewicz and Borodzinski
[103], while elsewhere the layer of chemisorbed oxygen on Rh was treated as RhO [41]. The latter stoichiometry has been confirmed in EQCM experiments [108]. Similar findings on the MO-type oxide formation were reported for Pd [106] and Au [107] oxidation.
As in the case of the previous method of the RSA determination, the one based on oxygen adsorption relies on the surface oxide reduction (oxygen desorption) charge measurement (QOred),
which can be converted into the RSA by applying the equation:
RSA = QOred / (O QOred,ML,S) (3)
where O is the surface coverage with surface oxide (adsorbed oxygen) and QOred,ML,S is the
charge due to the reduction of a monolayer of surface oxide per unit area. The values of QOred and O
depend on the potential of electrode polarization and time scale of the experiment, i.e. scan rate in voltammetric measurements. The exact potential of a monolayer formation is affected by scan rate, electrolyte composition and electrode surface roughness [62, 96].
Typically, the charge corresponding to the monolayer of surface oxide of 1:1 stoichiometry is utilized. The conditions of a monolayer formation can be determined by analyzing the dependence of QOred on electrode potential for other fixed parameters. The potential, at which a monolayer of
adsorbed oxygen atoms is formed is indicated by a characteristic inflexion point on the QOred vs.E
For the RSA determination the cathodic charge of the oxide reduction should be utilized rather than the anodic charge of the oxide formation. This is due to the fact that in the oxygen region two additional anodic processes occur, namely the electrochemical dissolution of the electrode material and molecular oxygen evolution, both contributing to the total measured oxidation charge [113]. Therefore, the anodic charge usually exceeds the cathodic charge [62, 113, 114], which could lead to the overestimation of the RSA. According to the results of the EQCM experiments, the amount of dissolved metals at potentials just before the onset of oxygen evolution corresponds to ca. 15% of a monolayer for Pd, 4% for Rh and 0.2% for Pt [115].
The method based on oxygen adsorption is generally regarded as less reliable than that based on hydrogen adsorption [40]. Again, the high purity of the studied system is needed [41]. Similarly to the first method, the second one also required the correction for double layer charging. The same assumptions are usually made [40, 41].
The method of RSA determination based on surface oxide reduction is used mainly for Pd and Au electrodes, for which the first method cannot be applied. Thus, for those metals it is the most applicable method, regarded as a standard one [41]. QOred, ML,S values for Pd and Au are 424 C cm-2
and 390±10 C cm-2, respectively [41]. The potentials of PdO and AuO monolayer formation are ca. 1.45 V and 1.70 V vs. RHE, respectively [41, 101, 116].
For Pt and Rh this method is rather rarely used, since it has no advantages over that based on hydrogen adsorption. In our earlier report [108] we have compared the data obtained for a Rh electrode with both methods and found a good agreement between them. The values of QOred,ML,S values were
taken as twice higher than the respective QHox,ML,S values, i.e. 442 C cm-2 for Rh. Analogoulsy, for Pt
QOred,ML,S is equal to420 C cm-2.
The method of the RSA determination based on surface oxide reduction has been applied for Pd alloys with Pt, Rh and Au [117, 118]. Due to similar values of QOred,ML,S for Pt and Pd, Kadirgan et
al. [117] used the conversion factor of 420 C cm-2 for an oxide monolayer reduction (formed at ca. 1.5 V) on Pd-Pt alloys. However, in general, since alloy formation modifies the electrochemical properties of the components, such factors as QOred,ML,S and the potential of a monolayer formation
may differ from the values for pure metals being the function of the alloy surface composition [111, 119].
Our recent studies [119] have revealed that the potential of a monolayer formation of surface oxide on homogeneous Pd-Au alloys or on the Pd-rich phase in heterogeneous Pd-Au alloys depends almost linearly on Pd surface content in that phase. Therefore, it can be expected that also QOred, ML,Sand O values are approximately a linear function of Pd surface content in the alloy phase.
Thus, a following equation was postulated for the determination of the RSA of the Pd-Au alloy phase: RSAPd-Au = QOred / (PdO · QPdOred, ML,S · xPd + AuO · QAuOred, ML,S · xAu) (4)
On the other hand, in the case of the Au-rich phase in heterogeneous Pd-Au alloys it was demonstrated that its electrochemical properties resemble those of pure Au [41]. Thus, a simplified equation can be used for the RSA determination of that phase:
RSAAu = QOred / (AuO · QAuOred, ML,S) (5)
The above idea was extended to the RSA determination of Pd-Pt-Rh ternary alloys [118, 121]. The following equation was utilized:
RSA = QO / Σ (QOML, S · xM · θMO) (6)
where M denote the metallic alloy components.
An approach based on the coupling of the methods of the RSA determination based on hydrogen and oxygen adsorption was applied to Pt-Au alloys [122-126]. These alloys consist of two surface phases, which have electrochemical properties similar to pure metals [124]. Thus, the RSA of a Pt-Au electrode was calculated as a sum of the RSAs occupied by both phases, where the RSA of the Pt-rich phase was determined from hydrogen adsorption and the RSA of the Au-rich phase was determined from surface oxide reduction [122-126].
Prolonged electrode polarization to the oxygen region, causing surface oxide formation/reduction, metal electrodissolution/redeposition and oxygen evolution may alter the surface state of the material studied. In the literature there are numerous reports demonstrating that depending on the exact potential program applied, involving surface oxidation, the surface can significantly roughen or smooth during such an experiment [127, 128]. Additionally, in the case of the alloys the polarization to high potential inevitable for RSA determination can lead to the changes in the alloy surface composition due to a preferential dissolution of alloy components [41]. Surface segregation and phase separation of initially homogeneous alloys was observed in the case of Pd-Au, Pd-Pt-Au and Pd-Pt-Rh electrodes [41, 120, 129-131]. All these possibilities should be excluded when this method of the RSA determination is applied.
[image:9.596.157.420.489.697.2]4. DOUBLE LAYER CAPACITANCE
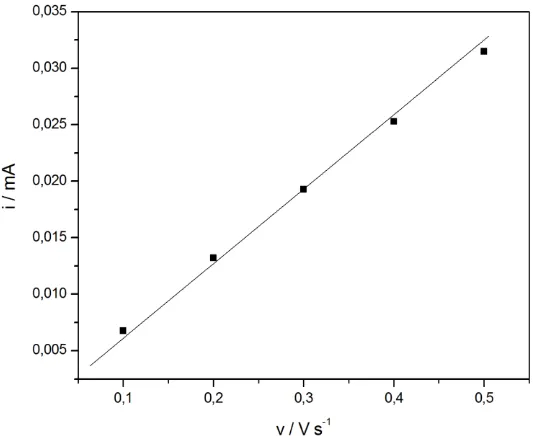
Figure 3. Dependence of double layer charging current at potential of 0.60 vs. RHE on scan rate for a polycrystalline Pt electrode in 0.5 M H2SO4 (temperature 298 K).
The potential region, where electrical double layer charging is the only electrochemical process, is called “double layer region” and for noble metal electrodes is placed between the hydrogen and oxygen regions. For Pt and Pd it corresponds to the potential range from ca. 0.40 V to 0.70 V vs. RHE, while for Au it is wider and is placed between 0 and ca. 1.35 V vs. RHE. In contrast, on Rh this region is very narrow [132] or even absent [133], while on Ru such a region cannot be distinguished at all due to a partial overlapping of hydrogen and oxygen regions [49, 50].
Usually, in the method of the RSA determination based on double layer capacity voltammetric curves are recorded in the mere double layer region at various scan rates (Fig. 2). Then, a plot of the current in the middle of the potential window vs. scan rate is constructed (Fig. 3). Under the condition, where the double layer charging is the only process occurring in that potential range, this plot is a straight line, whose slope gives the value of double layer differential capacity, according to the equation:
i = dQ/dt = (dQ/dE) · (dE/dt) = C · v (7)
In fact, the capacity value obtained by the above procedure contains contributions both from double layer charging and pseudocapacity of the process of electrolyte ion adsorption [109]. There should be no faradaic contributions to the current flowing in the double layer region.
RSA can be calculated by referring the obtained capacity to the reference value of capacity per the unit area (Cref):
RSA = C / Cref (8)
The greatest difficulty of that method and the main source of the error is the fact that the precise value of Cref should be known, which is often not the case. In general, the values of capacity
typically between 20 and 40 F cm-2 [40, 77]. This discrepancy may lead to the 100% errors. Differential capacity of the double layer depends strongly on the electrode potential, surface structure, electrolyte composition and concentration, and is very sensitive to even small changes in experimental conditions. It means that Cref has to be determined in an independent experiment, under given
conditions, on the basis of other, well defined method of the RSA determination. For noble metals such a standard method can be that based on hydrogen adsorption (Pt, Rh, Ir) or oxygen adsorption (Pd, Au). Such a procedure was applied by Conway et al. [125] in the studies on Pt-Au alloys and by Łukaszewski and Czerwiński [118, 120] for Pd-Au alloys.
Using the above approach for Pd and Au electrodes in 1 M H2SO4 solution for potential of –
0.09 V vs. RHE the value of 44.5 F cm-2 was obtained by Łukaszewski and Czerwiński [118, 120], while in 0.5 M H2SO4 solution this value for Pd and Pt was equal to 34 F cm-2 [118]. These values
were then utilized for the RSA determination of Pd-Au and Pd-Pt-Rh alloys. A similar value (28 F cm-2 ) was used for the RSA measurements of Pt-Au alloys in the same electrolyte [122]. However, other research groups found different values of Cref. Chen et al. [62] calculated the capacitance of ca.
53 F cm-2 for Pt electrode in 0.5 M H2SO4, while Fang et al. [109] obtained the capacitance of 23 F
cm-2 for Pd electrode in 0.5 M H2SO4. Tremblay et al. [48] and Łosiewicz et al. [49] reported on the
values of ca. 60 F cm-2 and 66 F cm-2 for Pt, and Ru, respectively (determined from impedance spectroscopy measurements). They estimated the relative error of this method of the RSA determination as 50%. For Rh, Łosiewicz et al. [132] found the value of ca. 25 F cm-2. All these results show that even for a given metal/alloy there is no general agreement on the value of the capacitance per unit area.
Although much less reliable than two previous methods and limited to the RSA estimation rather than its precise determination, the method based on the double layer capacity has some advantages. It enables the measurements of the RSA without the need of electrode polarization to the oxygen region, where the processes of oxide formation/reduction and metal dissolution/redeposition could lead to the changes in the surface state. It is not destructive and allows to measure the total surface area accessible to the electrolyte [48]. For the alloys it gives the value of the RSA corresponding to all alloy components [118, 120, 134]. However, in the case of metallic electrodes dispersed in a matrix this method gives the overall value of the whole area instead of the electrochemically active area of the metal [47].
5. CO ADSORPTION
Carbon monoxide is known as a strong surface poison of catalytic electrodes [135]. It has high affinity to many metals, icluding all platinum group metals. As one of the intermediates in the oxidation of various organic compounds it becomes adsorbed on the electrode surface and blocks the surface centers taking part in the electrochemical process, which leads to the deterioration of the catalyst activity. The electrode poisoning by CO adsorption products is responsible for a still unsatisfactory efficiency of methanol and ethanol fuel cells [136, 137].
potential range corresponding to the hydrogen and double layer regions [43, 84, 138-142]. It can be fully desorbed by its oxidation to CO2 by applying sufficiently high potential to the electrode.
The RSA determination based on CO adsorption is a particular case of the use of adsorption of probe molecules from the solution [40]. The amount of the adsorbate is measured from the charge needed for its oxidation during anodic stripping and the RSA is calculated according to the equation:
RSA = QCO / (z F CO) (9)
where QCO is the charge of the oxidation of CO adsorption product, z is the number of electrons
exchanged in the oxidation, F is Faraday constant and CO is the saturation coverage with adsorbed CO
in mol cm-2.
Under the conditions of a cyclic voltammteric experiments the charge due to adsorbed CO oxidations is equal to:
QCO = eps · n · F · CO (10)
where eps is the number of electrons required for the adsorbate oxidation from one surface site occupied by the adsorbate (electron per site), n is the total number of surface sites and CO is the
surface coverage with adsorbed CO. Since n/RSA is the surface atom density, the above equation can be converted into:
RSA = QCO / (eps · QHox,ML,S · CO) (11)
which for a Pt electrode gives:
RSA = QCO / (eps · 210 · CO) (12)
The conversion factor in the denominator of Eq. (11) can be calculated provided that eps and CO are known. Eps is a function of the structure of CO adsorption product. The exact structure of CO
adsorbate depends on the kind of metal and, in the case of the alloys, on their surface composition. The main product of CO adsorption on Pt are linearly and two-fold bridge-bonded CO species [43, 56, 140-147], for which the eps values are equal to 2 and 1, respectively, together with multi-fold bridge-bonded CO [43]. According to many authors [44, 52, 68, 144, 148, 149] CO is adsorbed on Pt exclusively as 1:1, linearly bonded species. However, it may be to much simplification. In fact, other adsorbate structures were also postulated in the literature, such as COOH radicals (eps =1) [140, 141, 150]. In the case of Rh the product of CO adsorption is more reduced than for Pt and probably contains a mixture of various forms of CO species [43, 146, 151-153] together with CHO or COH radicals (eps = 3) [138], or C intermediates [139]. For Pd, Ir and Ru a mixture of linearly and bridge-bonded CO is postulated [43, 83, 146, 154, 155]. However, there were suggestions, that under certain conditions the ratio of adsorbed CO species to surface Ru atoms may reach even 2:1 [156, 157].
CO stripping as a standalone method of real surface area determination has been used in studies of a number of bi- and trimetallic systems. Amongst them, one can mention such interfaces like binary Pt/Ru, Pt/Au, Pd/Pt, ternary Pt/Rh/Sn nanoparticles and core shell structures, unsupported or deposited on various carbon supports [158-166]. Many reports present calculations of the RSA which refers to the charge of CO desorption per unit area, QCOox,ML,S = 420 C cm-2.
The use of this paramaterer carries an assumption on the identity of COads structure for all
metallic surfaces. In theoretical situation, where a surface of an hypothetical electrode is fully covered with two-fold bridge bonded COads the value of QCOox,ML,S should be twice greater than the value of
other situations and other electrochemical systems a deviation from that value might be expected due to different structures of adsorbed CO. Thus, one should be aware of possible errors when comparing such determined RSA of various kinds of electroactive materials. Still, however, most of the authors do not consider this issiue, leaving it without any discussion.
[image:13.596.152.450.216.461.2]For single crystals, CO oxidation charge and surface coverage is different for different crystal planes [168, 169]. It is unknown how these values contribute to the value of the conversion factor for a given polycrystalline electrode. Only arbitrary assumptions can be made when calculating the value for the polycrystalline electrode [32].
Figure 4. Adsorbed CO stripping current (red line) recorded for a polycrystalline Pt electrode in 0.5 M H2SO4 (temperature 298 K) together with a blank curve (black line). CO adsorption potential
0.29 V vs. RHE, adsorption time 20 min, scan rate 0.05 V s-1.
For a given metal, the adsorbate structure and composition, its coverage and oxidation charge are affected also by the adsorption potential, adsorption time, temperature, electrode surface roughness and surface pretreatment as well as electrolyte composition and pH [43, 44, 138, 144, 147, 150, 170]. According to Vidaković et al. [44], a saturated monolayer of CO adsorbate on Pt electrode is formed after 15 min, while Sobkowski and Czerwiński reported on saturation adsorption time of 25-35 min. [150]. In the case of a Pt-Ru catalyst the CO saturated coverage was achieved in ca. 60-120 min. [44, 149] However, some authors used much shorter times of CO adsorption, e.g. 10 min or less [1, 52, 57, 66, 109, 171, 172]. The maximum value of CO, although very high, may be not equal to unity [44, 84,
138, 140, 142, 144, 145, 149, 150, 173-177]. This fact has not always been taken into account [52, 67, 178].
additionally a function of alloy surface composition [84, 85, 154, 181, 183, 184]. Thus, the values of CO and eps depend on the experimental conditions and no single, constant conversion factor can be
applied to recalculate QCO into the RSA. One cannot simply transfer the findings for pure Pt to other
metals and alloys, either. A weighted average between the values of the conversion factors corresponding to the electrooxidation charge of a monolayer of adsorbed CO on pure alloy components may be used [185].
To determine accurately the CO stripping charge one has to make correction for other background processes like double layer charging and metal oxide formation. It may be assumed that double layer charging and surface oxidation proceed in the same way in the presence and absence of adsorbed CO [55, 74]. Then, QCO is measured as the difference in the total anodic charge in the
potential range of CO stripping and the charge passed in the same range in the absence of the adsorbate [1, 40, 75]. However, more complex procedures of the base line subtraction were also evaluated [44, 57, 66, 67, 149]. The possibility of accurate CO charge determination using differential electrochemical mass spectroscopy (DEMS) was demonstrated [148, 172-174, 176, 180, 181, 186]. Another method of the determination of the amount of adsorbed CO, which is independent of both faradaic and nonfaradaic background, relies on infrared spectroscopic technique [47].
It is important that during the anodic removal of adsorbed CO there should be no CO present in the solution, since in the presence of CO dissolved the electrolyte a compressed monolayer is formed of a higher surface coverage [47, 187].
It should be remembered that adsorbed CO may cause changes in the electrode surface state leading to the changes in the RSA [62]. This is particularly important when using this method for the RSA determination of nanoparticles, when the possibility of particle agglomeration may occur. On the other hand, CO adsorption method of the RSA determination is claimed to be more appropriate for nanoparticles than that based on hydrogen adsorption [1, 73]. In the case of alloys the presence of adsorbed CO can also induce surface segregation and changes in the phase arrangement and surface composition [129]. These effects are usually irreversible. Thus, the RSA determination from CO adsorption can significantly modify the electrode surface and its catalytic properties [66, 67], which rather should be avoided. Moreover, adsorbed CO oxidation at high potentials can be accompanied by metal dissolution from the electrode surface, additionally leading to changes in the electrode surface state and, in the case of alloys, surface composition [188].
Another fact that should be taken into account are the sterric effects connected with the size of CO adsorption products. The adsorbed species are larger than adsorbed hydrogen atoms and they may not have access to the whole exposed area of the electrode. Moreover, for various adsorption procedures this effect may be different, since different adsorbate structures are generated under various adsorption conditions [40].
When applied for the RSA determination of Pd and Pd alloys, CO adsorption has to be performed at potentials in the double layer region in order to avoid simultaneous hydrogen absorption in the electrode bulk. In the presence of adsorbed CO the removal of absorbed hydrogen is strongly retarded and its oxidation signal is overlapped with that of CO stripping [86, 189-191].
the charge density for CO/H displacement on Pt(111) at 0.08 V is 152±5 c cm-2. Chen et al. [62] pointed out that the advantages of this method are little effects from anion adsorption, hydrogen evolution and double layer charging. Using this method one has to pay attention to avoid the interference from the reduction of oxygen dissolved in the solution.
6. UNDERPOTENTIAL DEPOSITION OF METALS
Underpotential deposition (UPD) of metals occurs at potentials positive to the reversible potential of the M+/M redox couple, below which a bulk deposition of the metal phase starts. From the thermodynamic point of view UPD takes place, when the affinity of the adsorbing metal to the substrate is greater than the affinity of the adsorbing metal to itself in its metallic phase [56, 79, 194-196].
In perfect conditions, where atomic diameters of the adsorbed (undepotentially deposited) metal and the substrate are of a similar value, the UPD deposit forms a monolayer which perfectly reproduces the morphology of the underlying substrate. The idea of implementing the underpotential deposition to measure the surface area of metals was proposed by Franklin et al., who studied the UPD of Pb on Ag catalysts [197]. Since then the underpotential deposition phenomenon has been widely studied and discussed in the literature. It has been shown that the coverage of the adatom layer is strongly dependent on deposition conditions, type of the deposited metal and substrate, and trace amounts of inorganic anions (in particular halides) or organic impurities [198].
[image:16.596.101.495.74.351.2]
B
Figure 5. (a) Cyclic voltammetric scans (0.01 V s-1) recorded for a polycrystalline Pt electrode in pure 0.5 M H2SO4 solution (black line) and solution containing 4.5 mM CuSO4 in 0.5 M H2SO4 (red
line). (b) Stripping current of Cu-UPD layer on Pt. Inner plots represent CV scans for 40 % wt Pt / C electrodes (dashed line shows the CV for pure carbon support). The Pt electrode was held in 4.5 mM CuSO4 in 0.5 M H2SO4 solutionat 0.33 V vs RHE for 15 min. After deposition
the Cu containing solution was replaced with pure supporting electrolyte and cyclic voltammetric scans were performed with a scan rate 0.01 V s-1 (1st scan – red line, 2nd scan – black line). Temperature 298 K.
From a practical point of view, for a monolayer of a deposited metal, the charge consumed in that process (QM), usually measured during voltammetric stripping of the adatoms, can be converted into the RSA using the equation:
RSA = QM / QM, ML,S (13)
where QM, ML,S is the charge corresponding to a monolayer of deposited metal per unit area.
The underpotentially deposited metals most often used for the RSA determination are Cu, Ag and Pb. In those cases the values of QM, ML,S are 420, 210 and 300 C cm-2 respectively [52, 199].
Figure 5a shows an example of a cyclic voltammogram recorded on a typical polycrystalline Pt electrode (inner figure contains CV for 40 % wt. Pt/C electrode) during continuous potential cycling in a solution containing 4.5 mM CuSO4 and 0.5 M H2SO4 (solid line) as well as the background CV
recorded in a pure supporting electrolyte (0.5 M H2SO4, red line). No faradaic process is observed
irregular signal (Ia), partially overlapping the H-UPD related currents (Ib on Fig 5a). In the positive scan, two separated regions are attributed to the oxidation of bulk phase (IIa) and the Cu-UPD (IIb). The plot in Fig. 5b (solid line) shows a typical stripping signal of underpotentially deposited Cu on polycrystalline platinum (inner figure contains a stripping signal for 40 % wt. Pt/C) recorded in the absence of Cu ions in the supporting electrolyte. Cu-UPD desorption signal can be deconvoluted into several peaks due to different bonding strength of Cu at different Pt crystal planes.
The main problems with the calculation of the charge corresponding to the deposited metal are the proper correction for background processes (double layer charging, hydrogen or oxygen adsorption) [62, 109] and the proper identification of the potential, where the formation of a monolayer of metal adatoms is completed [52, 62, 109]. In some cases the exact achievement of a true monolayer is not possible [200], and a multilayer deposition can start before the full monolayer is formed [201-203]. In general, the arrangement of adatoms on the electrode surface may not correspond to 1:1 atomic ratio, i.e. the number of surface sites occupied by foreign atoms is not equal to 1 [204]. For instance, on Pt electrode this condition is fulfilled for Cu and Ag UPD, while for other depositing metals (e.g. Cd, Sn, Pb) the ratio is 1:2 or 1:3 [205]. Schumacher et al. [206] determined the surface coverage with Cu adatoms on Pt to be in the range between 0.44 (for pure H2SO4 supporting
electrolyte) and 0.8 (for the supporting electrolyte with an addition of small amounts of Cl- ions). Zhang et al. [207] found that for metallic Ru, Cu deposit reaches a coverage of a half of monolayer, while for electrochemically treated conductive-RuOxHy surface, the coverage plateau is obtained at ca.
0.9 ML.
Another unfavorable situation appears, when a partial charge transfer occurs during deposition [208-212], resulting in the undefined value of QM, ML,S..Deakin and Melroy [213] used quartz crystal
microbalance in order to calculate electrodeposition valencies (γ) of underpotentially deposited Pb, Bi, Cu and Cd on polycrystalline gold. They found that in contrast to bulk deposition, the values of γ deviate for Bi and Cu adatoms from valencies of their ions during UPD. The Cu-UPD γ remained on the level of 1.4 suggesting a presence of partial charge on the Cu atoms. Similar effects regarding Cu UPD on polycrystalline Pt were found by Schumacher et al. [206]. The authors claim that the electrosorption valency of 1.2 ± 0.3 reflects a situation where a positive charge of +1 is localized per adsorbed Cu atom. On the other hand, Chierchie and Mayer [214] discovered that Cu UPD forms completely discharged, epitaxial layer on polycrystalline Pd.
One should also take into account the possibility of a retention of the deposited adatoms in the crystal lattice of the substrate, which leads to the alteration of the structure of the electrode surface [215, 216]. A surface alloy formation between the matrix and the deposited metal may occur [217-219]. If the traces of deposited adatoms are not removed during its stripping, their presence may further modify the catalytic activity of the electrode studied [79, 220-222].
7. COMPARISON BETWEEN VARIOUS METHODS OF RSA DETERMINATION.
In the literature there are reports where different methods of the RSA determinations were applied for the same electrode. Therefore, the comparison between various methods could be made. Below some examples of such studies are briefly reviewed.
Green and Kucernak [52, 154, 223] compared the methods of the RSA determination based on Cu UPD, hydrogen adsorption and CO adsorption for Pt, Ru, Ru powder black and mesoporous Pt-Ru electrocatalysts. In the case of pure Pt and Pt-Pt-Ru alloys they found a good agreement between the RSA values obtained by CO stripping, Cu UPD and H adsorption (for Pt). These results were consistent with BET measurements. On the other hand, the RSA of Ru electrode calculated from CO stripping was ca. twice as large as that determined by Cu UPD and BET methods. According to the authors, this discrepancy indicates other than 1:1 stoichiometry between CO and Ru surface sites. Due to the fact that Cu does not deposit on Ru oxide, is was possible to distinguish between bare, metallic Ru and oxidized Ru sites on the surface of a Pt-Ru catalyst. On the other hand, Gavrilov et al. [224] made a suggestion that the Cu-UPD technique applied with longer time procedures becomes sensitive to all forms of reversibly oxidized ruthenium. The authors postulate that the RSA determination should be performed under various Cu deposition times in order to avoid errors related with the selectivity of the process. The changes in the electrode RSA in the process of Ru dissolution could also be studied using Cu UPD [52].
Real surface area of platinum nanoparticles (ca. 20 % wt. ) deposited on carbon (C) and tungstein carbides (WC) was determined from carbon monoxide and hydrogen desorption charges by Jeon et al [225]. The authors found that the RSA value calculated from hydrogen region was 2.5 times higher than from CO experiments for WC supported platinum, while the discrepancy between surface areas for Pt/C obtained from both methods were less than 10 %. The high excess of H-UPD atoms found on Pt/WC comparing to Pt/C was explained by a surface spill-over of H+ from Pt to tungstein carbid. According to the CV profiles presented in the article, the ratio between the values of hydrogen and oxide desorption charge was markedly different for both catalysts, suggesting that oxygen sorption process was probably not affected by the spill-over phenomenon. Thus, a consideration on the surface oxide desorption charge as a more reliable basis for the RSA estimation in this particular case would be very attractive. Unfortunately, the authors did not comment on this.
A similar approach was presented by Vangatesan et al., who calculated the RSA referred to mass of platinum for Pt nanoparticles deposited on mesoporous carbon support [226]. In addition to electrochemical measurements, the authors calculated an average Pt particle size and estimated specific surface area using TEM technique. In this case, however, the discrepancy between CO and the hydrogen derived RSA values increased with increasing platinum loading and for the highest, 80 % wt. Pt, the RSACO was twice as high as the RSAH+ and almost five times lower than RSATEM. The authors
Fang et al. [109] applied 4 methods to determine the RSA of Pd electrode, namely: double layer capacitance, surface oxide reduction, Cu UPD and CO stripping. The results obtained by the second and third methods were consistent with deviations below 5%. The other methods results agreed with the previous one on condition that double layer capacity per unit area was taken as 23 F cm-2 and surface coverage with adsorbed CO was assumed 0.66. (for the coversion factor of 420 C cm-2). For Cu UPD the conversion factor of 407 C cm-2 was used.
Elliot et al. [61] characterized the surface of nanostructured Pt films deposited on microelectrodes by hydrogen adsorption and Cu UPD. In the latter case they used the conversion factor of 410 C cm-2. A good agreement between both methods was found.
Kim et al. [227] compared various methods of the RSA determination of nanoporous Pt layer with small pore diamentions characterized by different values of roughness factor (from 25 to 450). The RSA values determined by Cu-UPD and CO stripping methods were smaller than that estimated by the H-UPD) method, and the discrepancy became greater as the roughness factor increased. The authors concluded that the accessible surface area of the pores inside the Pt layers for the adsorbates decreases in the order of H > CO > Cu. The size of adsorption species may explain their accessibility into the pores.
Fiçicioğlu and Kadirgan [110] examined the surface of electrodeposited Pd-Pt alloys with the use of oxygen adsorption and Cu UPD. The differences in the RSA values obtained by both methods were ca. 10%. The authors concluded that the estimation of the RSA of a Pd-Pt alloy based on Cu UPD is more appropriate, while oxygen adsorption method led to overestimation of the RSA.
Łukaszewski and Czerwiński [118] compared the values of the RSA of Pd-Au alloys determined by oxygen desorption and double layer capacitance. They studied both superficially homogeneous and heterogeneous electrodes. The difference in the results obtained by both methods was within 30%. They suggested that the latter method is suitable rather for the estimation of the RSA and gives only the value of the total electrode area, while the former one enables the calculation of the RSAs of particular surface phases. In the same laboratory an agreement within ca. 20% was found for the values of the RSA of Pt-Au alloys determined for hydrogen and oxygen adsorption, and double layer capacitance [122].
Bogolowski et al. [174] determined the RSA of Ru electrocatalyst by CO stripping and Cu UPD. They assumed the same packing density of adsorbed CO on Ru as on Pt and used the conversion factor of 280 C cm-2, i.e. corresponding to CO surface coverage equal to 0.66. In order to obtain an agreement with the RSA values determined from Cu UPD, in the latter case the conversion factor of 520 C cm-2 was used.
The above methods were used by Nagel et at. [176] for the determination of the RSA of polycrystalline and nanoparticle Pt and Ru electrodes. They found 20% agreement between both methods, provided that CO oxidation charge was detected by DEMS and assuming a maximum coverage with adsorbed CO of 0.70 both for Pt and Ru, and for polycrystalline electrodes and nanoparticles as well.
RSA decreased in the method order: H adsorption > Cu UPD > CO/H displacement. For rough Pt surfaces ca. 21% of the surface sites being accessible for H adsorption could not be occupied by Cu UPD. These differences were explained by different size of the adsorbates. The smallest hydrogen atoms can be adsorbed even in pores inside rough surfaces, which are inaccessible to the species with a larger molecule size. Thus, the RSA determined by Cu UPD corresponds to the number of surface sites accessible for most reactants. The authors also concluded that the method based on double layer capacitance measurement enables only a rough evaluation of the RSA. CO adsorption methods was regarded as inappropriate for RSA determination of rough surfaces due to a significant annealing effect induced by adsorbed CO. Such a phenomenon was not observed in the case of Cu deposition.
Different results were obtained by Shao et al. [66] and Rudi et al. [67], who studied several methods of RSA determination of Pt-Ni nanoparticles. The values of RSA decreased in the order: Cu UPD >CO adsorption > H adsorption. The influence of history of the applied potential cycling program on the RSA values was also observed [67].
Guterman et al. [228] evaluated the RSA of carbon supported Pt and Pt3Ni catalysts in three
ways: (1) from the charge consumed during the desorption of the hydrogen monolayer; (2) from the half-sum of the charge consumed by the hydrogen monolayer adsorption and desorption; and (3) from the charge consumed by the CO desorption The three results for any one of the catalysts were practically identical.
Lindström et al. [55] compared the RSA of porous Pt electrodes, used in PEFCs, determined from hydrogen adsorption and CO oxidation. The changes of hydrogen charges with temperature and humidity were reported. The effect of temperature on CO charges was the smaller the higher the relative humidity was. Thus, the authors regarded the method based on CO adsorption as a more accurate for the RSA determination in fuel cells, while the method based on H adsorption is limited rather to room temperature.
Watt-Smith et al. [56] determined the RSA of Pt/C PEM fuel cell electrodes using different adsorbates, i.e. hydrogen, CO and Ag UPD. They found the variations between the results obtained by different methods to be ca. 100% for highly rough electrodes and ca. 30% for less rough electrodes. In the former case H adsorption seemed to be more accurate for the RSA determination, while in the latter case both these methods worked. The data from CO adsorption were much less reliable.
Binninger et al. [57] examined the RSA of Pt catalysts on carbon and metal-oxide supports using H adsorption and CO oxidation. They developed a more sophisticated procedure of the baseline correction for H desorption and CO oxidation signals. Using these modifications they were able to obtain reproducible and consistent values of the RSA. However, the method based on H adsorption was regarded as a more reliable than the other.
The Cu-UPD technique was used in the electrochemical quantification of the electro-active surface area of other noble metals and metallic nanoparticles. Aldana-Gonzales et. al. [229] found that the RSA of AuNPs/ITO determined from voltammetric and chronoamperometric measurements performed in CuSO4/H2SO4 solution were in a good agreement with geometric surface area quantified
methods in surface area determination of Se-modified RuNPs/C [231]. They showed that for both – high and low Se concentration on the Ru surface, the most reliable information about the RSA value was obtained from COad stripping, while Cu-UPD method led to the overestimation of the active
surface area because of the formation of CuSex compounds.
8. CONCLUSIONS
The value of the RSA of a given electrode varies with the method used for its determination and the experimental conditions. Each method of the RSA measurement is based on specific theory and assumptions. Thus, even for the same electrode various “surface areas” can be defined [232].
Undoubtedly, no universal method exists that could be used for the RSA determination of all noble metal electrodes. Even for pure Pt, which has been the most frequently studied metal, different authors propose slightly different procedures. For other metals, and in particular, for their alloys, the situation is more complex and in many cases there is no standard way of the RSA determination that would be generally accepted in the literature.
For a Pt electrode the most recommended method is that based on hydrogen adsorption. The second one is probably that of Cu UPD. The latter method is also applicable for other metals and alloys and seems to be the most versatile. The RSA determination from oxygen adsorption is the most suitable for Au, Pd and Pd-rich alloys. The method utilizing double layer capactitance appears to be quite universal but it is only destined to a rough estimation of the RSA. The narrow double layer potential window, possible contributions from faradaic processes and often unknown conversion factor between the measured capacity and RSA are here the main problems.
The method based on CO adsorption needs a special comment. Although commonly used and potentially applicable for all platinum group metals and alloys, it seems to be very problematic. It requires the knowledge on the adsorption parameters, such as the surface coverage with the adsorbate and its exact structure and composition. These factors are dependent on the adsorption conditions and the electrode state. It means that in each case for a reliable RSA determination of a given type of the electrode the detailed investigations on the nature of the CO adsorption product should be carried out for given experimental conditions, which is very inconvenient. No fixed, standardized procedure of CO adsorption has been established for the RSA determination of various noble metals and their alloys of different composition.
ACKNOWLEDGEMENTS
This research was funded from grant no. 2015/17/B/ST8/03377 (ID 289956) of the Polish National Centre.
CONFLICTS OF INTEREST
The authors declare no conflict of interest
References
1. J. Durst, C. Simon, F. Hasché and H. A. Gasteiger, J. Electrochem. Soc., 162 (2015) F190 2. J. Durst, A. Siebel, C. Simon, F. Hasché, J. Herranz and H. A. Gasteiger, Energy Environ. Sci., 7
(2014) 2255
3. D. Strmncik, M. Uchimura, C. Wang, R. Subbamaran, N. Danilovic, D. van der Vliet, A. P. Paulikas, V. R. Stamenkovic and N. M. Markovic, Nat. Chem., 5 (2013) 300
4. Y. C. Weng, C. T. Hsieh and Electrochim. Acta, 56 (2011) 1932
5. J.L. Fernández, D.A. Walsh and A.J. Bard, J. Am. Chem. Soc., 127 (2005) 357
6. W. P. Zhou, X. F. Yang, M. B. Vukmirovic, B. E. Koel, J. Jiao, G. W. Peng, M. Mavrikakis and R.R. Adzic, J. Am. Chem. Soc., 131 (2009) 12755
7. Y.C. Xing, Y. Cai, M. B. Vukmirovic, W. P. Zhou, H. Karan, J. X. Wang and R.R. Adzic, J. Phys. Chem. Lett., 1 (2010) 3238
8. T.S. Zhao, Z.X. Liang and J.B. Xu, Encyclopedia of Electrochemical Power Sources, vol. 2, Elsevier B.V, Amsterdam (2009)
9. C. Lamy, E. M. Belgsir and J-M. Léger, J. Appl. Electrochem., 31 (2001) 799
10. A. Lima, C. Coutanceau, J-M. Léger and C. Lamy, J. Appl. Electrochem., 31 (2001) 379 11. M. Li, A. Kowal, K. Sasaki, N. Marinkovic, D. Su, E. Korach, P. Liu and R.R. Adzic,
Electrochim. Acta, 55 (2010) 4331 12. A. Hamnett, Catal. Today, 38 (1997) 445
13. M. Chotkowski, M. Uklejewska, H. Siwek, J. Dłubak and A. Czerwiński, Functional Mat. Lett., 2 (2011) 187
14. W.J. Zho, W. Z. Li, S. Q. Song, Z.H. Zhou, L. H. Jiang, G. Q. Sun, Q. Xin, K. Poulianitis, S. Kontou and P. Tsiakaras, J. Power Sources, 131 (2004) 217
15. A. Kowal, S.Lj. Gojkovic, K.-S. Lee, P. Olszewski and Y.-E. Sung, Electrochem. Commun., 11 (2009) 724
16. K. Sasaki, J.X. Wang, H. Naohara, N. Marinkovic, K. More, H. Inada and R.R. Adzic, Electrochim. Acta, 55 (2010) 2645
17. W.J. Zhou, B. Zhou, W.Z. Li, Z.H. Zhou, S.Q. Song, G.Q. Sun, Q. Xin, S. Douvartzides, M. Goula and P. Tsiakaras, J. Power Sources, 126 (2004) 16
18. J. Wu and H. Yang, Accounts Chemical Research, 46 (2013) 1848
19. F. Vigier, C. Coutanceau, A. Perrard, E.M. Belgsir and C. Lamy, J. Appl. Electrochem., 34 (2004) 439
20. B. D. Adams, R. M. Asmussen, C. K. Ostrom and A. Chen, J. Phys. Chem. C, 118 (2014) 29903 21. E. Antolini, Appl. Catal. B: Environmental, 74 (2007) 324
22. E. Antolini, Appl. Catal. B: Environmental, 74 (2007) 337 23. E. Antolini, J. Power Sources, 170 (2007) 1
24. E. Antolini, J. R.C. Salgado and E. R. Gonzalez, J. Power Sources, 160 (2006) 957
25. H.Liu, C. Song, L. Zhang, J. Zhang, H. Wang and D. P. Wilkinson, J. Power Sources, 155 (2006) 95
28. C. Rice, S. Ha, R.I. Masel, P. Waszczuk, A. Wieckowski and T. Barnard, J. Power Sources 111 (2002) 83
29. N. M. Aslam, M. S. Masdar, S. K. Kamarudin and W. R. W. Daud, APCBEE Procedia, 3 (2012) 33
30. C. Rice, S. Ha, R.I. Masel and A. Wieckowski, J. Power Sources, 115 (2003) 229 31. M. D. Obradović and S. L. Gojković, J. Solid State Electrochem., 18 (2014) 2599 32. S. Henning, J. Herranz and H. A. Gasteiger, J. Electrochem. Soc., 162 (2015) F178
33. A. K. Shukla, M. Neergat, P. Bera, V. Jayaram and M. S. Hegde, J. Electroanal. Chem., 504 (2001) 111
34. P. Kędzierzawski, A. Mikołajczuk, A. Borodziński, B. Mierzwa and L. Stobiński, ECS Transactions, 28 (2010) 23
35. C. H. Chen, W. J. Liou, H.M. Lin, S. H. Wu, A. Borodziński, L. Stobiński and P. Kędzierzawski, Fuel Cells, 10 (2010) 227
36. J. R. González-Velasco, J. A. Botas, R.Ferret, M. P. González-Marcos, J.-L. Marc and M. A. Gutiérrez-Ortiz, Catalysis Today, 59 (2000) 395
37. F.A. Lewis, The Palladium/Hydrogen System, Academic Press, New York (1967)
38. J. Kleperis, G. Wójcik, A. Czerwiński, J. Skowroński, M. Kopczyk and M. Bełtowska-Brzezińska, J. Solid State Electrochem., 5 (2001) 229
39. G. Sandrock, J. Alloy Comp., 293–295 (1999) 877
40. S. Trasatti and O. A. Petrii, Pure Appl. Chem., 63 (1991) 711
41. R. Woods, Electroanalytical Chemistry, vol. 9, Marcel Dekker, New York (1976) 42. G. Jarząbek and Z. Borkowska, Electrochim. Acta, 42 (1997) 2915
43. B. Beden, C. Lamy, N. R. de Tacconi and A. J. Arvia, Electrochim. Acta, 35 (1990) 691 44. T. Vidaković, M. Christov and K. Sundmacher, Electrochim. Acta, 52 (2007) 5606 45. C. Gabrielli, P. P. Grand, A. Lasia and Perrot, H. J. Electrochem. Soc., 151 (2004) A1937 46. H. Duncan and A. Lasia, Electrochim. Acta, 53 (2008) 6845
47. F.C. Nart and W. Vielstich, Handbook of Fuel Cells – Fundamentals, Technology and Applications, vol. 2: Electrocatalysis, Wiley and Sons, New York (2003)
48. M.-L. Tremblay, M. H. Martin, C. Leboin, A. Lasia and D. Guay, Electrochim. Acta, 55 (2010) 6283
49. B. Łosiewicz, M. Martin, C. Lebouin and A. Lasia, J. Electroanal. Chem., 649 (2010) 198 50. S. Hadzi-Jordanov, H. Angerstein-Kozlowska, M. Vukovič and B. E. Conway, J. Electrochem.
Soc., 125 (1978) 1471
51. O. A. Petrii, J. Solid State Electrochem., 12 (2008) 609
52. C. L. Green and A. Kucernak, J. Phys. Chem. B, 106 (2002) 1036
53. J. Bett, K. Kinoshita, K. Rontsis and P. Stonehart, J. Catal., 29 (1973) 160 54. J. Sobkowski and J. Umiński, Roczniki Chemii, 44 (1970) 1135
55. R. W. Lindström, K. Kortsdottir, M. Wesselmark, A. Oyarce, C. Lagergren and G. Lindbergh, J. Electrochem. Soc., 157 (2010) B1795
56. M. J. Watt-Smith, J. M. Friedrich, S. P. Rigby, T. R. Ralph and F. C. Walsh, J. Phys. D. Appl. Phys., 41 (2008) 174004
57. T. Binninger, E. Fabbri, R. Kötz and T. J. Schmidt, J. Electrochem. Soc., 161 (2014) H121 58. R. Woods, J. Electroanal. Chem., 49 (1974) 217
59. S. Gilman, J. Electroanal. Chem., 7 (1964) 382
66. M. Shao, J. H. Odell, S.-I. Choi and Y. Xia., Electrochem. Commun., 31 (2013) 46 67. S. Rudi, C. Cui, L. Gan and P. Strasser, Electrocatal., 5 (2014) 408
68. H. Gharibi, M. Amani, H. Pahlavanzadeh and M. Kazemeini, Electrochim. Acta, 97 (2013) 216 69. B. Łosiewicz, R. Jurczakowski and A. Lasia, Electrochim. Acta, 80 (2012) 292
70. H. Wang, S. Ji, W. Wang and R. Wang, S. Afr. J. Chem., 66 (2013) 17
71. T. L. Knutson, M. L. Bollinger and W. H. Smyrl, J. Electrochem. Soc. 155 (2008) F17 72. G. Jerkiewicz, Electrocatal., 1 (2010) 179
73. F. Maillard, S. Pronkin and E. R. Savinova, Handbook of Fuel Cells: Fundamentals, Technology and Applications, Vol. 5, John Wiley & Sons, New York (2009)
74. K. J. J. Mayrhofer, D. Strmcnik, B. B. Blizanac, V. Stamenkovic, M. Arenz and N .M. Markovic, Electrochim. Acta, 53 (2008) 3181
75. H. Schulenburg, J. Durst, E. Müller, A. Wokaun and G.G. Scherer, J. Electroanal. Chem., 642 (2010) 52
76. J. Schmidt, H. A. Gasteiger, G. D. Stab, P. M. Urban, D. M. KoIb, and R. J. Behm, J. Electrochem. Soc., 145 (1998) 2354
77. Z. Galus, Fundamentals of electrochemical analysis, Ellis Horwood, New York (1994) 78. Autolab Application Note EC07,
http://www.ecochemie.nl/download/Applicationnotes/Autolab_Application_Note_EC07.pdf 79. E. Lamy-Pitara and J. Barbier, J. Appl. Catal. A Gen., 149 (1997) 49
80. A. Zolfaghari, F. Villiard, M. Chayer and G. Jerkiewicz, J. Alloy. Comp., 253-254 (1997) 481 81. O. M. Løvvik, S. M. Opalka and Surf. Sci., 602 (2008) 2840
82. M. Łukaszewski, T. Kędra and A. Czerwiński, Electrochem. Commun., 11 (2009) 978 83. M. Łukaszewski, T. Kędra and A. Czerwiński, Electrochim. Acta, 55 (2010) 1150 84. A. Czerwiński and J. Sobkowski, Anal. Lett., 17 (1984) 2175
85. H. Siwek, M. Łukaszewski and A. Czerwiński, Phys. Chem. Chem. Phys,. 10 (2008) 3752 86. A. Czerwiński, J. Electroanal. Chem., 379 (1994) 487
87. A. Czerwiński, Polish J. Chem., 69 (1995) 699
88. M. Łukaszewski, K. Hubkowska, U. Koss and A. Czerwiński, Materials, 6 (2013) 4817
89. M. Grdeń, A. Piaścik, Z. Koczorowski and A. Czerwiński, J. Electroanal. Chem., 532 (2002) 35 90. A. N. Correia, L. H. Mascaro, S. A. S. Machado and L. A. Avaca, Electrochim. Acta, 42 (1997)
493
91. M. Peuckert, Surf. Sci., 141 (1984) 500
92. M. Peuckert, F. P. Coenen and H. P. Bonzel, Surf. Sci., 141 (1984) 515
93. M. Peuckert, F. P. Coenen and H. P. Bonzel, Electrochim. Acta, 29 (1984) 1305
94. B. V. Tilak, B. E. Conway and H. Angerstein-Kozlowska, J. Electroanal. Chem., 48 (1973) 1 95. G. Jerkiewicz, Interfacial electrochemistry, Marcel Dekker, New York (1999)
96. B. E. Conway, Prog. Surf. Sci., 49 (1995) 331
97. L. D. Burke, Electrodes of conductive metallic oxides, Elsevier, New York (1980)
98. L. H. Dall’Antonia, G. Tremiliosi-Filho and G. Jerkiewicz, J. Electroanal. Chem., 502 (2001) 72 99. G. Tremiliosi-Filho, L. H. Dall’Antonia and G. Jerkiewicz, J. Electroanal. Chem., 422 (1997) 149 100.V. S. Bagotzky and M. R. Tarasevich, J. Electroanal. Chem., 101 (1979) 1
101.D. A. J. Rand and R. Woods, J. Electroanal. Chem., 31 (1971) 29
102.T. Biegler, D. A. J. Rand and R. Woods, J. Electroanal. Chem., 29 (1971) 269 103.G. Jerkiewicz and J.J. Borodzinski, Langmuir, 9 (1993) 2202
104.G. Jerkiewicz, G. Vatankhah, J. Lessard, M. P. Soriaga and Y.-S. Park, Electrochim. Acta, 49 (2004) 1451
105.K. Gossner and E. Mizera, J. Electroanal. Chem., 125 (1981) 347 106.M. Tian and B. E. Conway, J. Electroanal. Chem., 581 (2005) 176
107.M. Tian, W. G. Pell and B. E. Conway, Electrochim. Acta, 48 (2003) 2675
109.L. Fang, Q. Tao, M. Li, L. Liao, D. Chen and Y. Chen, Chin. J. Chem. Phys., 23 (2010) 543 110.F. Fiçicioğlu and F. Kadirgan, J. Electroanal. Chem., 346 (1993) 187
111.M. Łukaszewski and A. Czerwiński, J. Alloys Comp., 473 (2009) 220 112.A. Capon and R. Parsons, J. Electroanal. Chem., 65 (1975) 285 113.D. A. J. Rand and R. Woods, J. Electroanal. Chem., 35 (1972) 209
114.L. Salgado, Y. Meas and G. Trejo, J. Solid State Electrochem., 7 (2002) 37 115.M. Łukaszewski and A. Czerwiński, J. Electroanal. Chem., 589 (2006) 38 116.D. A. J. Rand and R. Woods, Anal. Chem., 47 (1975) 1481
117.F. Kadirgan, B. Beden, J. M. Leger, C. Lamy, J. Electroanal. Chem., 125 (1981) 89 118.M. Łukaszewski and A. Czerwiński, Thin Solid Films, 518 (2010) 3680
119.M. Łukaszewski and A. Czerwiński, J. Solid State Electrochem., 12 (2008) 1589 120.M. Łukaszewski and A. Czerwiński, Electrochim. Acta, 48 (2003) 2435
121.M. Soszko, M. Łukaszewski, Z. Mianowska and A. Czerwiński, J. Power Sources., 196 (2011) 3513
122.K. Kuśmierczyk, M. Łukaszewski, Z. Rogulski, H. Siwek, J. Kotowski and A. Czerwiński, Polish J. Chem., 76 (2002) 607
123.R. Woods, Electrochim. Acta, 16 (1971) 655 124.M. W. Breiter, J. Phys. Chem., 69 (1965) 901
125.B. E. Conway, H. Angerstein-Kozlowska and G. Czartoryska, Z. Phys. Chem. N. F., 112 (1978) 195
126.R. Woods, Electrochim. Acta, 14 (1969) 533
127.A. Bolzán, M. E. Martins and A. J. Arvía, J. Electroanal. Chem., 207 (1986) 279 128.C. L. Perdriel, E. Custidiano and A. J. Arvía, J. Electroanal. Chem., 246 (1988) 165 129.M. Łukaszewski and A. Czerwiński, J. Solid State Electrochem., 11 (2007) 339
130.M. Łukaszewski, M. Grdeń and A. Czerwiński, J. Solid State Electrochem., 9 (2005) 1 131.M. Łukaszewski, T. Kędra and A. Czerwiński, J. Electroanal. Chem., 638 (2010) 123 132.B. Łosiewicz, R. Jurczakowski and A. Lasia, Electrochim. Acta, 56 (2011) 5746 133.M. Wasberg and G. Horányi, J. Electroanal. Chem., 386 (1995) 213
134.G.E. Shcheblykina, E.V. Bobrinskaya and A. V. Vvedenskii, Protection of Metals, 34 (1998) 6 135.P. Stonehart and G. Kohlmayr, Electrochim. Acta, 17 (1972) 369
136.P. Piela, A and Czerwiński, Przem. Chem., 85 (2006) 13 137.P. Piela, A and Czerwiński, Przem. Chem., 85 (2006) 164
138.A. Czerwiński, J. Sobkowski, A. Kaczmarek and M. Nowakowska, Anal. Lett., 18 (1985) 1465 139.A. Czerwiński, J. Electroanal. Chem., 252 (1988) 189
140.A. Czerwiński and J. Sobkowski, J. Electroanal. Chem., 91 (1978) 47 141.A. Czerwiński, Anal. Lett., 22 (1989) 1547
142.V. E. Kazarinov, V. N. Andeev and A. V. Shlepakov, Electrochim. Acta, 34 (1989) 905 143.S. Gilman, J. Phys. Chem., 109 (1962) C197
144.A. Cuesta, A. Couto, A. Rincon, M. C. Perez, A. Lopez-Cudero and C. Gutierrez, J. Electrochanal. Chem., 586 (2006) 184
145.H. Uchida, K. Izumi and M. Watanabe, J. Phys. Chem. B, 110 (2006) 21924 146.M. W. Breiter, J. Electroanal. Chem., 180 (1984) 25
147.A. Couto, A. Rincón, M. C. Pérez and C. Gutiérrez, Electrochim. Acta, 46 (2001) 1285 148.R. Ianniello, V. M. Schmidt, U. Stimming, J. Stumper and A. Wallau, Electrochim. Acta, 39
(1994) 1863
149.T. Vidakovic, M. Christov and K. Sundmacher, J. Appl. Electrochem., 39 (2009) 213 150.J. Sobkowski and A. Czerwiński, J. Phys. Chem., 89 (1985) 365
151.W.-F. Lin and S.-G. Sun, Electrochim. Acta, 41 (1996) 803 152.S. Gilman, J. Phys. Chem., 71 (1967) 4330