Int. J. Electrochem. Sci., 9 (2014) 5409 - 5415
International Journal of
ELECTROCHEMICAL
SCIENCE
www.electrochemsci.org
Short Communication
Determination of Total Fluoride Content in Teas by Using
Fluoride Ion-Selective Electrode
Antonija Jurić1,*, Ante Prkić1, Josipa Giljanović, Mia Brkljača2
, Vesna Sokol3, Perica Bošković3, Tina Vukušić1
1
Department of Analytical Chemistry, Faculty of Chemistry and Technology, Teslina 10/V, 21000 Split, Croatia.
2
Department of Ecology, Agronomy and Aquaculture, University of Zadar, Mihovila Pavlinovića bb, 23000 Zadar, Croatia.
3
Department of Physical Chemistry, Faculty of Chemistry and Technology, Teslina 10/V, 21000 Split, Croatia.
*
E-mail: [email protected]
Received: 10 May 2014 / Accepted: 12 June 2014 / Published: 16 July 2014
The total fluoride content was analyzed in 30 tea samples. The analyzed samples were chamomile (Matricaria chamomilla), green tea (Camellia sinensis) and mint (Mentha piperita) in tea bags and bulk purchased at local supermarkets and marketplaces in Split, Croatia, were determined. Tea samples were digested in microwave in nitric acid and hydrogen peroxide mixture. Potentiometric determination by using fluoride ion-selective electrode was applied in this work. Average F− concentration in all tested samples was 0.183±0.161 mg L−1. In order to get a better insight into the fluoride content in different plant samples, a One-Way ANOVA (program R) was used for statistical data analysis. Concentration of F− follows normal distribution. F− concentrations (P < 0.001) were higher in bulk samples (0.354±0.039 mg L−1) than in tea bags ones (0.111±0.007 mg L−1) of mint samples. F− content was not statistically different among plant samples. Green tea samples have total content in range from 0.0163 to 0.509 mg L−1. Chamomile samples have total content in range from 0.0001 to 0.4367 mg L−1 with the highest recorded dispersion.
Keywords: fluoride, tea, potentiometric, determination, ion-selective electrode
1. INTRODUCTION
growth and bone tissue upholding and teeth) and toxic (for adults the lethal dose is 0.20-0.35 g F− per kg body weight) [1]. Higher F− concentration in the human body can be resulted by living in polluted environment and feeding with polluted food. Higher fluoride intake, above recommended levels (1.5 mg L−1), leads to dental and skeletal fluorosis [2,3]. Acute fluoride intoxication can have neurological complications [4], urinary stone formation [5] and hypocalcaemia [6] as consequences on endemic patients. In recently published papers was described a link between fluoride intake and cancer [7-10].
Tea-consuming way has got a significant change in past few decades by spreading availability of instant formulations such as packed tea, powdered tea, and both bottled and canned tea beverages. Since tea (Camellia sinensis) is naturally rich in fluorine, the amount of fluoride consumed through these new tea ways of preparation and new philosophy of approach to the tea consumption culture is higher [11].
It is estimated that packed tea and instant tea powder make about 30% of the total tea market, but their fluoride concentrations have not been well studied [11].
Potentiometric determination of fluoride by using fluoride ion-selective electrode (FISE) is very simple and fast method often described in similar determinations [1,11-15]
In this paper we made analysis of fluoride contents in three different plants for samples purchased at local supermarkets and marketplaces in Split, Croatia.
2. EXPERIMENTAL
2.1. Reagents and chemicals
All needed solutions were prepared by solving certain amount of chemicals in ultrapure water. Ultrapure water (declared conductivity 0.04 μS cm−1) was prepared by Millipore Simplicity (USA). Following chemicals were used: Sodium nitrate, NaNO3, p.a., Sodium fluoride, NaF, p.a., Sodium acetate, CH3COONa, p.a., Sodium hydroxide, NaOH, p.a., Acetic acid, CH3COOH, p.a., Kemika (Croatia). NaF was dried at 110 °C for two hours and after cooling was used as standard solutions needed for construction of calibration curve. For tea samples digestion were used nitric acid, HNO3, s.p. (s.p. designates ultrapure chemical) and hydrogen peroxide, H2O2, s.p.
2.2. Apparatus
Figure 1. Potenciometric system for fluoride determination
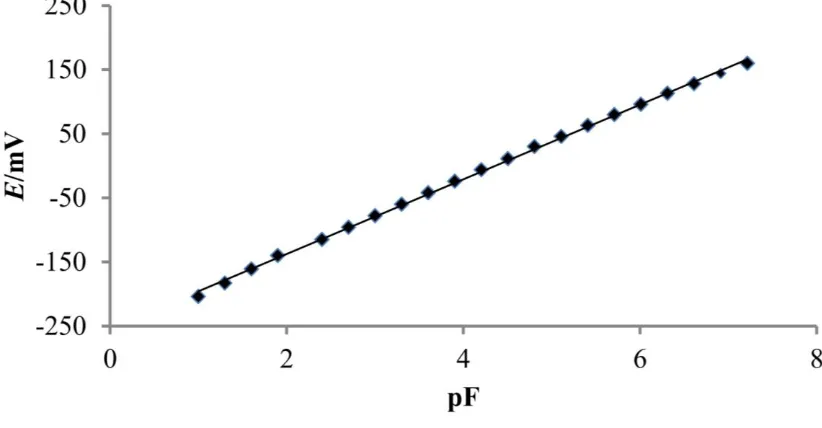
In Figure 2 is given response of used FISE in our experiment to fluoride ions at pH = 5.0. Potential change of 58.22 mV per decade of fluoride concentration change was recorded, with correlation coefficient of 0.9991, which is in good agreement with theoretical Nerstian slope for monovalent anions.
Figure 2. Response of FISE to fluoride ions at pH = 5.0
[image:3.596.95.506.427.641.2]wet digestion were 160 °C and 0.75 MPa. Microwave digestion lasted for 80 minutes. After cooling all samples were transferred in 50.0 mL volumetric flasks and diluted with 0.2 % nitric acid [17].
3. RESULTS AND DISCUSSION
The concentrations of fluoride ions in 14 different samples of mint tea (Mentha piperitae folium and Melissa oficinalis), 7 samples of green tea (Camellia sinensis) and 9 samples of chamomile tea (Matricaria chamomilla) were analyzed.
All samples of analyzed tea were purchased at supermarkets and local marketplaces. The analyzed teas are commonly used by local people. For all measurement ultrapure water was used so we can be sure that measured fluorides are from tea.
[image:4.596.68.533.419.760.2]A sample of commercially available teas was purchased in local supermarkets (mint samples 1-7; all green tea samples and chamomile samples 1-5) and marketplace (mint samples 7-14 and chamomile samples 6-10). Samples were a mixture of plant leaves and twigs, especially ones purchased at marketplaces. Samples sieving was not performed as in tea preparation procedure, nobody does sieving teas prior tea brewing. We weighted precisely 0.2000 g of each sample and put in Teflon® vessels with 4 mL nitric acid and 2 mL hydrogen peroxide for microwave digestion [17].
Table 1. Characteristic of analyzed tea samples and found fluoride content Plant species (Tea type
and name) Plant part (Tea form) Package type Country of origin Country packed in
F−/mg L−1
Mint
1. Mentha piperita leaf bags Austria Austria 0.1147
2. Mentha piperita leaf bags Croatia Croatia 0.1106
3. Mentha piperita leaf bags Croatia Croatia 0.1106
4. Mentha piperita leaf bags Croatia Croatia 0.1062
5. Mentha piperita leaf bags Croatia Croatia 0.1018
6. Mentha piperita leaf bags Poland Germany 0.1106
7. Mentha piperita leaf bags China UK 0.1252
8. Mentha piperita leaf bulk Croatia Croatia 0.4335
9. Mentha piperita leaf bulk Croatia Croatia 0.3668
10. Mentha piperita leaf bulk Croatia Croatia 0.3540
11. Mentha piperita leaf bulk Serbia Croatia 0.3411
12. Mentha piperita leaf bulk Croatia Croatia 0.3104
13. Melissa officinalis leaf bulk Croatia Croatia 0.3411
14. Melissa oficinalis leaf bulk Croatia Croatia 0.3309
Green tea
1. Camellia sinensis leaf bags China Croatia 0.5086
2. Camellia sinensis leaf bags China Croatia 0.0853
3. Camellia sinensis leaf bags Austria Austria 0.0456
4. Camellia sinensis leaf bags China Croatia 0.0163
5. Camellia sinensis leaf bags China Russia 0.0272
Chamomile
1. Matricaria chamomilla leaf bags Croatia Croatia 0.0023
2. Matricaria chamomilla leaf bags Croatia Croatia 0.0001
3. Matricaria chamomilla leaf bags Croatia Croatia 0.0012
4. Matricaria chamomilla leaf bags Croatia Croatia 0.0001
5. Matricaria chamomilla leaf bags Croatia Croatia 0.0356
6. Matricaria chamomilla leaf bags Croatia Croatia 0.4225
7. Matricaria chamomilla leaf bags Croatia Croatia 0.1778
8. Matricaria chamomilla leaf bags Croatia Croatia 0.0256
9. Matricaria chamomilla leaf bags Croatia Croatia 0.4367
10. Matricaria chamomilla leaf bags Croatia Croatia 0.1447
The amount of fluoride in tea infusion was analyzed by potentiometric methods using previously described FISE. Due the high acidity of microwaved samples (pH = 0.5), 1.0 mL of each samples were partially neutralized by adding 0.52 mL of 10 % NaOH and subsequently diluted by acetic buffer, pH = 5.0 mixed with NaNO3 in 25 mL flask to keep both ionic strength and pH constant. During the measurement solutions were constantly mixing, and temperature was kept constant at 25 °C. All measurements were lasted for five minutes and potential values were recorded every three seconds and sent to PC. Final value was represented as recorded potential average after conversion to concentration.
In Table 1. are given all collected information about analyzed tea as type of tea, name, geographic origin, shape and additive.
After collecting all data, we performed a statistical evaluation of collected data. An average F− concentration was 0.183±0.161 mg L−1. By analyzing mint samples it can be concluded that packaging and processing ways have influence to fluoride content since the samples from industrial production have 0.111 mg L−1 ± 0.0073 mg L−1 F− and samples made of wild plants 0.354 mg L−1 ± 0.039 mg L−1 F−, with probability of productions being equal of less than 0.001. Main conclusion is that processing ways reduce fluoride content for approximately three times, although all mint samples are from the same country and were grown practically at the same geographic area. By comparing collected data with teas’ infusion data [18], it can be seen that all tested mint samples release practically the same fluoride content during tea brewing. The released fluoride concentrations are about 10 times lower for industrial processed mint samples and approximately 40 times lower for wild growth mint plants. Green tea samples have fluoride content in the range from 0.0163 mg L−1 to 0.509 mg L−1. It is very interesting that green tea samples have very diverse total fluoride content. In our previous investigations [18] it was established that fluoride content in tea infusions is the highest for green tea. Due to the known facts, it is reasonable to conclude that green teas have high tendency to release fluoride ions during tea brewing. The biggest diversity in total fluoride content was found in chamomile samples within concentration range from 0.0001 mg L−1 to 0.437 mg L−1.
In order to get a better insight into the fluoride content in different plant samples, a statistical data analysis using the program R was performed. We performed one-way analysis of variance after all samples collected passed normality test.
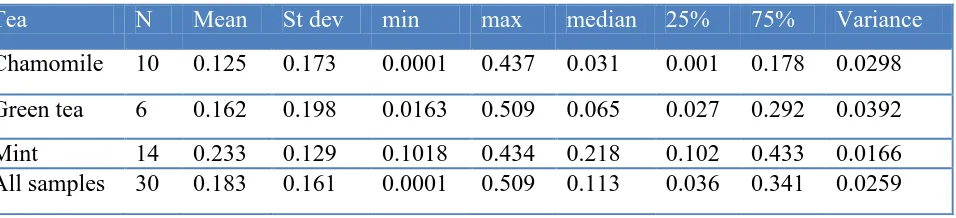
Table 2. Fluoride content in tea infusions from chamomile, mint and green tea (mg L )
Tea N Mean St dev min max median 25% 75% Variance
Chamomile 10 0.125 0.173 0.0001 0.437 0.031 0.001 0.178 0.0298 Green tea 6 0.162 0.198 0.0163 0.509 0.065 0.027 0.292 0.0392 Mint 14 0.233 0.129 0.1018 0.434 0.218 0.102 0.433 0.0166 All samples 30 0.183 0.161 0.0001 0.509 0.113 0.036 0.341 0.0259
Therefore in order to analyze whether content of fluoride in tea is affected by type of herb F-test was performed. F-statistic of 1.413 was not statistically different (p=0.26089) to exclude the possibility that the difference is due to random sampling variability. It is important to emphasize that there is not significant statistical impact of packing type to fluoride content in all analyzed teas, although in Table 1 can be seen difference in fluoride content for mint samples. The observed case could be used as topic in further investigations.
4. CONCLUSION
In presented article were given analysis The present article gives an analysis of total fluoride content in three types of teas potentiometrically measured by fluoride ion-selective electrode. For green tea and chamomile samples was established significantly bigger data dispersion than for mint teas samples. Green tea samples have total content in range from 0.0163 to 0.509 mg L−1. Among mint tea samples should be recognized difference between industrial processed samples, fluoride content from 0.1018 to 0.1252 mg L−1 and samples made of wild plants from 0.3104 to 0.4335 mg L−1 F−, respectively. Chamomile samples have total content in range from 0.0001 to 0.4367 mg L−1 with the highest recorded dispersion. Generally, the biggest recorded total fluoride content (0.5086 mg L−1) was found in green tea sample and the lowest one (0.0001 mg L−1) in chamomile. When data for total fluoride content are compared with ones for fluoride content in tea’s infusion, it can be seen that green tea samples have the highest tendency for fluoride releasing among analyzed tea samples. Despite all it is hard to say what is the safest tea for consumption because there are few facts that influence to fluoride extraction during brewing process. The best ways for consumers is obeying manufacturer’s recommended procedure for tea preparation and assure them of possible fluoride poisoning.
References
1. S. Tokalioğlu, S. Kartal, U. Şahin Turk. J. Chem. 28 (2004) 203.
2. M. S. Onyango, Y. Kojima, O. Aoyi, E. C. Bernardo, H. Matsuda J. Colloid Interface Sci 279 (2004) 341.
3. C. Badet, B. Richard EMC-Dent. 1 (2004) 40.
5. P. P. Singh, M. K. Barjatiya, S. Dhing, R. Bhatnagar, S. Kothari, V. Dhar Urol. Res. 29 (2001) 238.
6. J. M. Pettifor, C. M. Schnitzler, F. P. Ross, G. P. Moodley Bone Miner. 7 (1989) 275. 7. P. T. C. Harrison J. Fluor. Chem. 126 (2005) 1448.
8. E. Tohyama J. Epidemiol. 6 (1996) 184.
9. K. Takahashi, K. Akiniwa, K. Narita J. Epidemiol. 11 (2001) 170.
10. C. Y. Yang, M. F. Cheng, S. S. Tsai, C. F. Hung Environ. Res. 82 (2000) 189. 11. J. Cao, J. Liu, Y. Zhao, H. Qu, S. Danzeng, W. Da, Y. Guan Fluoride37 (2004) 296. 12. J. Cao, Y. Zhao, Y. Li, H. J. Deng, J. Yi, J. W. Liu, Food Chem. Toxicol. 44 (2006) 1131. 13. A. Messaïtfa Environ. Geol. 55 (2008) 377.
14. A. H. Mahvi, M. A. Zazoli, M. Younecian, Y. Esfandiari Fluoride 39 (2006) 266.
15. E. Malinowska, I. Inkielewicz, W. Czarnowski, P. Szefer Food Chem. Toxicol. 46 (2008) 1055. 16. M. S. Frant, J. W. Ross jr., Science, 154 (1966) 1553.
17. A. Prkić, J. Giljanović, S. Petričević, M. Brkljača, M. Bralić, Anal. Lett. 46 (2013) 367. 18. J. Giljanović, A. Prkić, M. Brkljača, M. Bralić, Int. J. Electrochem. Sci. 7 (2012) 2927.